Article No. : 13
My Bio & Scientific Articles [HERE]
The 5th Scientific Post of “Sea Level Rise (SLR) Solutions” Series
Important Note:
If you have LinkedIn account, I prefer to comment in my post link [HERE]. You will find the information of how to contact me as LinkedIn website will be as a trust tool to identify yourself to me & it prefer that you have sufficient connections there. I don’t like to waste my time with anonymous persons & faking companies.
Episode 5 (Recent)
Episode 6 (Coming Later)
Index of Episode 5
-
Introduction
-
Hydrogen Fuel Potentials & Challenges
-
Electrolysis Process
-
Fuel Cells
-
Deep water Technique (DWT)
-
Engineering Analysis of electrolysis effect in Deep water
-
Aero-Oceanic Power (Proposed Technology)
-
Engineering Analysis of Aero-Oceanic Power
-
Advantages of Deep Water Technique (DWT)
-
Challenges of Applying Deep Water Technique (DWT)
-
Miscellaneous Notes
-
Conclusion
-
Citations (Reference, Articles & Websites)
Introduction:
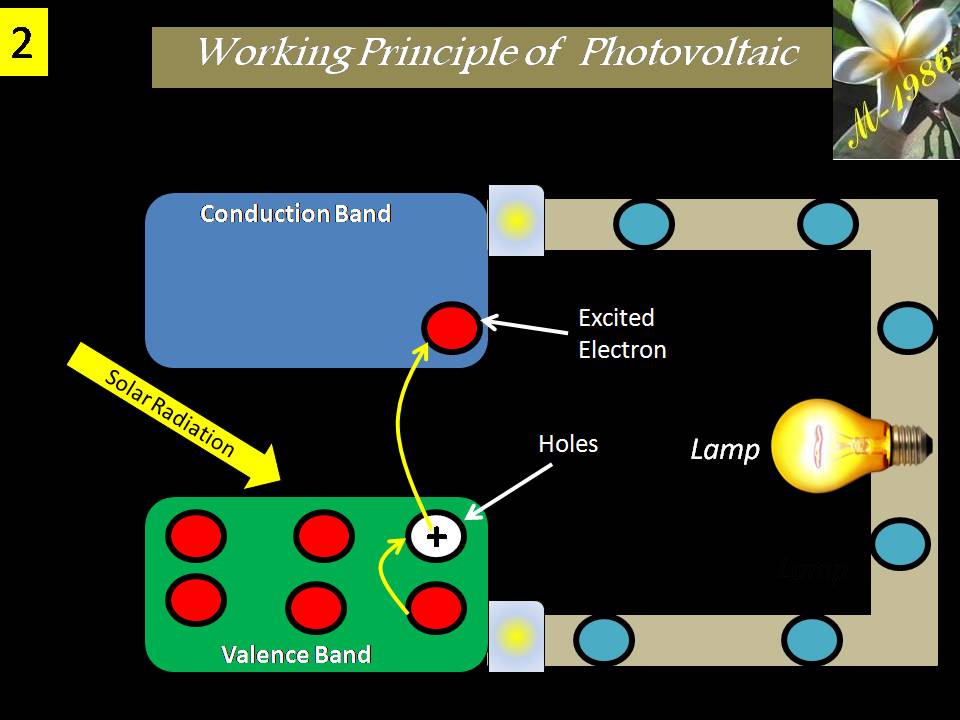
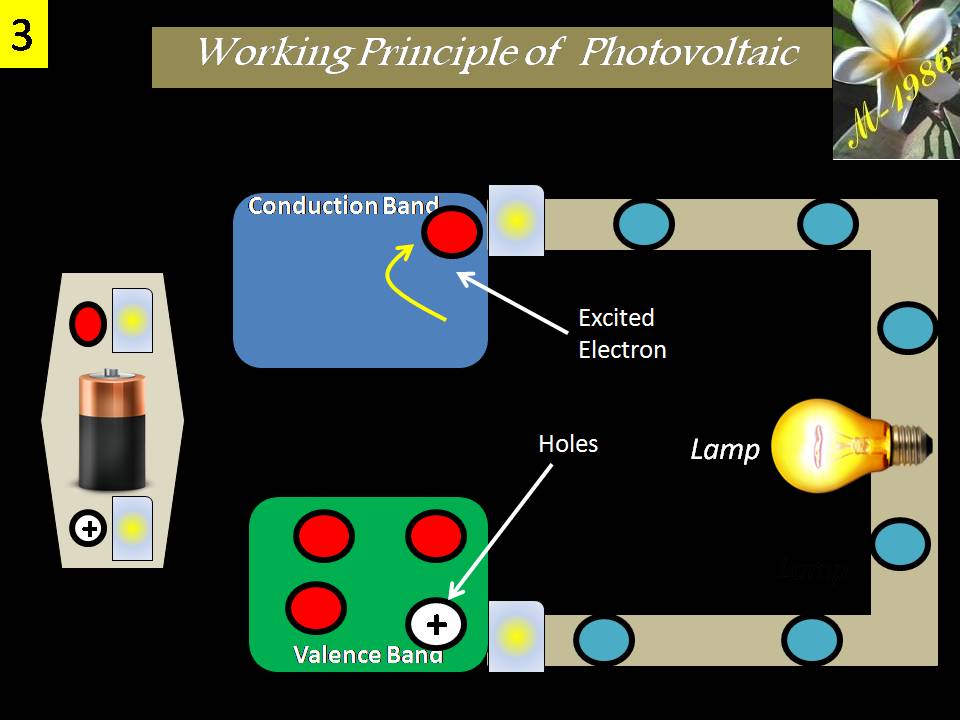
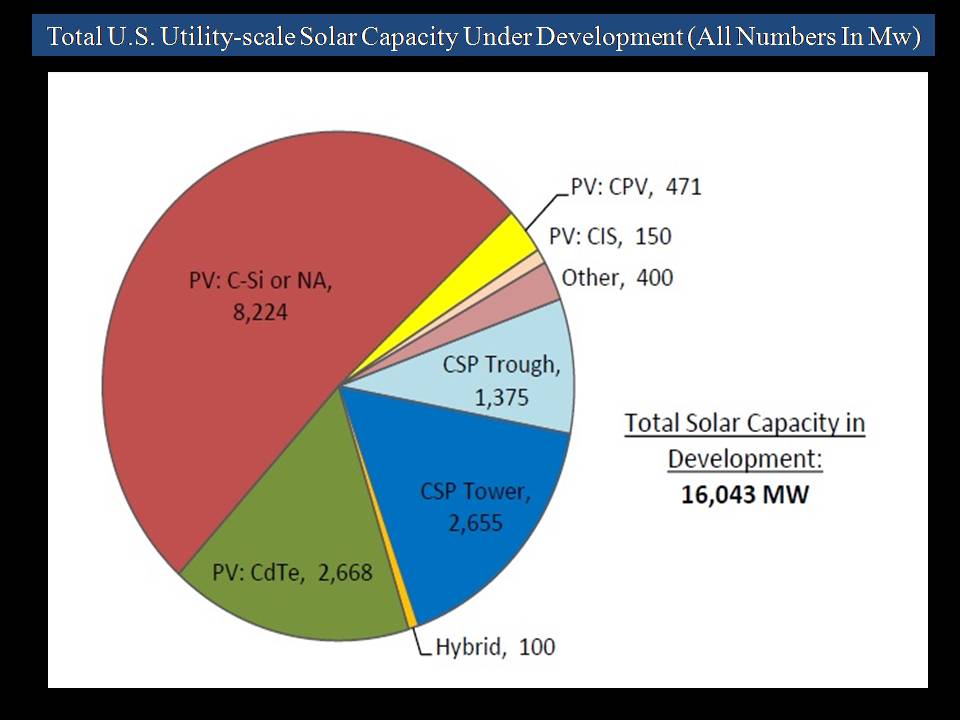
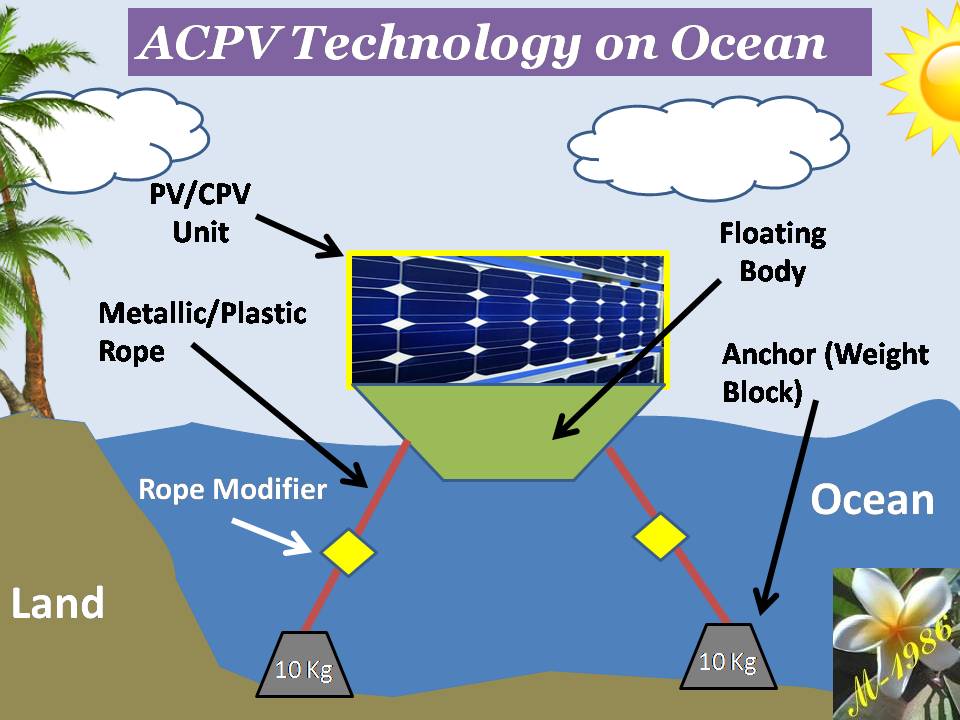
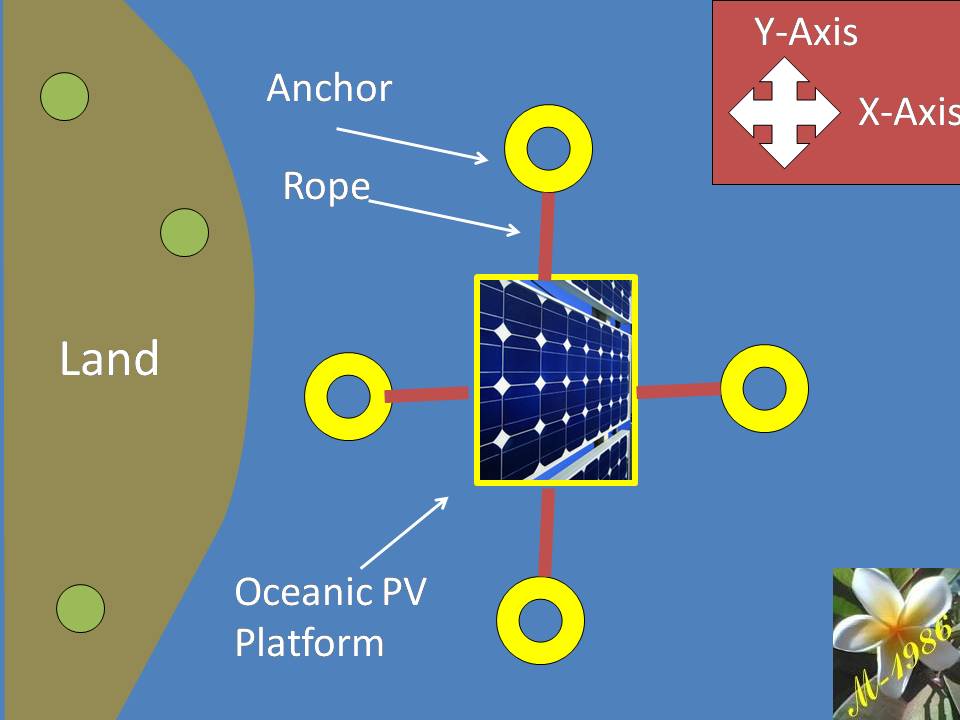
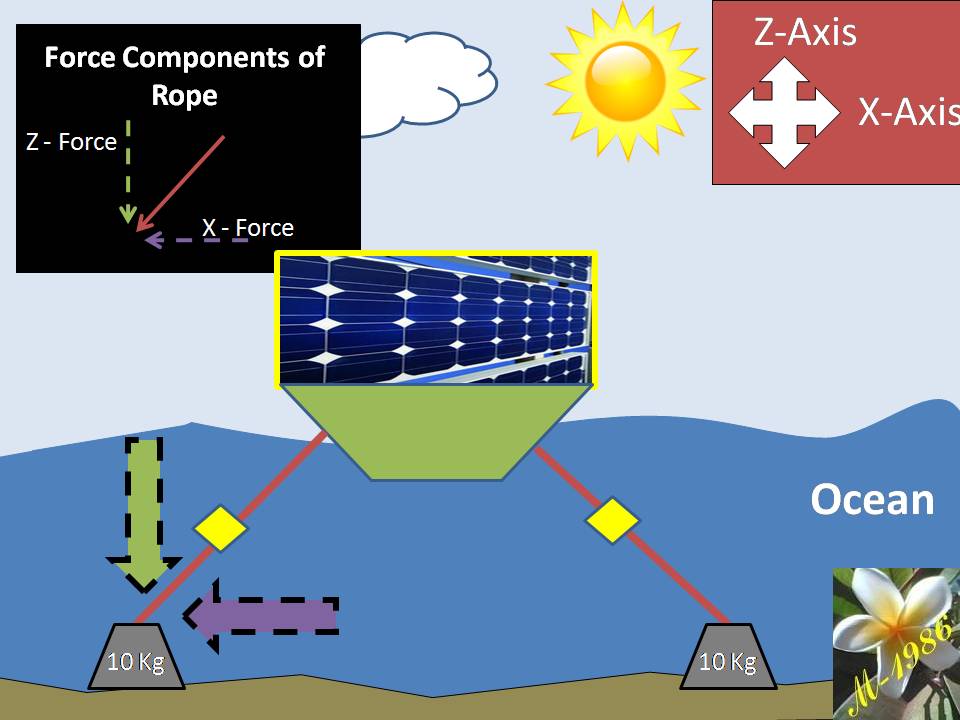
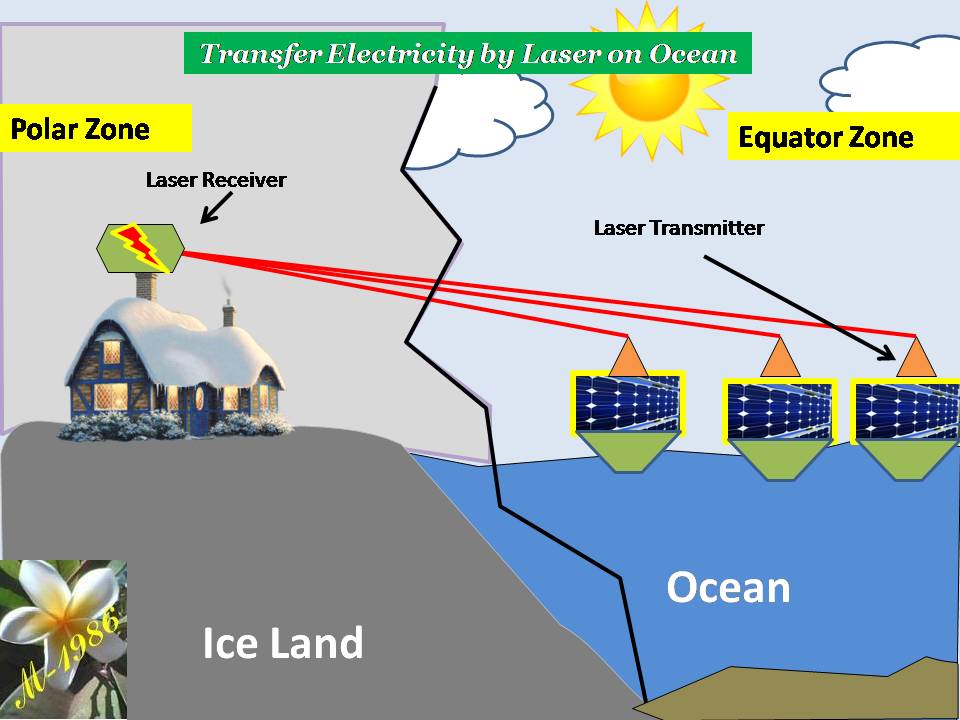
In our previous episode of Sea Level Rise (SLR) Solutions series, we have discussed the matter of how to produce electricity on ocean by using Photo-voltaic (PV) technology (Link here).
In this scientific post we will talk about innovative & disruptive proposed technology which may change the balance & strategies of international energy market of fossil fuel (coal, oil & natural gas) for many countries especially for concentrated population in coastal cities & definitely we can’t forget the positive effect towards our lovely earth on the environmental sides.
The main purpose of this post is to produce hydrogen.
Firstly, we will give a short brief of hydrogen gas & its applications nowadays. Secondly, we will discuss the components of Deep Water Technique (DWT). We will give an theoretical engineering analysis of how electrolysis efficiency will increase in the depth of ocean as a result of high pressure.
Then, we will introduce new system of producing electricity by utilizing from the aerodynamic motion of both oxygen & hydrogen gases from the bottom of seawater as they are a chemical products of electrolysis effect. This fascinating method will let us to produce more than 18.5 GJ/Day if we intend to produce 20 Kg of Hydrogen gas only. It gives unexpected energy & high efficiencies for hydrogen fuel industry.
I named this kind of power by “Aero-Oceanic Power” & it will require a magical system to achieve it goals successfully.
In the end, we will give some advantages & challenges of applying Deep water technique (DWT) on ocean & how to overcome these problems & obstacles.
I will tell the story of how i find all these creative ideas of Deep Water Technique (DWT) & Aero-Oceanic Power (AOP).
Enjoy reading with exciting scientific post which may change the energy industry globally.
Hydrogen Fuel (Potentials & Challenges):
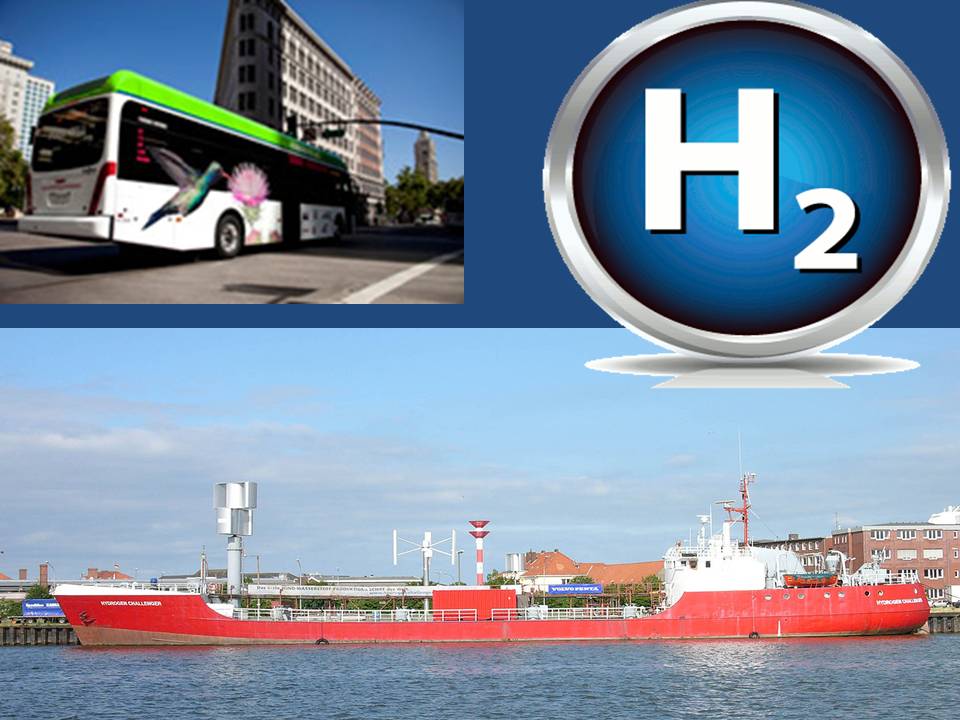
Figure (1) – Hydrogen fuel & it’s applications
Basics:
Hydrogen fuel is considered as futuristic energy for humankind & environment because it doesn’t produce any harm gases which effect on the global warming such as Carbon Oxide/monoxide or CFCs group – Chlorofluorocarbons.
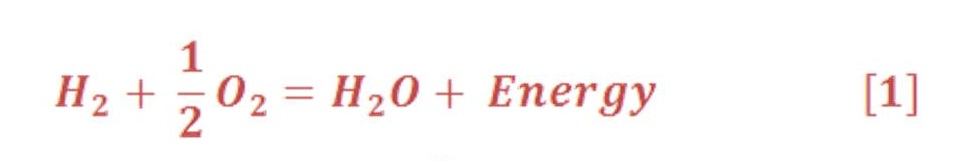
It contains only hydrogen atoms in stable condition which is called molecules. Hydrogen is a gas situation in Standard Pressure & Temperature (STP). The chemical symbol of stable hydrogen gas molecule is H2 & its burned with Oxygen to produce vapor/water spontaneously (we will know later the term of spontaneous reaction when we discuss the electrolysis) according to the chemical equation (1):
Although Hydrogen fuel is considered as a zero emission fuel, but it will produce vapor which is represent one element of green-house gases (GHG) emissions which is effect directly on the global warming unless we convert water from vapor to liquid status by condensation process.
Anyway, it’s not our purpose to investigate how vapor may effect on the global warming in this scientific post. We have discuss these matters in previous episode (Link Here).
Hydrogen Energy
Energy will be rejected from the system to the environment & the value of it is depend on the status of water (vapor or liquid).
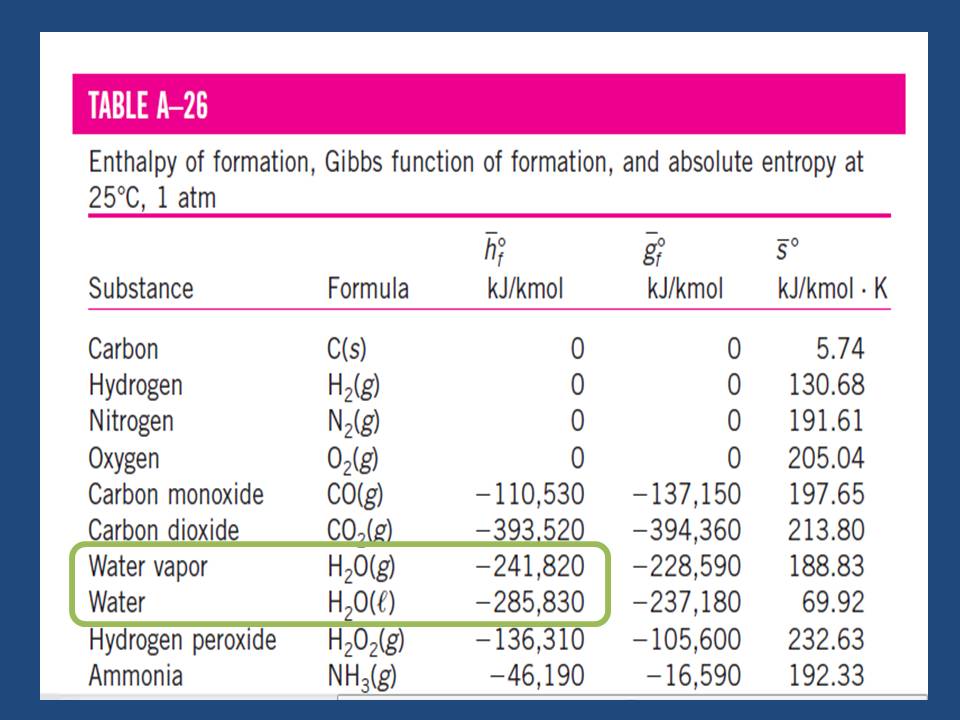
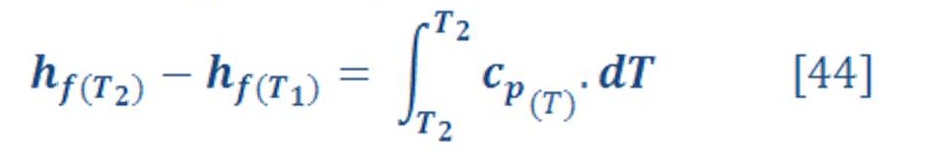
The produced energy per mol of combustion process of hydrogen (It’s called also the enthalpy of formation enthalpy “hf”at STP ) is approximately equal to 241.8 KJ/mol for vapor of water. By mass expression, it’s equivalent to 120.9 MJ/kg of Hydrogen gas as we see in table (1) which represent the formation enthalpy, Gibbs energy & the absolute entropy of some materials. The negative sign means it’s an exothermic reaction (heat is rejected out the system into the surrounding) for producing these materials. [Ref-1]
Table (1) – Formation enthalpy, Gibbs Free Energy & absolute entropy of some substances
If the water product is in the liquid status (cooling process), thus the enthalpy of formation is equal to 285.8 KJ/mol.
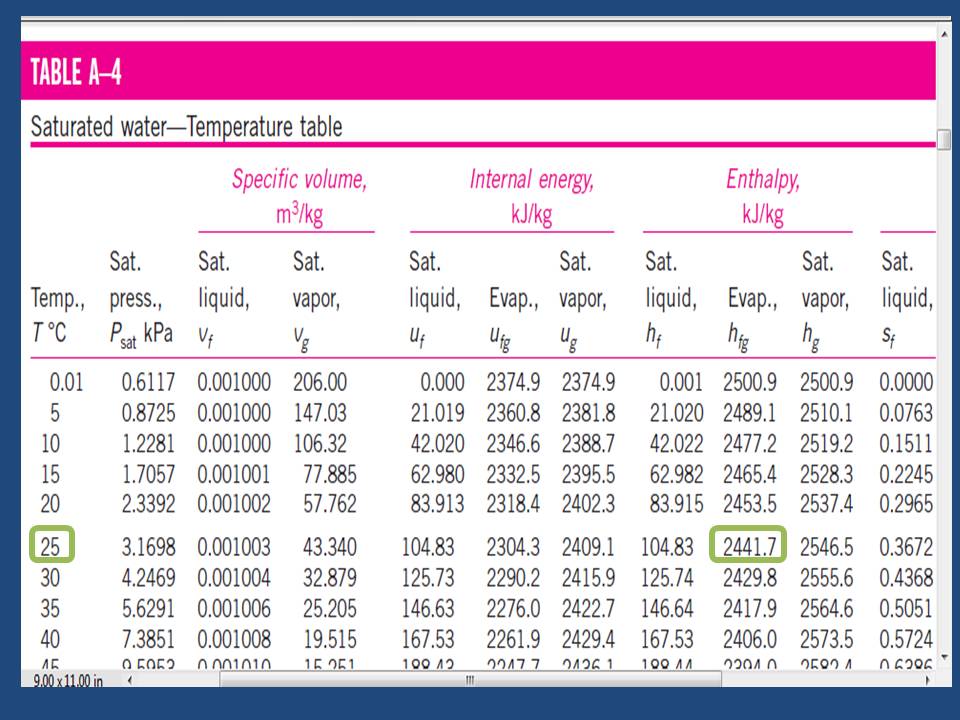
The difference between the enthalpy of formation of vapor & liquid water is very interesting. Its represent the energy which is required to convert vapor into liquid at 25 ⁰C & it equal approximately to 44 KJ/mol ( 2444.4 KJ/Kg of water)
From steam table we will notice that enthalpy difference at 25 ⁰C is 2441.7 KJ/Kg as we see in table (2) which is represent the thermodynamics values table for water & steam. [Ref-1]
Table (2) – Properties of Water & Steam:
Hydrogen Production:
There are many famous methods for producing hydrogen gas such as [Ref-3]:
- Natural gas: Nearly all of the hydrogen used in the United States (95 percent) is produced through a process called steam methane reforming. This process breaks down methane (CH4), a hydrocarbon, into hydrogen and carbon dioxide (CO2). The methane in natural gas is reacted with water (in the form of high-temperature steam) to produce carbon monoxide and hydrogen. These gases are reacted with water again, in a process called a water shift reaction, to produce more hydrogen and CO2.
- Gasification: Gasification processes include a series of chemical reactions in which coal or biomass is “gasified” (i.e., converted into gaseous components) using heat and steam. A series of chemical reactions is then used to produce a synthesis gas (a gas mixture that contains varying amounts of carbon monoxide and hydrogen), which is reacted with steam to produce more hydrogen. Producing hydrogen via coal gasification is significantly more efficient than burning coal to produce electricity that is then used in electrolysis. Although gasification technology is commercially available, the challenge is lowering the amount of CO2 emitted from the process to decrease upstream emissions from the use of FCVs. Coal gasification with carbon capture and sequestration (CCS) or biomass gasification can produce hydrogen with very low or no net GHG emissions, although both these technologies are only in the early stages of commercial-scale deployment.
- Electrolysis: In electrolysis, an electric current is used to split water into hydrogen and oxygen. Electrolysis is in advanced stages of technological development and could play an important role in the near to mid-term. Net GHG emissions from electrolysis for hydrogen production depend on the source of the electricity used. If powered by electricity from low-carbon sources (i.e., renewable technologies, nuclear, power, or fossil fuels coupled with CCS), the process generates little to no GHG emissions.
With nuclear high-temperature electrolysis, the efficiency of the process increases. In this type of electrolysis, the heat from the nuclear reactor is used to increase the water temperature and thereby reduce the amount of electricity needed for electrolysis.
High-Temperature Thermo-chemical Water-Splitting: This is another water-splitting method that uses high temperatures from nuclear reactors or from solar concentrators (lenses that focus and intensity sunlight) to generate a series of chemical reactions that split water, producing hydrogen. The process is in the early stages of development but considered a potential long-term technology, since it is powered by non-GHG emitting technologies and yields a very low-carbon hydrogen fuel.
- Photo-biological and Photo-electrochemical Processes: These processes use energy from sunlight to produce hydrogen, although both are currently in early stages of research. Photo-biological processes use microbes, such as green algae and cyano-bacteria. When these microbes consume water in the presence of sunlight, hydrogen is produced as a byproduct of their metabolic processes. Using special semiconductors and sunlight, photo-electrochemical systems produce hydrogen from water as well.
Figure (2) shows the effect of hydrogen production by several methods on Green House Gas (GHG). [[Ref-3]]
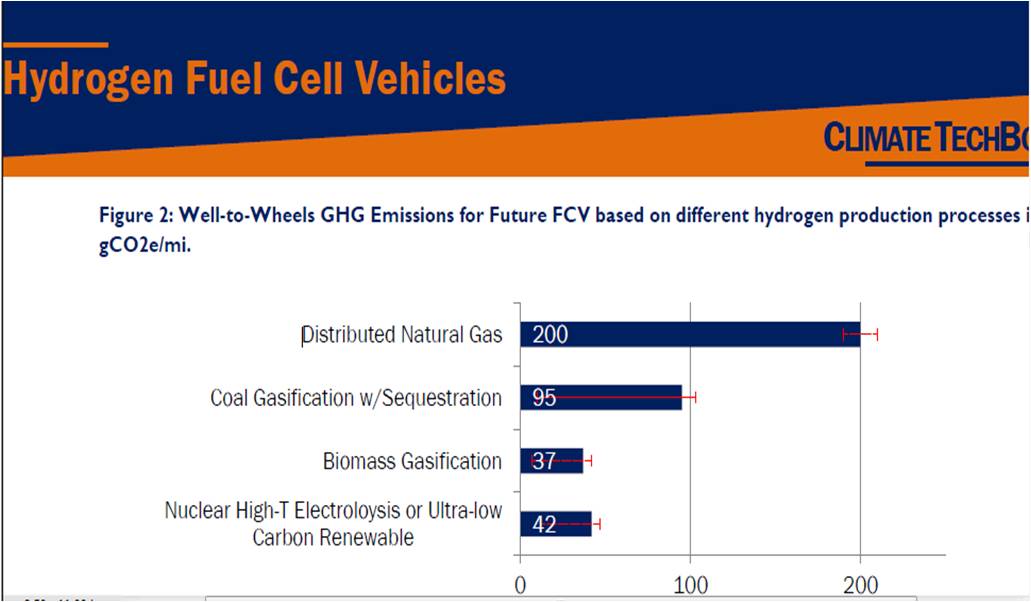
Figure (2) – Effect of Hydrogen Production on GHG.
Cost of Hydrogen Fuel:
Although the cost of fuel cells have decreased significantly, the cost for a fuel cell system is almost double that of an internal combustion engine.
A study by Directed Technologies, Inc. for the DOE estimated the lowest production costs for an FCV with an 80 kilowatt (kW) system with production levels of 500,000 systems a year. The study found that current costs for a fuel cell system (in 2010) are approximately $51/kW, close to the DOE target of $45/kW.
For 2015, the study projected that costs would decrease to $39/kW by 2015. The DOE goal for that year is $30/kW.
In addition to system costs, the costs of hydrogen storage are still much higher than the target set for commercialization, which is $2 per kilowatt-hour (kWh). Currently, on-board storage costs are $15-18/kWh, depending on the level of storage pressure. [[Ref-3]]
Hydrogen Storage
Developing safe, reliable, compact, and cost-effective hydrogen storage technologies is one of the most technically challenging barriers to the widespread use of hydrogen as a form of energy. To be competitive with conventional vehicles, hydrogen-powered cars must be able to travel more than 300 mi between fills. This is a challenging goal because hydrogen has physical characteristics that make it difficult to store in large quantities without taking up a significant amount of space.
Hydrogen storage will be required on-board vehicles and at hydrogen production sites, hydrogen refueling stations, and stationary power sites. Possible approaches to storing hydrogen include:
- Physical storage of compressed hydrogen gas in high pressure tanks (up to 700 bar);
- Physical storage of cryogenic hydro¬gen (cooled to -253°C, at pressures of 6-350 bar) in insulated tanks; and
- Storage in advanced materials — within the structure or on the surface of certain materials, as well as in the form of chemical compounds that undergo a chemical reaction to release hydrogen.
Traditional compressed hydrogen gas tanks are much larger and heavier than what is ultimately desired for light-duty vehicles. Researchers are evaluating.
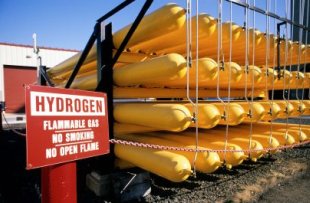
Figure (3)- Hydrogen Fuel Tanks
light-weight, safe, composite materials that can reduce the weight and volume of compressed gas storage systems.
Liquefied hydrogen is denser than gas¬eous hydrogen and thus it contains more energy in a given volume. Similar sized liquid hydrogen tanks can store more hydrogen than compressed gas tanks, but it takes energy to liquefy hydrogen. However, the tank insulation required to prevent hydrogen loss adds to the weight, volume, and costs of liquid hydrogen tanks. Researchers are also studying a hybrid tank concept that can store high-pressure hydrogen gas under cryogenic conditions (cooled to around -120 to -196°C) — these “cryo-compressed” tanks may allow relatively lighter weight, more compact storage. [[Ref – 4]]
Distribution Hydrogen Fuel:
“Currently, there is no infrastructure for distributing hydrogen, like that for fossil fuels. Because hydrogen has less energy per unit volume, distribution costs are higher than those for gasoline or diesel. Most hydrogen is produced either on-site or near where it is used, usually at large industrial sites. It is then distributed by pipeline, high-pressure tube trailers, or liquefied hydrogen tankers. Pipeline is the least expensive way to distribute hydrogen; the last two, while more expensive, can be transported using different modes of transportation – truck, railcar, ship, or barge.
Building network of pipelines and filling stations for FCVs would require high initial capital costs. One potential solution is to produce hydrogen regionally or locally to limit issues with distribution. A second is to use a phased approach. At first, hydrogen distribution (and sales of FCVs) could be concentrated in a few key areas. The next phase would expand the distribution sales network by targeting geographic corridors (e.g., New York-Boston-Washington, D.C.) and then gradually expand to other regions. This phased approach would remove the need for stations all across the United States at the outset, and allow for a slower and affordable build-up in the number of stations and areas served over time”. [[Ref-3]]
Potentials Risk of Hydrogen:
(( Hydrogen fuel cells may revolutionize the transportation sector, and possibly, home electricity as well. It’s the fuel—the liquid hydrogen—that undergoes the reaction inside the fuel cell that gives most skeptics pause. It’s kept under intense pressures of 3,000 to 10,000 lbs. per square inch, it’s flammable and the thought of it recalls images of the Hindenburg disaster. The fear is partially built on myth, but there are safety concerns to consider before switching to a hydrogen economy.
Hydrogen is explosive at high concentrations, but its tendency is to burn rather than to explode. That property doesn’t eliminate the explosive danger entirely, but it renders it as safe as any volatile material that is used as fuel. Hydrogen tanks have been subjected to rigorous testing and worst-case scenarios. In a study published in the November 1996 issue of “The New Scientist,” physicist Rob Edwards tested a full hydrogen tank by engulfing it in a 1600-degree flame for 70 minutes without incident. He also punctured a tank with armor piercing bullets. The hydrogen sometimes burned and sometimes dissipated, but it did not explode.
Hydrogen is extremely flammable, as any chemistry student who has ignited hydrogen in a test tube can attest. It takes 14 times less energy to ignite hydrogen than it does to ignite natural gas, according to a white paper by Amory Lovins for the Rocky Mountain Institute. It does require a concentrations in the air four times higher than gasoline vapor for ignition, however, making hydrogen as fuel a danger similar to any flammable fuel in use today, according to Lovins. Hydrogen does pose an added danger to first responders in the event of a fire because a hydrogen flame is virtually invisible in daylight.
Liquid hydrogen immediately effervesces on contact with air at standard temperature and pressure. An abundance of gathered hydrogen in areas that are not well ventilated poses an asphyxiation risk to people in the area. Hydrogen gas is odorless and colorless, and the reaction with oxygen that would turn the free hydrogen into harmless water vapor happens very slowly at ambient temperature. As a result, the free hydrogen creates an oxygen-deficient environment that can cause headaches, depression of the senses, unconsciousness or even death.
Hydrogen can be extracted from a number of “feed-stocks,” including natural gas, water and even oil and coal. The majority of hydrogen for industrial uses is extracted from fossil fuels in a process that releases abundant amounts of carbon dioxide into the atmosphere, according to the Natural Resources Defense Council. Even hydrogen extracted from water, on the whole, does so with electricity produced by fossil fuel sources. Until hydrogen production is carbon neutral, powering cars with hydrogen will not be an effective global warming mitigation strategy)). [[ Web – 1]]
Maybe many people has been asked why there is no a hydrogen cylinder in the kitchen for cooking in any house & hotels ?
The reason is that hydrogen is odorless, so if there are any leakage, you can’t detect it by any member of family as majority of people in the world don’t have excellent awareness & knowledge to deal with these kind of energy in home. So, as safety reason, countries prohibited used it.
Recent LPG cylinder is contained of mixture of butane (C3H8) & propane (C4H10) & the ratio of them (60:40) is depend on season (summer & winter). Both butane & propane are also odorless and we smell a distinctive smell because manufacturers of LPG cylinders are added “Ethyl Mercaptan” to make it easier to detect a leak [ Web-2]
Recently, there are a strong trend internationally to use renewable energy (wind & solar) to produce hydrogen rather than using fossil fuels. Nobody may doubt, that wind & solar energy can’t been compared with the fossil fuels according to the density of energy, as the last type contains very high energy, but in another hand, fossil fuel is extremely harmful elements for the humankind & environment as it rejected too much carbon oxide & vapor as a waste of combustion process especially in high population area such as Beijing , China.

Figure (4) – Effect of air pollution in China .
Hydrogen Applications:
The demand for hydrogen fuel is growing in many application & industries (i.e. Transportation, energy, chemical and refining industries ). It’s an ideal & clean choice.
The high density of hydrogen fuel (120 MJ/kg by LCV) compared by other liquid fuels (i.e. Benzene – 40.1 MJ/Kg ) and gaseous fuel (i.e. Methane – 50.1 MJ/Kg ) is considered as attractive & advantage factor for selection by energy investors especially with respect to the transportation cost between countries by ships. [Ref-1]
“Today, environmental pressures are concentrating hydrogen research and development efforts on hydrogen as an alternative fuel to power our mobility and transportation needs. In electrified vehicles, for example, it’s used to run fuel cells which convert hydrogen efficiently (back) to electricity. The application spectrum of fuel cells is vast. They have the potential to replace conventional power generators such as combustion engines or even large batteries in cars, buses, forklift trucks (FLTs), submarines & backup and power plants.
Emissions are a key issue in ports around the world, compounded by the heavy oils burned by conventional engines. We have already supplied fueling stations for hydrogen-powered ferry boats in Hamburg, Germany for instance”. [[Web – 3]]
Nobody may doubt that Hydrogen (if its abundant & cheap product) may change our lives totally but some dreams can’t be real unless we support the scientific researches as the production, transportation & storage are main challenges for this futuristic industry.
Before we talk about the deep water technique, we should give an introduction for understanding some recent technologies which will be used in the deep water technique.
The technologies components are the electrolysis system of water & fuel cell system. Electrolysis will be explained in detail as it has a direct relationship with deep water technique (DWT) to increase the efficiency of electrolysis process for water. Fuel cell is a secondary components for DWT if we want to produce electricity & purified water. We will mention only how the fuel cell is work.
Definitely the Aero-Oceanic Power (AOP) is the soul of Deep Water Technique (DWT) regardless it’s can be real or imaginary technology. So, we will discuss it in detail & we will see too much style/models for aero oceanic power (AOP) which is give us a flexible option to choose any type according to the economical view of energy investors.
Electrolysis Process
Electrolysis process is part of electrochemistry which is “ the is the branch of chemistry concerned with the inter-conversion of chemical and electrical energy through oxidation–reduction reactions. Electrons are transferred between two half-reactions through external electrical circuits, in contrast to solution-phase redox reactions“.
Energy produced by spontaneous chemical reactions may be converted to electrical energy; conversely, electrical energy can be used to drive chemical reactions that are not normally spontaneous.
Electrochemistry is historically a vital field, primarily for its important industrial applications. Bulk commodity chemicals, such as chlorine, and most metals are produced using large-scale electrochemical processes. In addition, considerable efforts have been directed toward preventing the corrosion of metals (electrochemically triggered oxidation), for example, alloy-based structural materials of pervasive importance in vehicles, ships, airplanes, buildings, and bridges. Another important practical application has been the development of batteries, which produce electrical energy from spontaneous redox reactions in electrochemical cells” . [[Ref – 2]]
There are two types of application for electrochemistry which they are:
- Galvanic Cells (Spontaneous event-Exothermic): Supply electricity if two metals is connected (DC- Batteries types)
- Electrolytic Cells (compulsory event-Endothermic): Need electricity to start chemical reaction (Separating water into hydrogen & oxygen).
Figure (5) shows a galvanic (red-ox) reaction of copper metal with silver solution:
The result of this reaction is by giving a blue solution which is a exist sign of copper (II) ions in the solution & the copper is called oxidized because it lost electron.
In other hand, ions of silver has been reduced as they are received/gain electron. Silver ions has been changed to silver metal. Figure (5) shows the last chemical reaction.

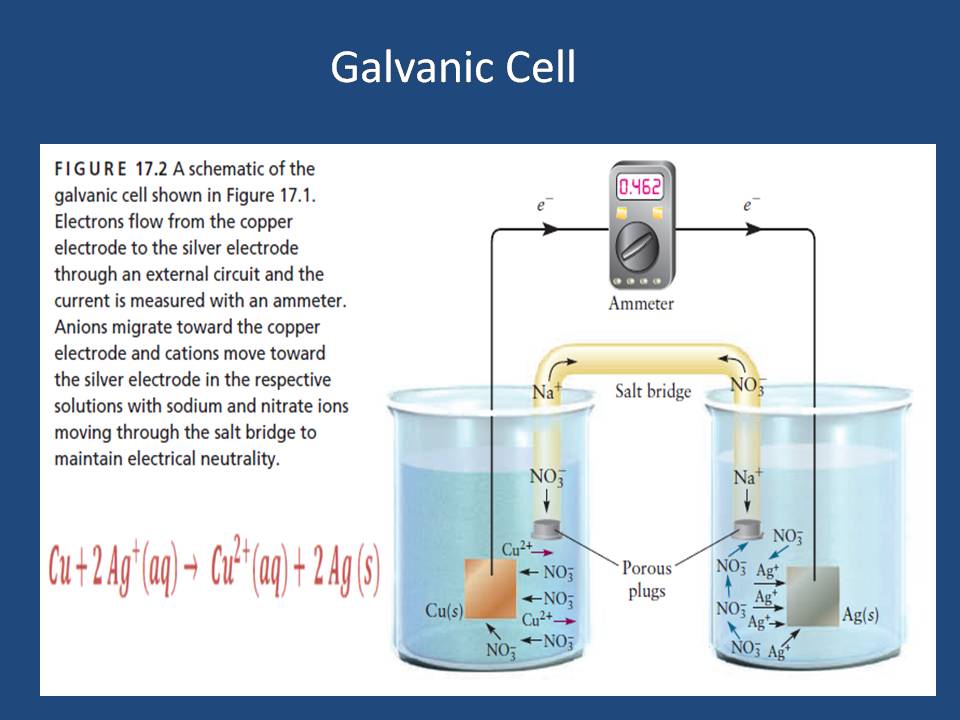
Figure (5) – Galvanic Cell of copper metal with silver solution
Galvanic cells produce electricity as they have negative Gibbs free energy change (We will discuss it later), then the reaction is called “Spontaneous reaction” . All kind of batteries & fuel cell is depend on the working principle of galvanic cell
In contrast, electrolysis process is need to gain energy (i.e. electrical energy) because the Gibbs energy is always positive. As example, the Gibbs energy for water at Standard temperature & pressure (STP) is (-237.81) KJ/mol as we remember in table (1).
“ Electrons being transferred in a galvanic cell reaction spontaneously move from a region of higher electrostatic potential energy on the anode to a region of lower electrostatic potential energy on the cathode, in the same way that water flows downhill. Electrons will flow from the anode to the cathode until the potential energies of the electrons in both half cells are equal to one another, at which point the system has reached equilibrium; there is no longer any electrostatic driving force for the reaction “. [[ Ref – 2 ]]
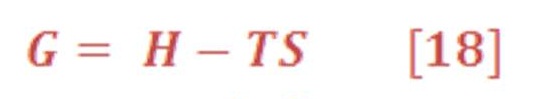
The energy Equation which is governed all chemical reaction & determine either the reaction is spontaneous or not, by the thermodynamics relationship which is presented in equation (3):

Remember that equation (2) is valid only for reversible & isothermal (constant temperature) process. For all electrolysis process, it’s very good approximation to predict the chemical energy of reaction components.
The symbol “ ⁰ “ – superscript – refers to the standard value of material/chemical substances in pressure of 1 atm & 25⁰C, which can be named as Standard Temperature &n Pressure (STP).
Also, there is an important equation related to the enthalpy of reaction &it can be written by equation (4) by:
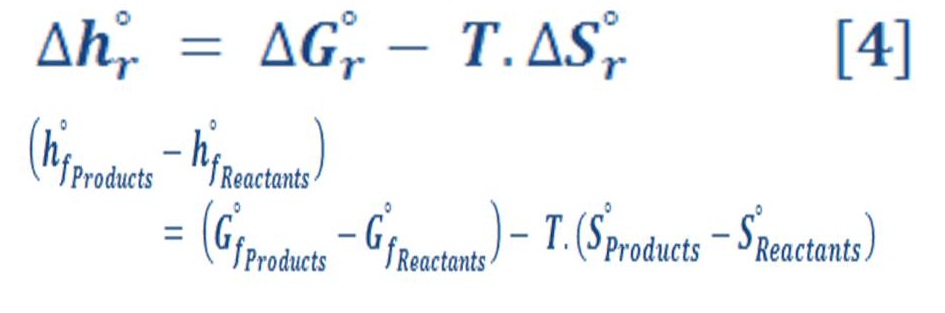
We can calculate easily these value of enthalpy, Gibbs energy & entropy in any different conditions of pressure & temperature by using appropriate thermodynamics equations. We will need these equations to deal with variation of pressure in deep water.
Now let us to give a brief definition for these terms & parameters in equation (3) & (4).
Enthalpy of Formation (Hf) & Reaction (Hr)
First of all we must mention that there is no absolute value for enthalpy at any circumstances. All value of enthalpy is measured according to specified reference state. Because enthalpy is represent a transfer of heat, which it doesn’t have a unique value.
“Peter Atkins in his book “Elements of Physical Chemistry” then writes regarding this equation: The problem with this eqn, is that we have no way of knowing the absolute enthalpies of the substance. To avoid this problem, we can imagine the reaction as taking place by an indirect route, in which the reactants are first broken down into the elements” .[[Web-4]]
Did you hear someone say that heat of fire is 600 J ? It’s impossible.
He/she must refer this value to standard reference. It’s similar to say that, height of Everest mountain is 9000m, but that’s is not true if we are talking about absolute value. Everest mountain height is measured according to the sea level. So, the value of height is relative to specific reference (sea level). What will be the height of Everest height if the water has been raised as a result global warming.
Heat is also an transition status between two different events which let us to make a reference state for it.
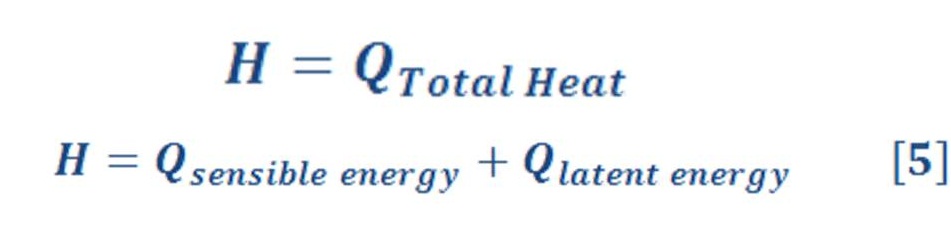
Enthalpy(H) in basic definition is quantity of heat which is absorbed or released from specific substances at constant pressure according to the equation (5) when there is no work (W = 0):
Sensible energy is depend on temperature difference between initial &final status of material like; dissipating a heat from hot metal plate which was inside the furnace.
Latent energy occur in phase transition status such as converting water from liquid to vapor phase. There are a quantity of heat which must be added but the temperature of boiling/freezing is constant & you can’t allege that there is no need to supply a heat because the experiments deny this logic mind thinking method.
Also, chemical bonds in water must be strengthened/weakened by some energy either by force or special type of energy (heat) at constant temperature.
“ During a chemical reaction, some chemical bonds that bind the atoms into molecules are broken, and new ones are formed. The chemical energy associated with these bonds, in general, is different for the reactants and the products.
Therefore, a process that involves chemical reactions involves changes in chemical energies, which must be accounted for in an energy balance as we see in figure (6-A).
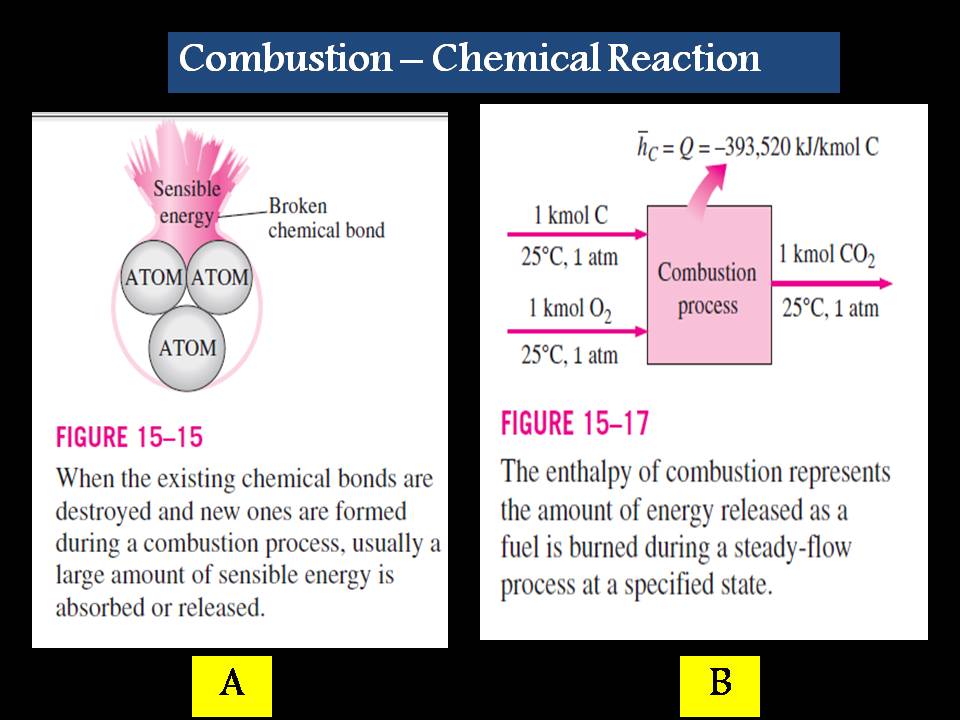
Figure (6) – Chemical Reaction Effect
In thermodynamics we are concerned with the changes in the energy of a system during a process, and not the energy values at the particular states. Therefore, we can choose any state as the reference state and assign a value of zero to the internal energy or enthalpy of a substance at that state. When a process involves no changes in chemical composition, the reference state chosen has no effect on the results.
When the process involves chemical reactions, however, the composition of the system at the end of a process is no longer the same as that at the beginning of the process. In this case it becomes necessary to have a common reference state for all substances.
The chosen reference state is 25°C (77°F) and 1 atm, which is known as the standard reference state. Property values at the standard reference state are indicated by a superscript (°) (such as h° and u°).
Since both the reactants and the products are at the same state, the enthalpy change during this process is solely due to the changes in the chemical composition of the system.
This enthalpy change is different for different reactions, and it is very desirable to have a property to represent the changes in chemical energy during a reaction. This property is the Enthalpy of Reaction (hR), which is defined as the difference between the enthalpy of the products at a specified state and the enthalpy of the reactants at the same state for a complete reaction.
For combustion processes, the enthalpy of reaction is usually referred to as the Enthalpy of Combustion (hC), which represents the amount of heat released during a steady-flow combustion process when 1 kmol (or 1 kg) of fuel is burned completely at a specified temperature and pressure (Fig. 6-B).
The enthalpy of combustion is obviously a very useful property for analyzing the combustion processes of fuels. However, there are so many different fuels and fuel mixtures that it is not practical to list hC values for all possible cases. Besides, the enthalpy of combustion is not of much use when the combustion is incomplete. Therefore a more practical approach would be to have a more fundamental property to represent the chemical energy of an element or a compound at some reference state. This property is the enthalpy of formation h f , which can be viewed as the enthalpy of a substance at a specified state due to its chemical composition.
To establish a starting point, we assign the enthalpy of formation of all stable elements (such as O2, N2, H2, and C) a value of zero at the standard reference state of 25 °C and 1 atm. That is, hf = 0 for all stable elements. (This is no different from assigning the internal energy of saturated liquid water a value of zero at 0.01°C).
Perhaps we should clarify what we mean by stable. The stable form of an element is simply the chemically stable form of that element at 25°C and 1 atm. Nitrogen, for example, exists in diatomic form (N2) at 25°C and 1 atm. Therefore, the stable form of nitrogen at the standard reference state is diatomic nitrogen “N2”, not monatomic nitrogen “N”. If an element exists in more than one stable form at 25°C and 1 atm, one of the forms should be specified as the stable form. For carbon, for example, the stable form is assumed to be graphite, not diamond.” [[Ref-1]]
For the enthalpy of reaction, it is represented by equation (6):
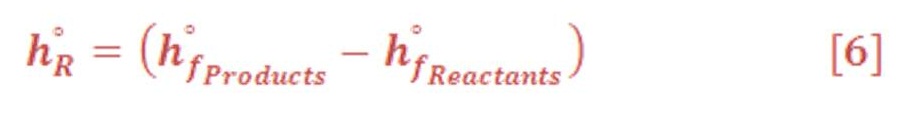
If the Hr < 0, so the reaction produces a reduction in enthalpy and is exothermic ( heat is given up by the rock and gained by the surrounding ) and vice versa is true for endothermic.
Entropy Change (S)
Entropy in very simple definition according to the microscopic scale is a measure of the order or disorder of atoms & molecules inside the system under study.
Imagine that you have a box which have 4 balls which was organized as we see in figure (7-A). As we notice balls can’t neither change their arrangement positions with another balls nor move to another place as there are constraint board which is prevent any motion.
Assume that box has been expanded, now balls will have temporarily free motion according to new conditions. The arrangements of ball inside box has been changed & there are many probabilities events may be exist for each balls inside the box which is depend on the expansion effect as we see in figure (7-B).
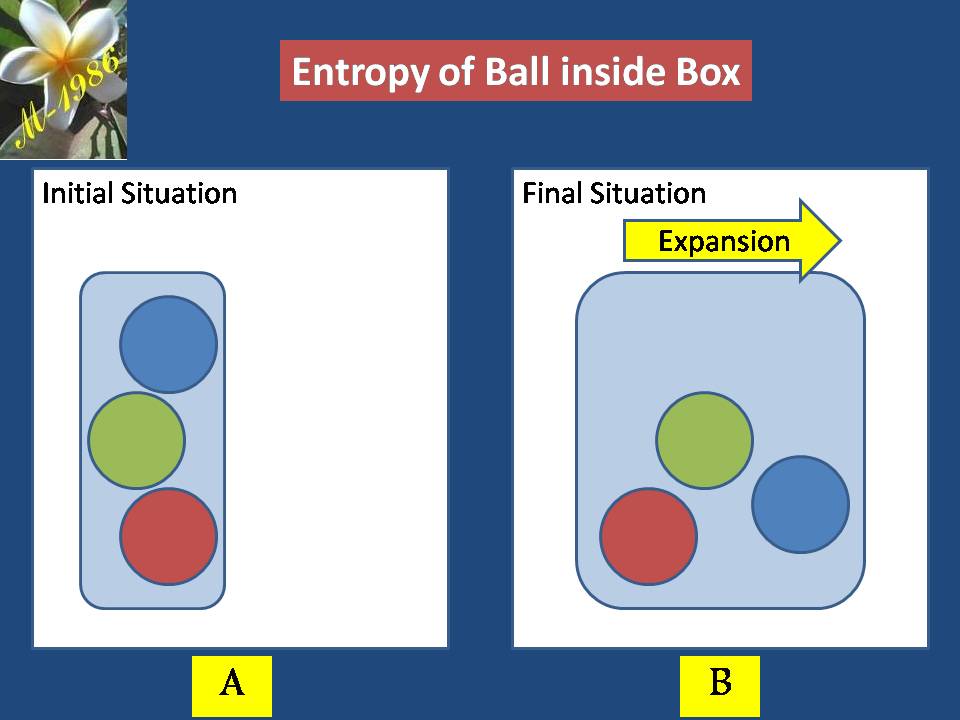
Figure (7) – Entropy of ball inside expanded box
If your room/office/street is always clean & suddenly one-day ,you see it very dirty. You will feel a strange thing moved inside you mind &your it may kill you if you are concerned with high level of order.
Vice versa situation, if your room/street is very clean although it was very dirty , you will be happy & you will feel like a beautiful bird which nobody can catch him.

Figure (8) – Entropy in Life
(recall I use phrase ‘very” to give you how much change has been happen between two events in short time), you will be in boiling That’s happen because the human nature tends to be in order.
If you lived in disorder group/community & you accept to live with them similar to their life style, you will notice that your life is wrong but outside your group/community you are wrong because they prefer to be in order life rather than disorder/chaos life. That’s entropy in life’s meaning.
Rapid & sharp changing of person’s life will let him to be close to the death because he/she can’t deal with new circumstance gradually. It was happen without any warning. Economical crisis, Bankruptcy, robbery wars terror , friends treason & betrayal marital infidelity especially when there is a children, all these kind may be classified as rapid sharp change.
Note : almost information under here has been taken from [[Ref-2]] : Principles of Modern Chemistry , Seventh Edition (2012) – David W. Oxtoby, H.P. Gillis, Alan Campion – Brooks/Cole
“ The equation (7) connecting entropy S and the number of available microstates V is :
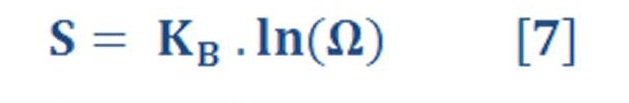
which was originally discovered by the Austrian physicist Ludwig Boltzmann in the late 19th century (Fig. 13.4). Boltzmann’s constant kB (see Equation 9.14) is identified as R/NA, the ratio of the universal gas constant R to Avogadro’s number NA.
Thus, entropy has the physical dimensions J K21. It is impossible to overstate the importance of Boltzmann’s relation, because it provides the link between the microscopic world of atoms and molecules and the macroscopic world of bulk matter and thermodynamics. Although this equation holds quite generally, it is difficult to apply because calculating V is a daunting theoretical task except for the simplest ideal systems. Other equations are used for practical applications in statistical thermodynamics.
For our purposes here, the equation provides qualitative insight into the physical meaning of entropy and qualitative interpretation of the magnitude and sign of entropy changes caused by specific thermodynamic processes. The following example illustrates these insights in a simple case in which only the volume of the system changes in the process.” [[Ref – 2]]
Carnot’s analysis of efficiency for a heat engine operating reversibly showed that in each cycle (q > T) at the high temperature reservoir and (q > T) at the low temperature environment summed to zero:

This result suggests that (q >T) is a state function in a reversible process because the sum of its changes in a cyclic process is zero. Clausius extended this result to show that the quantity ∫ (1/T) dqrev is independent of path in any reversible process and is, therefore, a state function. Clausius then defined the entropy change DS 5 Sf 2 Si of a system in a process starting in state i and ending in state f by the equation (9):
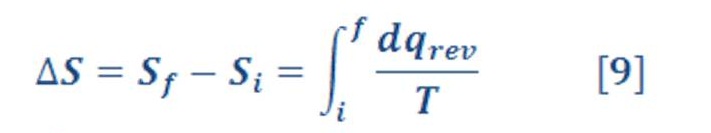
The definition in Equation (9) constitutes Part One of the Second Law in the form directly related to chemistry. Entropy is therefore a state function and has physical dimensions J K-1. We calculate ΔS =Sf – Si for a specific process by :
- identifying its initial and final equilibrium states i and f as points on the equation-of-state surface.
- selecting any convenient reversible path between them along which dqrev and T are known, and
- evaluating this integral along the selected path. It does not matter that the actual process of interest may be irreversible.
Because entropy is a state function, its change depends only on the initial and final states, and not at all on the path. Therefore, we are free to choose any reversible path that connects the initial and final states, purely on grounds of convenience, for calculating ΔS.
Entropy changes that occur in the system and in the surroundings during several types of processes are .
Entropy changes in Reversible Process
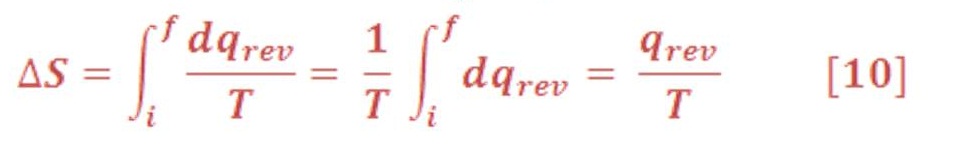
ΔS_sys for Isothermal Processes
If the reversible process selected as the pathway connecting the initial and final states is isothermal, the calculation simplifies immediately. Because T is constant, it comes outside the integral:
1) Compression/Expansion of an Ideal Gas at constant Temperature:
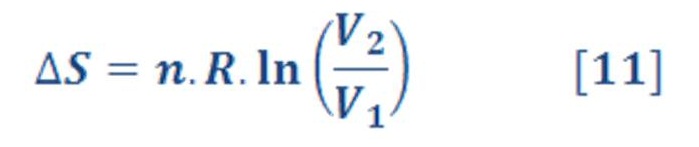
Where “n” is represent the molar mass & “R” is represent the Universal gas constant (R=8.315 KJ/Kmol.K).
2) Phase Transition:
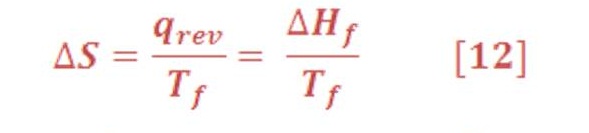
Where symbol “f” refer to the fusion or freeze energy of substances.
The entropy increases when a solid melts or a liquid vaporizes, and it decreases when the phase transition occurs in the opposite direction. Again, Boltzmann’s relation provides the molecular interpretation. When a solid melts or a liquid vaporizes, the number of accessible microstates Ω increases, and thus the entropy increases.
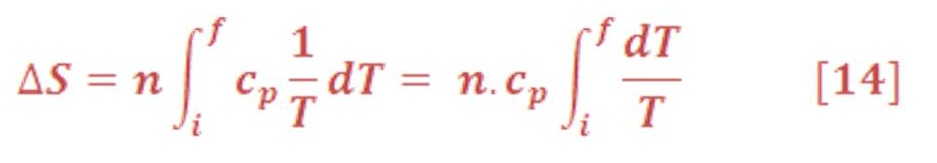
ΔS_sys for Processes with Changing Temperature
If “cv” & “cp” – heat capacity at constant volume & pressure respectively – is independent of T over the temperature range of interest, it can be removed from the integral, giving the result
1) At constant volume:
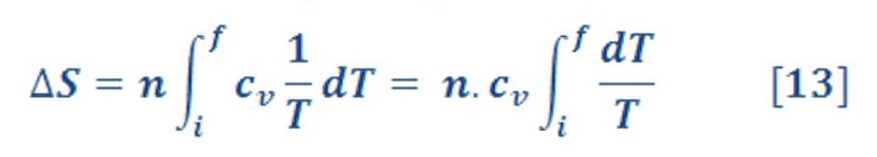
Where “n” is the molar mass of ideal gas.
2) At constant Pressure:
ΔS for Surroundings:
Usually, the surroundings can be treated as a large heat bath that transfers heat to or from the system at the fixed temperature of the bath. In such cases, the heat capacity of the surroundings (heat bath) must be so large that the heat transferred during the process does not change the temperature of the bath. The heat gained by the surroundings during a process is the heat lost from the system. If the process occurs at constant P, then:

If the process occurring in the system is exothermic, the surroundings gain heat and the entropy change of the surroundings is positive. Similarly, an endothermic process in the system is accompanied by a negative entropy change in the surroundings, because the surroundings give up heat during the process to keep the system at the temperature of the heat bath.
If the surroundings lack sufficient heat capacity to maintain constant temperature during the process, then entropy changes for the surroundings must be calculated by the methods demonstrated above for the system, taking explicit account of the temperature change and heat capacity of the surroundings. Examples of both cases are included in the problems at the end of this chapter.
Gibbs Free Energy
Figure (9) provides a criterion for deciding whether a process is spontaneous, reversible, or non-spontaneous.
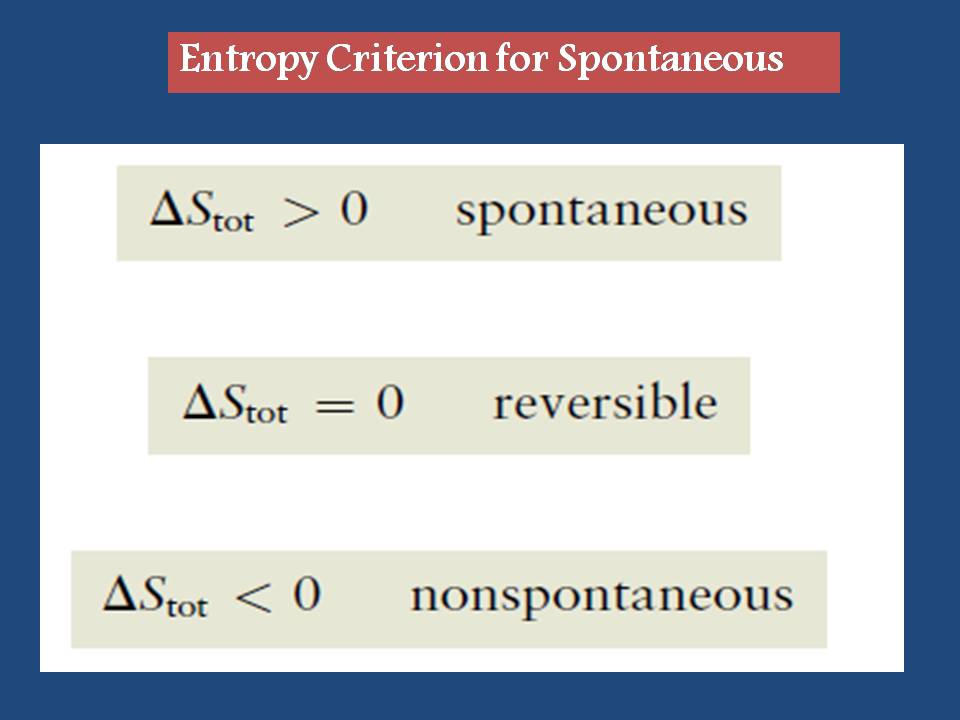
Figure (9) – Entropy Criterion of Spontaneous
Although the algebraic sign of ΔStot is a completely general criterion for determining the spontaneity of a process, it requires calculating the entropy change for the surroundings, as well as for the system. It would be much more convenient to have a state function that predicts the feasibility of a process in the system without explicit calculations for the surroundings.
For processes that occur at constant temperature and pressure, which is the most important set of conditions for chemical applications, such a state function exists. It is called the Gibbs free energy and is denoted by “G”.
The total entropy change for system & surrounding:
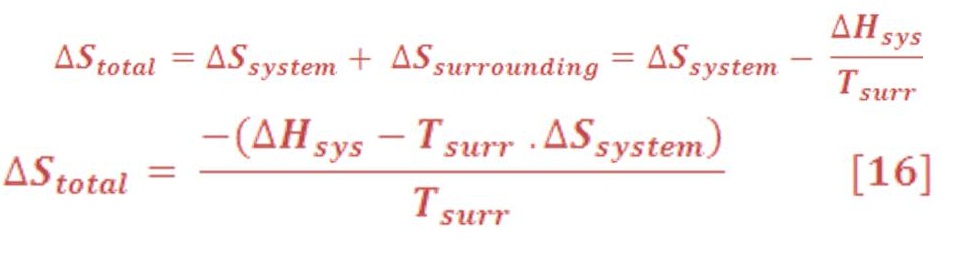
Because the temperature, T, is the same for both the system and the surroundings, we can rewrite this as:

We define the Gibbs free energy “G” as:
therefore, Equation (17) becomes:

Because the absolute temperature T is always positive, ΔStot and ΔGsys must have the opposite sign for processes occurring at constant T and P.
Then, the criterion for deciding whether a process is spontaneous by using Gibbs free energy terminology is shown in figure (10):
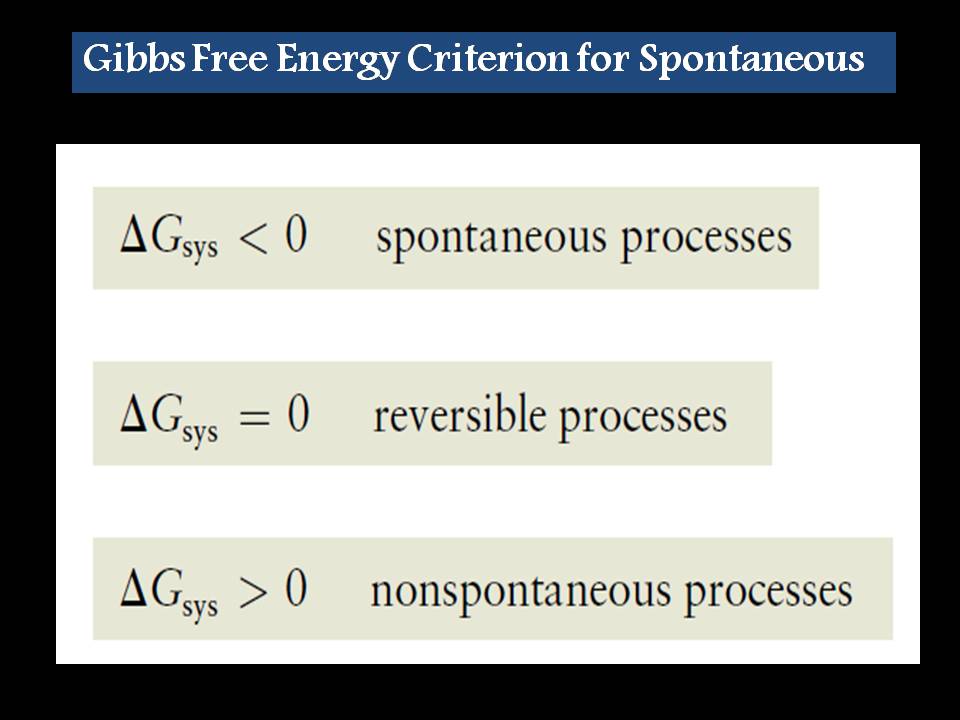
Figure (10) – Gibbs Free Energy Criterion for Spontaneous
for processes conducted at constant temperature and pressure.
Cell Voltage (Electric Potential)
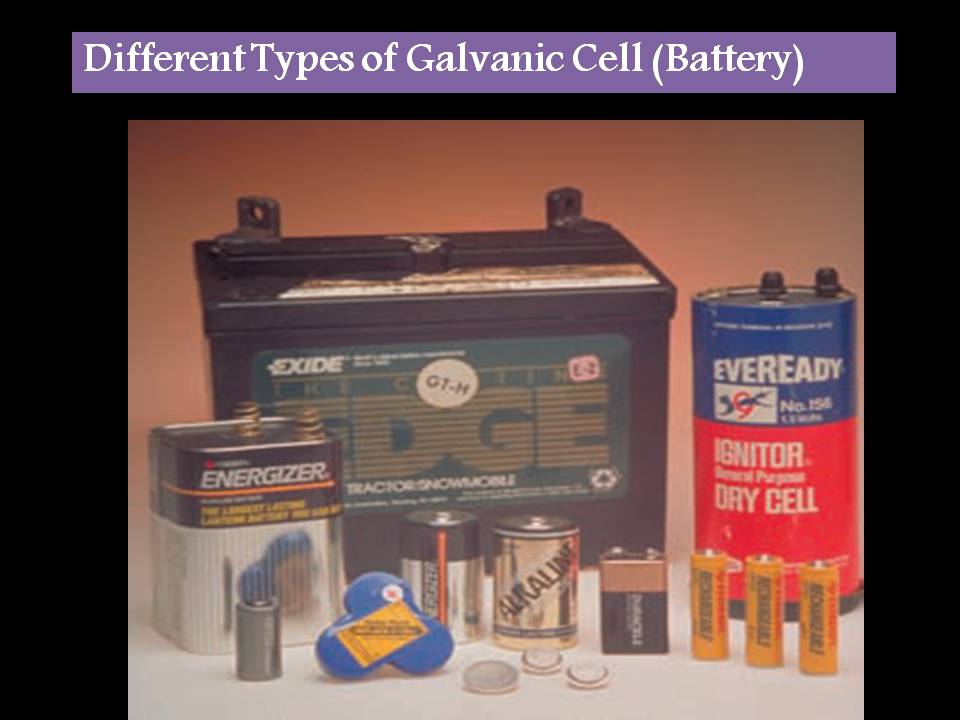
Figure (11) – Galvanic cells “Batteries”
We noticed that all normal batteries which made by alkaline dry cell (galvanic cell) & we used for many applications (i.e. flashlights, portable radios & kids toys), has an electrical potential (voltage) equal to 1.5V. The Lithium-Ion batteries (rechargeable battery) has an voltage of 3.7V. The lead-acid battery (car battery) has voltage of 12V. The electrolytic cell of water is need to standard voltage of 1.299 V for staring chemical separating process.
Now, let us ask our self important question related to the galvanic or electrolytic cell.
How does we know the required or produced voltage (electric potential) for different types of substances ?
What’s the main factors (i.e. pressure) which effect in the cell voltage without considering the reactants & products ?
Is there any relationship between cell voltage (electrical potential ) & Gibbs Free energy ?
Nernst Equation is answering all these question which is formulated as equation (20):
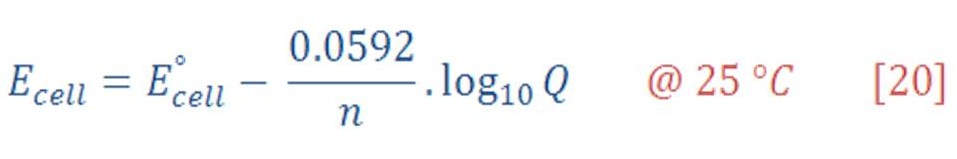
which its most familiar form, with n being the number of moles of electrons transferred in the overall chemical reaction as written. We remind you that these measurements are made under conditions in which no current flows and that n appears only to relate the thermodynamic and electrostatic work to one another. In a galvanic cell made from zinc, aluminum, and their ions, for example.
Nernst equation has been generated from the general equation (21):

Concentrations and pressures are rarely fixed at their standard state values in real world applications. It is therefore necessary to understand how concentration and pressure affect cell potentials by applying the thermodynamic principles presented.
The reaction quotient Q for a general gas-phase reaction is defined as:

According To The Chemical Reaction:

Where
P: the partial pressure of substance
A,B are reactants substances
C,D : Products substances
a,b,c,d: number of moles
But before discuss equation (20) “Nernst Equation”, we must talk about important constant called “Faraday’s Constant”
Faraday’s Constant
Alessandro Volta discovered the galvanic cell in 1800 and constructed a “battery of cells” consisting of a number of platelets of silver and zinc that were separated from one another by porous strips of paper saturated with a salt solution.
This voltaic pile, as it was then known, demonstrated that electricity could be produced by chemical reactions.
By 1807, Sir Humphry Davy had prepared elemental sodium and potassium using a battery to electrolyze their respective hydroxides, demonstrating that electricity could drive chemical reactions.
Michael Faraday was the first to demonstrate quantitative relationships between the amount of charge that flowed and the quantities of materials produced or consumed in electrochemical reactions, from which he asserted the fundamental duality of these processes:
“The electricity which decomposes, and that which is evolved by the decomposition of, a certain quantity of matter, are alike.”
Faraday arranged a series of electrochemical cells through which the same amount of charge was passed and measured the quantities of the materials produced or consumed.
The relationships he discovered are known as Faraday’s laws, which we state as follows:
The mass of a given substance that is produced or consumed in an electrochemical reaction is proportional to the quantity of electric charge passed.
Equivalent masses of different substances are produced or consumed in electrochemical reactions by a given quantity of electric charge passed.
These laws, which summarize the stoichiometry of electrochemical processes, were discovered by Michael Faraday in 1833, more than half a century before the electron was discovered and the nature of electricity was understood on the atomic scale. Faraday also measured, for the first time, the charge to mass ratio of the hydrogen ion, long before its chemical nature had been definitively established, by measuring the amount of charge required to generate 1 g of hydrogen gas. The value he obtained (about 1000 times smaller than e/me) provided a benchmark against which J. J. Thomson would later compare the charge to mass ratio of the electron and conclude that: “The charge on the electron must be very large or the mass of the electron must be very small, compared to the hydrogen ion”.
The charge of one mole of electrons has been given a special name and symbol, the Faraday constant in recognition of the central importance of the mole concept in chemistry.
Now, after understanding Faraday’s constant, let us determine the potential
The change in the Gibbs free energy not only predicts the direction of spontaneous change but is also equal to the reversible work done (other than pressure–volume work) on or by the system at constant temperature and pressure, which we identify as the electrical work welec as follows:

The change in the Gibbs free energy of the system is negative for a galvanic cell, and so the electrical work is done by the system. Energy, in the form of useful electrical work, is extracted from the system and made available to do work on the surroundings. The opposite is true for electrolytic cells. Work is done on the system, increasing its Gibbs free energy, most commonly as an increase in the potential energy of the electrons. The maximum work done on or by electrochemical cells is done when they operate reversibly, because they are working against the maximum possible opposing force at all times, just like for reversible PV work.
Cells operating irreversibly (in other words, with large currents permitted to flow) produce less electrical work than those operating reversibly. The electrical work w_elec is also equal to the product of the charge transferred and the difference in the electrostatic potential energy, which can be calculated as follows:

Where:
n: number of electron moles which has been transferred in chemical equation
F: Faraday’s constant
Ecell : Electrostatic Potential (Volt) /(Joule/C).
For standard state, equation (25) will be:

Cell Potential of Water:
For calculating the reaction quotient for half cell potential, use equation (27) & (28) which they are:
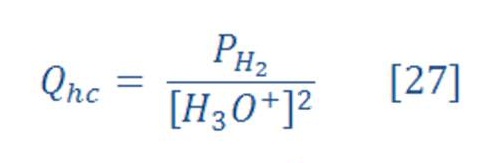
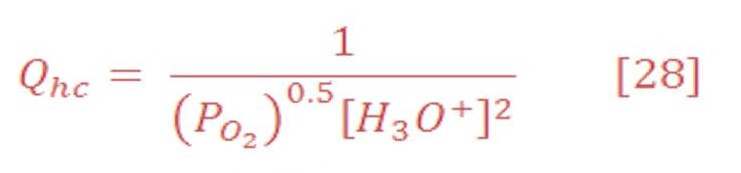
Where :
[H3O+] is the concentration of H3O+ in pure water at 25 ⁰C & its equal to 1X10⁻⁷ (1e-7) M.
Now, the reduction potential of cathode part is given by:

The standard potential of cathode equal to zero, then equation (29) will be:

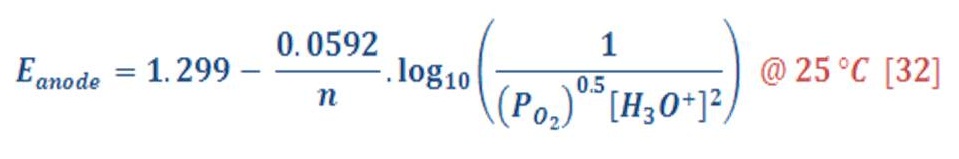
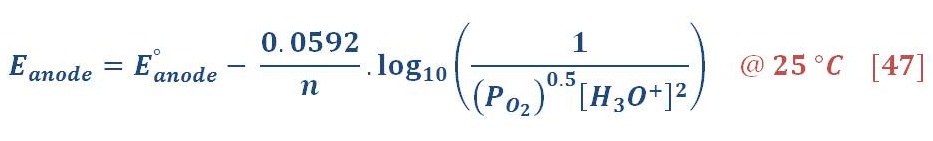
By the same manner, the reduction potential in anode (Oxygen part) will be:
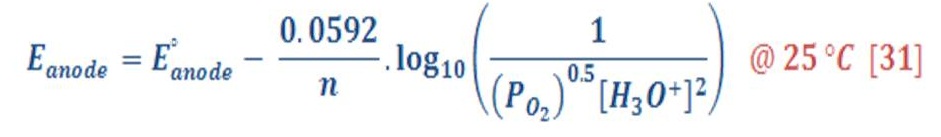
The standard potential of anode equal to 1.299 V, then equation (31) will be:
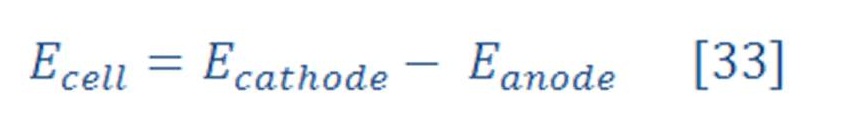
The overall cell potential will be:
In standard Temperature & Pressure (STP) condition (25 ⁰C & 1 atm), potential at cathode part:

The anode part will have reduction potential:
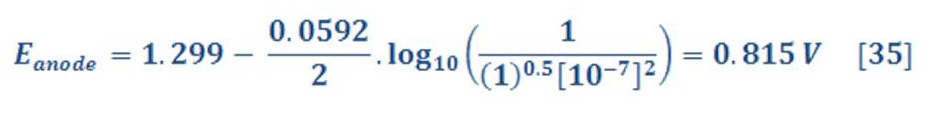
So, the overall cell potential will be:

which means that the decomposition of water to produce hydrogen and oxygen does not occur spontaneously, as we know very well. It can be made to occur by applying a potential that is sufficiently large and positive, called the decomposition potential of water, which is 1.229 V. Electrolysis of water can proceed under these conditions to produce hydrogen, which produces bubbles at the cathode, and oxygen, which produces bubbles at the anode.
The previous overall cell potential is for pure water. Salinity will effect in the value of cell potential as chlorine will arise with hydrogen in cathode part.
Recall the Nernst equation well, because we will use it for improving the electrolysis cell in deep water later.
Fuel Cells
“ Fuel cells convert chemical potential energy into electrical energy using coupled redox reactions, like batteries, but they operate as long as they are being supplied with fuel. Batteries carry all of their “fuel” with them and must be replaced or recharged to continue to provide energy. Fuel cells operate using the same oxidation reactions as combustion but are much more efficient, in principle, because different thermodynamic considerations apply”. [[Ref – 2]]
“Fuels like methane are commonly burned to provide thermal energy at high temperatures for use in heat engines. However, a comparison of the reversible works obtained in the last two examples reveals that the exergy of the reactants (818 MJ/kmol CH4) decreases by 288 MJ/kmol as a result of the irreversible adiabatic combustion process alone. That is, the exergy of the hot combustion gases at the end of the adiabatic combustion process is 818 – 288 = 530 MJ/kmol CH4. In other words, the work potential of the hot combustion gases is about 65 percent of the work potential of the reactants. It seems that when methane is burned, 35 percent of the work potential is lost before we even start using the thermal energy (Fig. 15–35). Thus, the second law of thermodynamics suggests that there should be a better way of converting the chemical energy to work. The better way is, of course, the less irreversible way, the best being the reversible case. In chemical reactions, the irreversibility is due to uncontrolled electron exchange between the reacting components. The electron exchange can be controlled by replacing the combustion chamber by electrolytic cells, like car batteries.
(This is analogous to replacing unrestrained expansion of a gas in mechanical systems by restrained expansion.) In the electrolytic cells, the electrons are exchanged through conductor wires connected to a load, and the chemical energy is directly converted to electric energy. The energy conversion devices that work on this principle are called fuel cells. Fuel cells are not heat engines, and thus their efficiencies are not limited by the Carnot efficiency.
They convert chemical energy to electric energy essentially in an isothermal manner. A fuel cell functions like a battery, except that it produces its own electricity by combining a fuel with oxygen in a cell electrochemically without combustion, and discards the waste heat. A fuel cell consists of two electrodes separated by an electrolyte such as a solid oxide, phosphoric acid, or molten carbonate. The electric power generated by a single fuel cell is usually too small to be of any practical use. Therefore, fuel cells are usually stacked in practical applications. This modularity gives the fuel cells considerable flexibility in applications: The same design can be used to generate a small amount of power for a remote switching station or a large amount of power to supply electricity to an entire town. Therefore, fuel cells are termed the “microchip of the energy industry.” The operation of a hydrogen–oxygen fuel cell is illustrated in Figure (12).
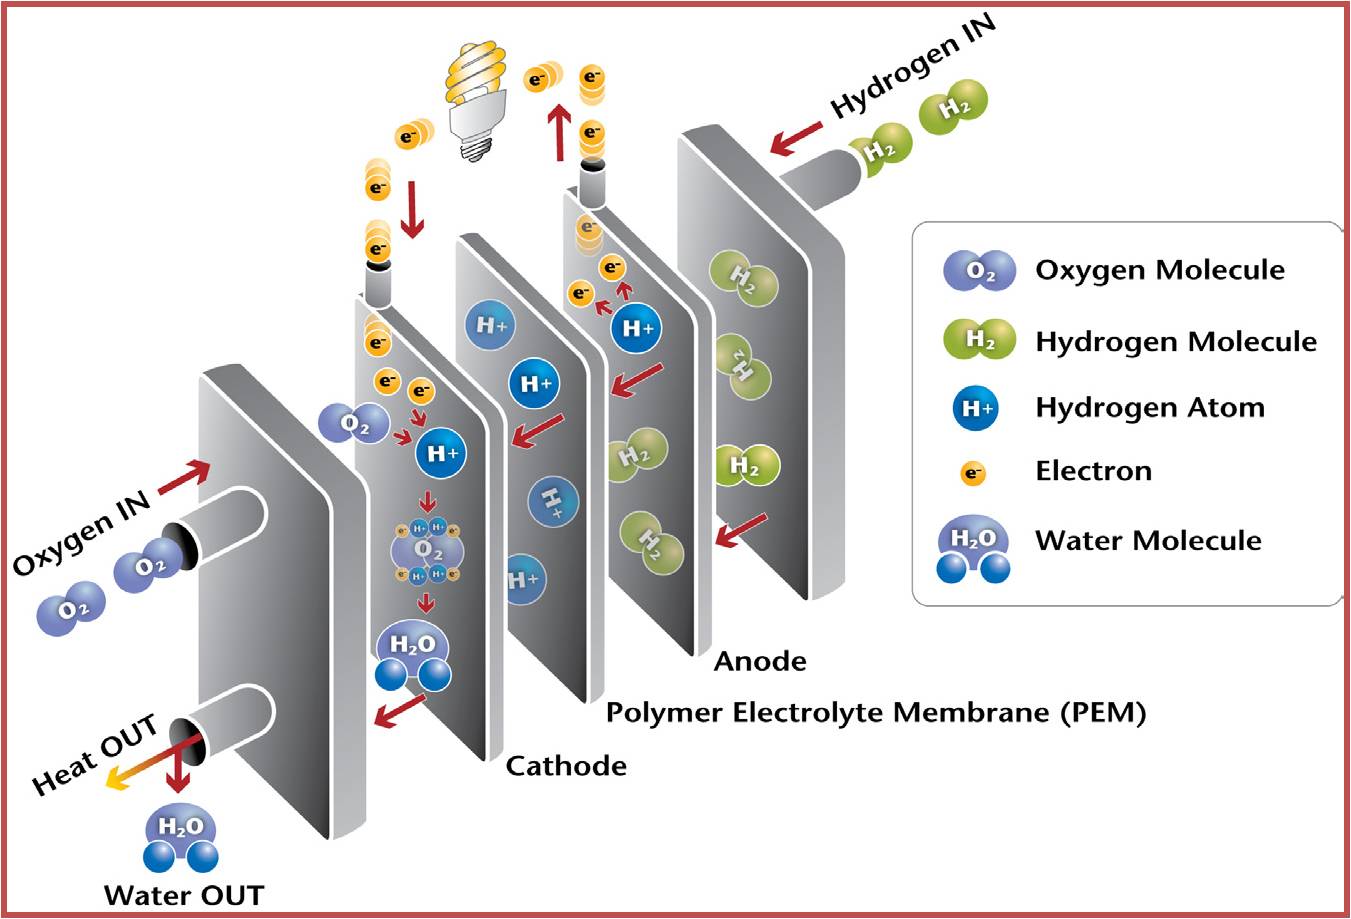
Figure (12) – Principle Working of Fuel Cell
Hydrogen is ionized at the surface of the anode, and hydrogen ions flow through the electrolyte to the cathode. There is a potential difference between the anode and the cathode, and free electrons flow from the anode to the cathode through an external circuit (such as a motor or a generator).
Hydrogen ions combine with oxygen and the free electrons at the surface of the cathode, forming water. Therefore, the fuel cell operates like an electrolysis system working in reverse. In steady operation, hydrogen and oxygen continuously enter the fuel cell as reactants, and water leaves as the product.
Therefore, the exhaust of the fuel cell is drinkable quality water. The fuel cell was invented by William Groves in 1839, but it did not receive serious attention until the 1960s, when they were used to produce electricity and water for the Gemini and Apollo spacecraft during their missions to the moon. Today they are used for the same purpose in the space shuttle missions. Despite the irreversible effects such as internal resistance to electron flow, fuel cells have a great potential for much higher conversion efficiencies. Currently fuel cells are available commercially, but they are competitive only in some niche markets because of their higher cost. Fuel cells produce high-quality electric power efficiently and quietly while generating low emissions using a variety of fuels such as hydrogen, natural gas, propane, and biogas. Recently many fuel cells have been installed to generate electricity. For example, a remote police station in Central Park in Ne York City is powered by a 200-kW phosphoric acid fuel cell that has an efficiency of 40 percent with negligible emissions (it emits 1 ppm NOx and 5 ppm CO).
Hybrid power systems (HPS) that combine high-temperature fuel cells and gas turbines have the potential for very high efficiency in converting natural gas (or even coal) to electricity. Also, some car manufacturers are planning to introduce cars powered by fuel-cell engines, thus more than doubling the efficiency from less than 30 percent for the gasoline engines to up to 60 percent for fuel cells. In 1999, DaimlerChrysler unveiled its hydrogen fuel-cell powered car called NECAR IV that has a refueling range of 280 miles and can carry 4 passengers at 90 mph. Some research programs to develop such hybrid systems with an efficiency of at least 70 percent by 2010 are under way ”. [[Ref – 1]]
There are many types of fuel cell technologies according to the requirements of specific application.
Table (3) show some of them. [[Ref-5]]
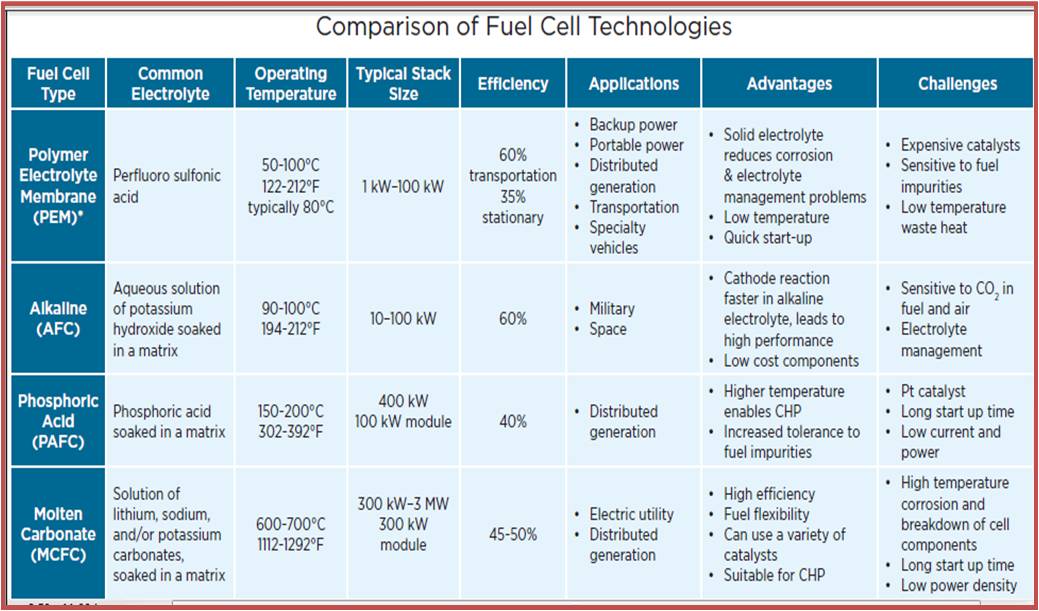

Figure (13) show a graph of the reduction of fuel cell system cost between 2002 & 2010. [[Ref-3]]
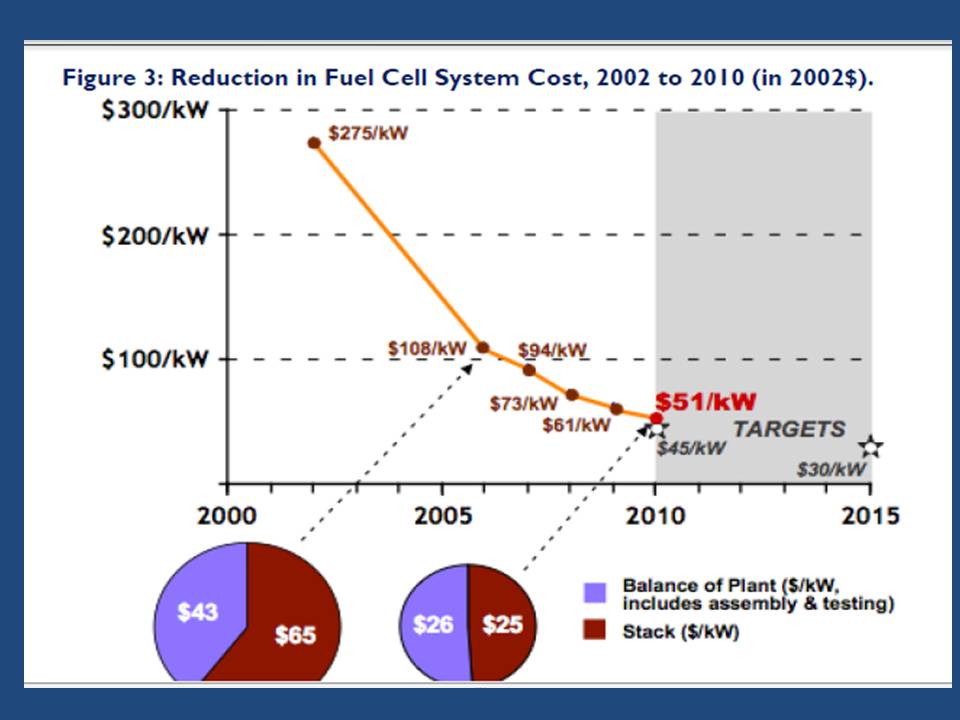
Figure (13) – Cost graph for Fuel Cell System
Deep water Technique (DWT)
Ocean has a unique natural property which can’t be found in the land.
It is the Pressure. Massive pressure has been stored inside the silent ocean.

Figure (14) – Deep Water
One of interesting thing about ocean that, whenever you go deeper , you will notice that pressure surrounding your body will increase gradually. Definitely, there is a limit for human body ( and some sea animals) to sustain high pressure as a result of water depth effect. If it was exceeded the limit, he/she will die. This pressure called hydrostatic pressure. It was called “static” because water is not in motion status (Kinetic energy = Zero).
The unit of pressure is called “Pascal” (Pa). For high pressure they used Kilo-Pascal (KPa) or (Bar).
The average pressure of water (or any fluid) on the bottom of seawater as we see in figure (15-A) is depend on the depth of sea water level according to equation:

If we want to calculate the pressure on the left/right wall of pool or dam, then we must find the integral of pressure-depth curve, then divide it by the total depth ”h” as we see in figure (15-B). It’s given by equation (38):

Then we have:

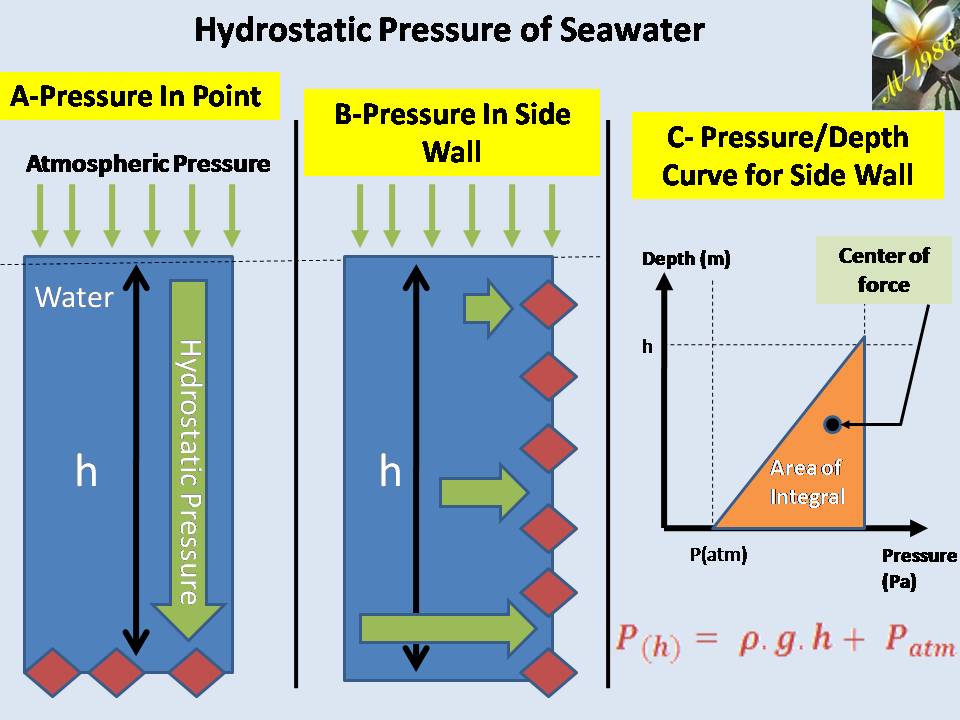
Figure (15) – Pressure varied with depth
And the central location (X) of average pressure (average force) from seawater level is the engineering location of triangle area as we see in figure (15-C) , so:
How we may utilize from the high pressure of deep water in ocean for producing Hydrogen ?
There are two ways to increase the efficiency of electrolysis of water :
- Either by changing the pressure.
- Or by changing the temperature.
Deep water give us a free source of wide range of pressures up to 10,994 m ( 36,070ft) as known recently in Marianas Trench which is the deepest part of the world’s ocean & it’s located in the western Pacific Ocean. [[Web-8]]
That depth of 11 Km is equal approximately to 1080 Bar (108 MPa) & definitely it’s a massive & horrible free force in the ocean.
How pressure can change the efficiency of electrolysis process of water ?
Firstly, as we know & remember that Nernst equation for determining the cell potential is contained a pressure as variable parameter, & we see in equation (41) & (42) the half-cell potential for both cathode & anode part.

Decreasing the pressure of hydrogen gas & oxygen will consequently lead to reduce the cell potential (voltage) compared to the same temperature in pressure of 1 atm.
Secondly, if you remember, the energy law for electrolysis cell was :
Gibbs free energy has a relation with the required electrical energy to separate the water into hydrogen & oxygen, thus it doesn’t have a direct relationship with pressure variation. Gibbs free energy is represent the power which we (surrounding) give it to the system.
The enthalpy of formation will not change too much by the variation of pressure because the chemical bonds of water is very strong.
Water in liquid status has two types of chemical bonds which are covalent & hydrogen bond as we see in figure (16). The covalent bond is acted between atoms & the hydrogen bond is acted between molecules & the last one is responsible to be prevent water from evaporate into sky.
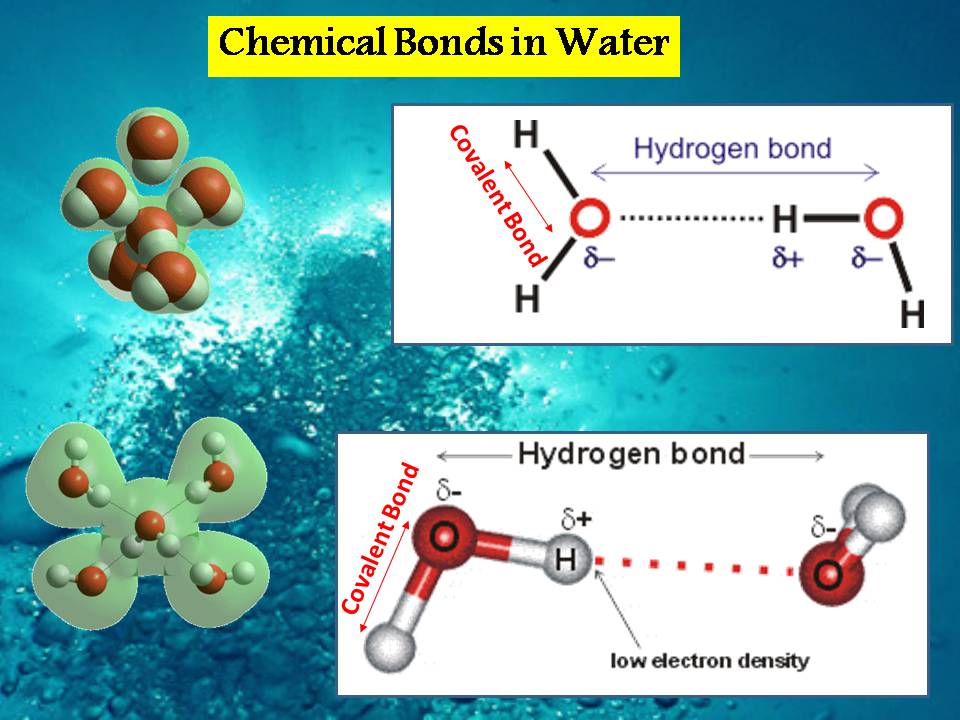
Figure (16) – Hydrogen & Covalent Bond in Water
“The water hydrogen bond is a weak bond, never stronger than about a twentieth of the strength of the O-H covalent bond”. [[Web-5]]
That’s the reason of why the reduction of the pressure for liquid water, will lead to decrease the boiling point of water, as the hydrogen bond (molecules bonding) has a direct relationship with surrounding pressure.
“As water is boiled, kinetic energy causes the hydrogen bonds to break completely and allows water molecules to escape into the air as gas (steam or water vapor’). [[Web-6]]
increasing the atomic fluctuation inside atomic bonds is by increasing the temperature & it will cause a break of covalent bonds between atoms.
The equation which governed the change of enthalpy of formation is :
So, variation of pressure has not any significant effect towards the enthalpy of formation.
Now let us examine the effect of entropy change with pressure variation.
Equation (43) may be written in another way:
Entropy change for gas status has an inverse proportional relationship with pressure variation. So, decreasing the pressure will lead to increase the entropy change of hydrogen, oxygen & vapor.
For the liquid status of water, entropy will not change too much & we may assume it’s constant for simplicity. Next, section which is about engineering analysis we will give an example to show how decreasing the pressure will increase the entropy change of system for temperature of 25 ⁰C.
Components of Deep Water Technique (DWT):
The DWT is comprised two kind of components which they are:
Main components :
It’s contained the basic systems/technologies/tools to operate the DWT effectively for producing hydrogen. Those technologies/tools are:
1) Electrolysis System:
2) Variable Box : Will be explained the function & working principle later
3) Pressurized pipes: There are 3 pipe.
4) Oceanic platform/ship: To supply water into the variable box & collect the hydrogen & oxygen gases which is generated by electrolysis system.
Figure (17) shows the main components construction.
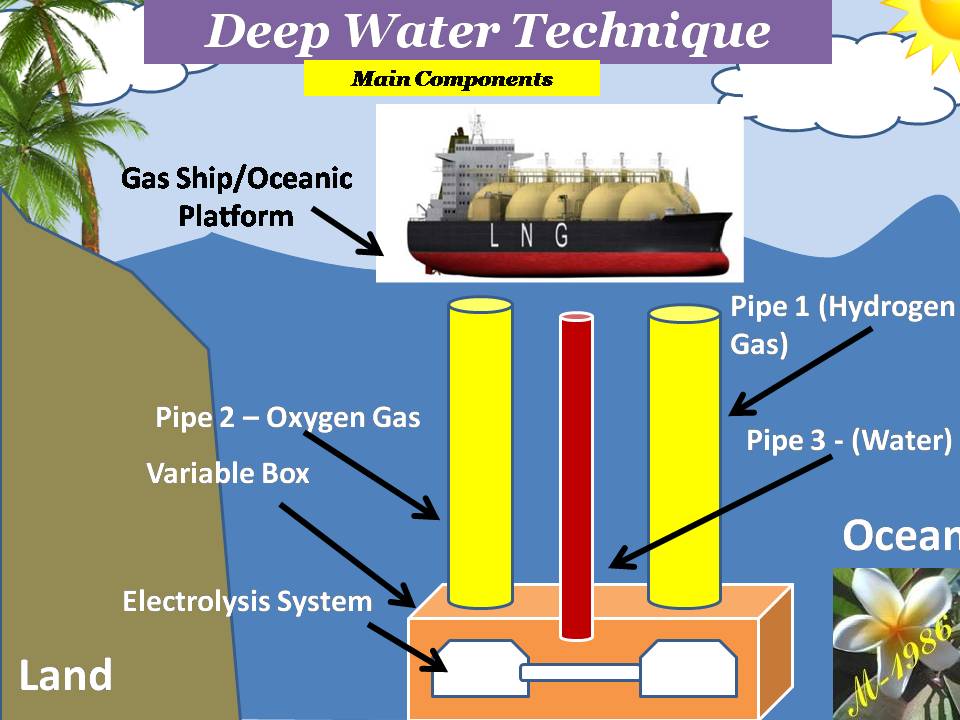
Figure (17) – The Main Components of DWT
All systems, technologies & tools is clear to understand except the variable box.
The purpose of variable box is to create the pressure variation (increase or decrease) in the deep water by utilizing from the high pressure of deep water.
We will not explain how increasing the pressure of water inside box, because it’s very obvious for anybody who love diving into deep water.
The working principle of variable box for decreasing the pressure is depend on convert the high pressure zone outside the system into low pressure zone by using moving & fixed pistons as we see in figure (17). System may be divided into several chambers. In our recent study, we will assume that we have 2 chambers.
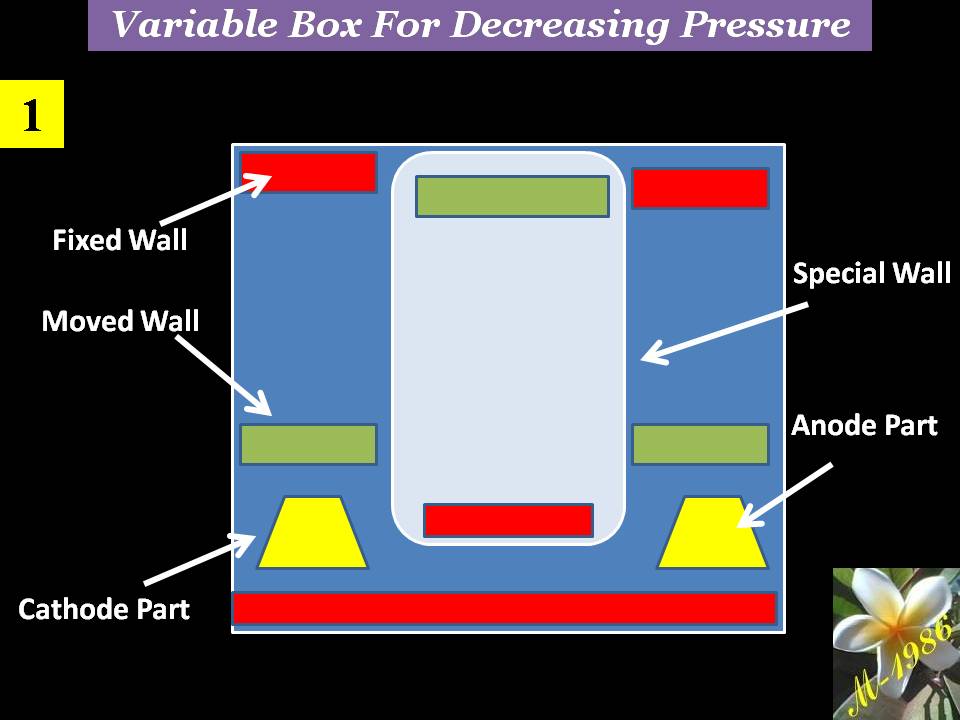
Figure (18) – Variation Box in Deep Water 1
The special wall has a mechanism similar to the pulleys/gear & belt/chain system. Figure (19) shows how the middle moving piston will act by hydrostatic pressure of deep water & how it effects on the motion of side pistons which is located within the electrolysis system.
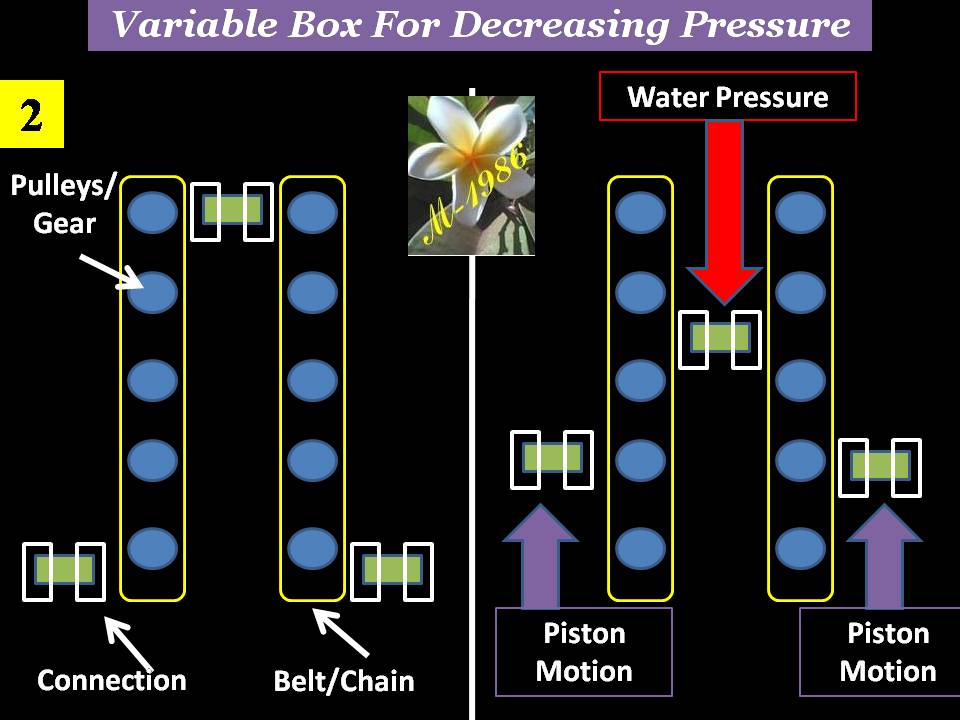
Figure (19) – Variation Box in Deep Water 2
All pistons will move until reach the equilibrium status of forces. Figure (20) shows the final result of deep water effect on the variable box. There will be created a high & low pressure zones inside the chamber of electrolysis system.
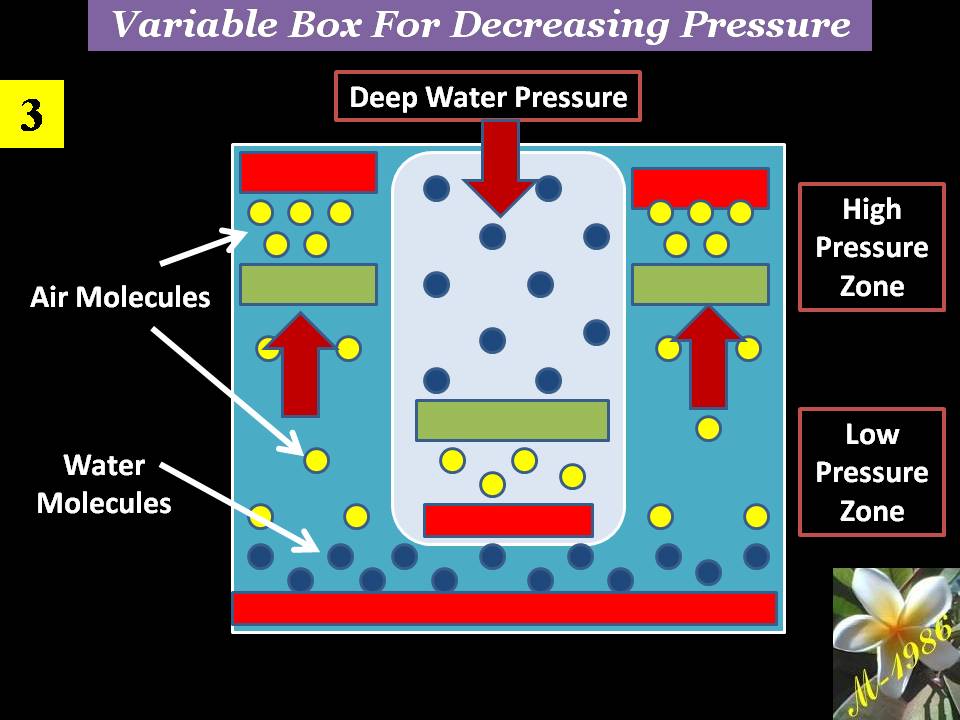
Figure (20) – Variation Box in Deep Water 3
Secondary components:
It’s contained an auxiliary systems/technologies/tools to operate the DWT for another purposes such as producing purified water & electricity. Those technologies/tools are:
1) Fuel Cell System:
Fuel cell has been used if we want to produce electricity in the oceanic platform/gas ship to operate the facility. Also, it can be used for producing purified water. Its good option for countries which has suffering from lack of healthy water especially near the coastal areas as the sea water have high salinity & the operation cost of purification/distillation is very expensive by using traditional methods such as boiling the water by using fossil fuel, Reverse osmosis (RO) technology & Multi Stage Distillation (MSF)technology.
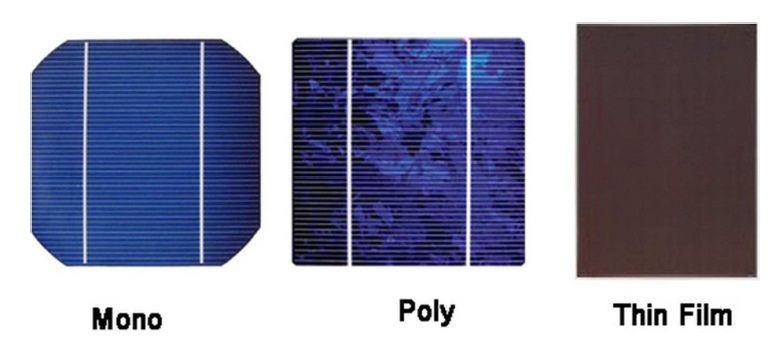
2) Photo-voltaic Cells Systems:
PV cells will not be used unless we are very far from the country (middle of ocean) & definitely if the oceanic platform/gas ship is located in the equator zone, PV cell will receive very high solar intensity (more than 1000 W) as the intensity of solar radiation has a direct relationship with the temperature of sun which is reached into the surface of earth. Although it’s not necessary if we will use the Aero-Oceanic Power (AOP) Technology.
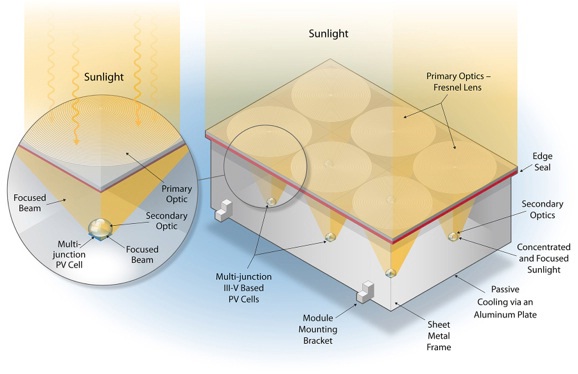
3) Concentrated Solar Mirror system:
This system will help us to increase the efficiency of electrolysis process of water in the deep water by collecting the solar rays in the focus of hyperbola mirror & then transferred it into the deep water by using internal mirror pipe.
4) Internal Mirror Pipe:
It must have low thermal conductivity & withstand high pressure in deep water.
4) Aero-Ocean Power (Proposed Technology):
Its promising technology which will be filled with many surprises. We will talk about it extensively later in private section.
Figure (21) shows the secondary components construction.
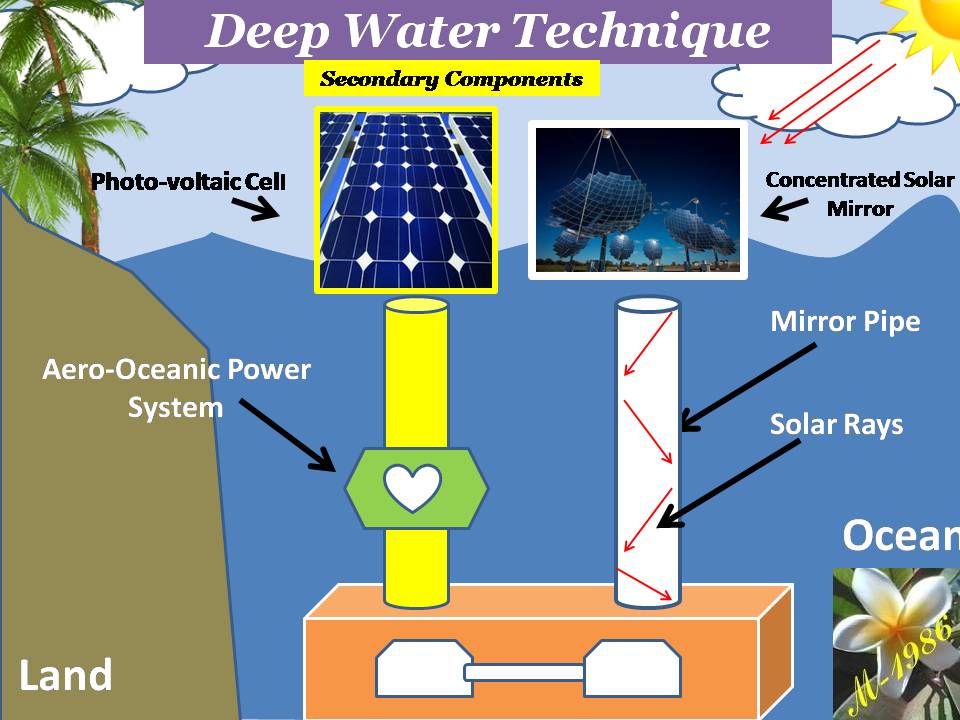
Figure (21) – The secondary components of DWT
Now let us examine theoretically the positive effect of deep water technique (DWT) for electrolysis process of water.
Engineering Analysis of electrolysis process in Deep water
Firstly, we will discuss the effect of pressure variation in the cell potential by using the Nernst equation & then we will talk about entropy change with pressure.
Cell Potential:
Remember that Nernst equation for cathode & anode part for water is :

And the overall cell potential is given by :

Now assume that we have increase the pressure from 1 bar to 10 bar at temperature of 25 ⁰C, then we will find:
Cathode Part Potential;

Then, The anode part will have reduction potential:
So, the overall cell potential will be:

It seem that increasing the pressure will lead to increase of cell potential by 0.044 V in respect to the pressure of 1 bar (1,229 V).
Now let us reverse the process & see how the reduction of the pressure make a difference to electrolysis process.
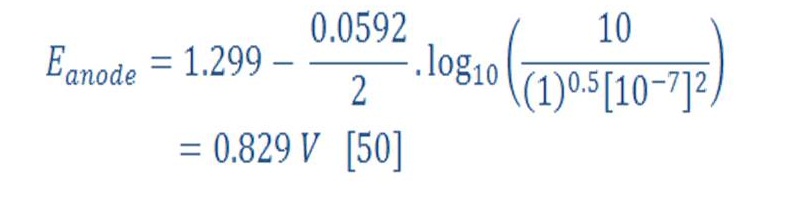
Assume that we decrease the pressure to 0.1 bar, then we will find:
Cathode Part Potential;

Then, The anode part will have reduction potential:
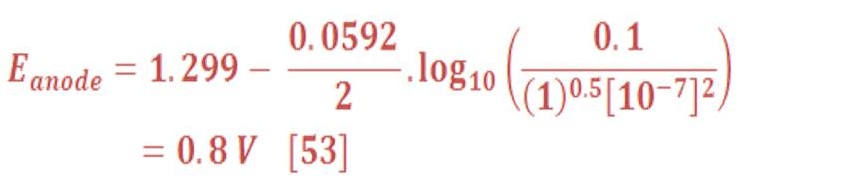
So, the overall cell potential will be:

Amazing, decreasing the pressure will lead to decrease of cell potential by 0.044 V in respect to the pressure of 1 bar (1,229 V).
Table (3) shows different range of lower pressure inside the electrolysis system.
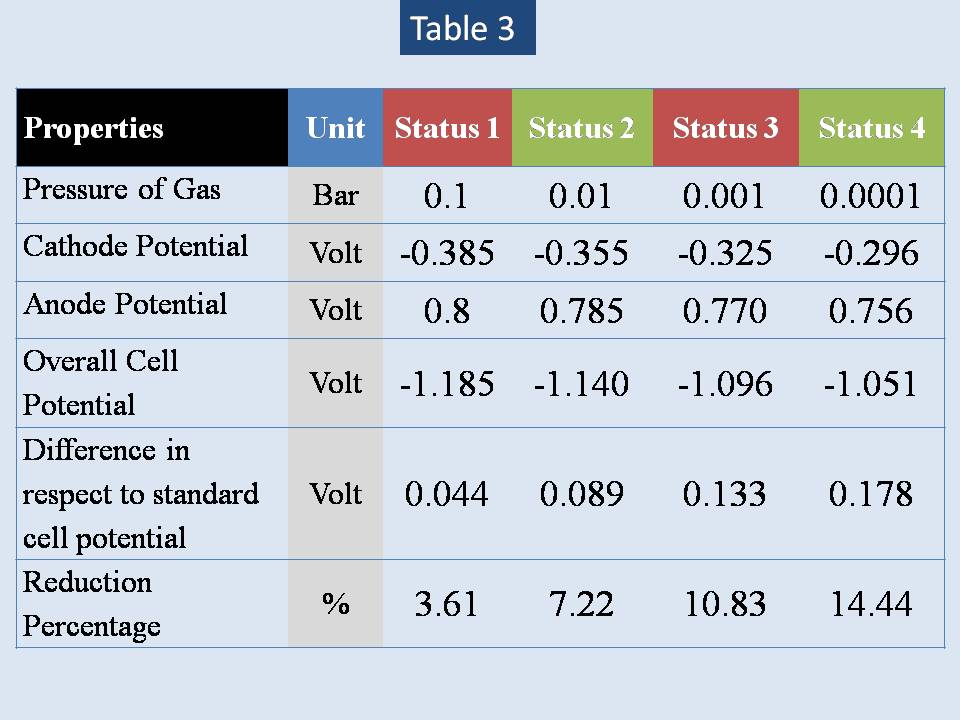
The maximum pressure which is located at Marina Trench may reach more than 1080 bar, because we don’t consider the salinity of water in that zones. Pressure has been calculated by assuming that water is pure (ρ = 1000 Kg/m3). If the salinity is 3500 ppm, so the density of water will be 1035 Kg/m3 & the maximum pressure will be 1118 Bar.
It seem that we can only reach theoretically to status 3 result.
Now let us play with entropy change game with talent player named “Pressure’
Entropy Change (S):
We must mention that all gases (oxygen, hydrogen & vapor) will be considered as ideal gas & it will governed by equation (55):

Where:
P: Pressure (KPa)
V: volume (m3)
n: number of moles (Kmol)
Ru: Universal Gas constant – 8.315 KJ/Kmol
T: Absolute Temperature (Kelvin, K)
Equation (56) is represented the energy law for electrolysis process:
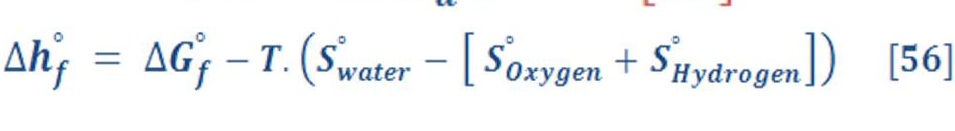
The standard entropy change at STP for those substances is given by [[Ref-1]]:
Standard Entropy of Oxygen = 205 J/mol.K
Standard Entropy of Hydrogen = 131 J/mol.K
Standard Entropy of Water Vapor = 189 J/mol.K
Standard Entropy of Water (Liquid) = 69.9 J/mol.K
All these ia tabulated in thermodynamics & chemistry references.
The entropy of liquid (therefore solids) will not change with pressure variation if it has been assumed as incompressible. The equation is determine the value of entropy change [[Ref-1]]:
Average heat capacity is depend on the temperature. For short range of temperature , it may assume it as constant with small error in calculation.
Review equation (58) which describe how average heat capacity is obtained for accuracy.

a,b,c,d are constant & may be found in thermodynamics tables for common gases [[Ref-1]]
So, entropy change of water (liquid) will be constant in any value of pressures in the deep water.
Now, we will give a short description of how to determine any entropy change at any value of pressure for ideal gas.
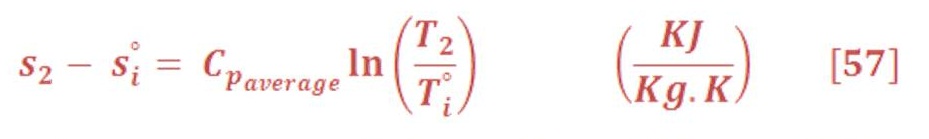
For isothermal process (Constant Temperature) as we see in figure (22) which represent the T-S curve for ideal gas, entropy may be evaluated by using equation (59):
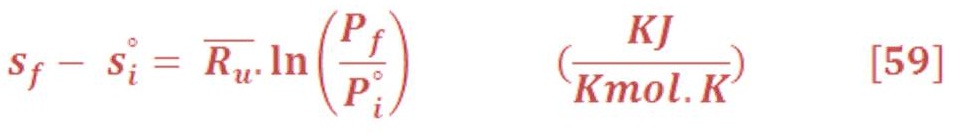
Figure (22) – Isothermal Process in T-S Graph
Suppose that we want to calculate the entropy change for previous substances at pressure of 0.5 Bar & 25 ⁰C. The result was:
New Entropy of Oxygen = 211.1 J/mol.K (Difference = +5.7)
New Entropy of Hydrogen = 136.3 J/mol.K
New Entropy of Water Vapor = 194.5 J/mol.K
All gases has been increased by 5.7 (J/mol.k) in respect to the standard value of entropy change.
What’s the positive effect which may be made in energy law of electrolysis process of water ?
Before that we mention something very important related to calculate the total entropy change.
As we know that the chemical reaction of producing water is :
That means, it required 1 mole of Hydrogen to react with 0,5 mole of Oxygen to produce 1 mol of water.
In the equation of total entropy reaction, it calculated as we see in equation (61):
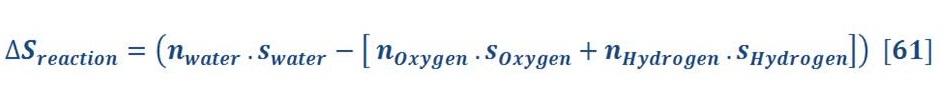
As “n” is represent the number of moles in previous chemical equation. So, the equation (61) will be:

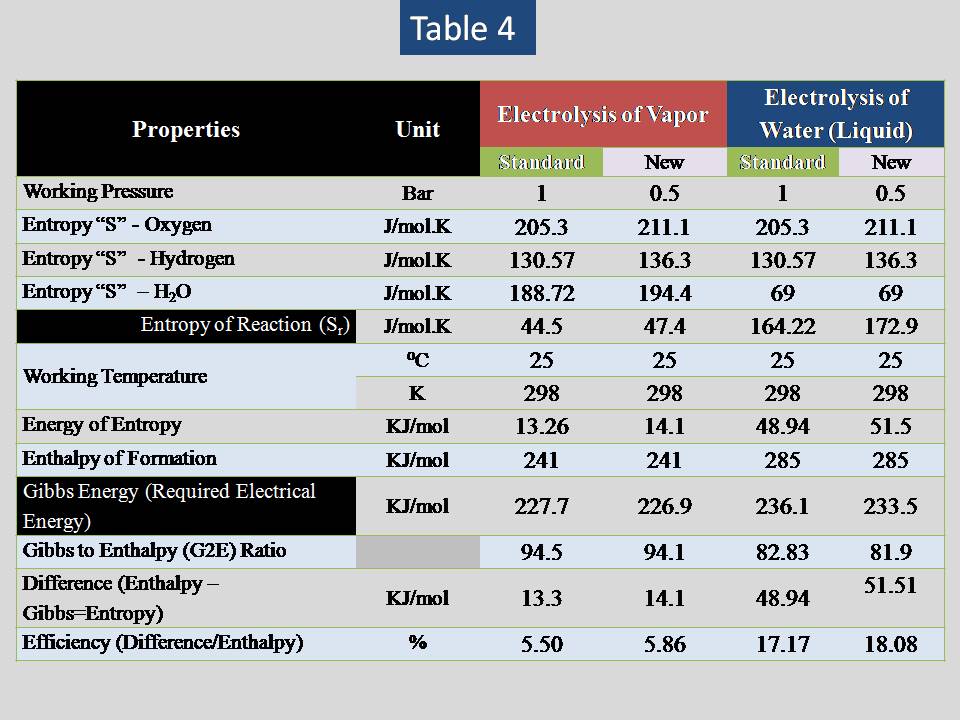
Table (4) show s the result of increasing the entropy change for both vapor & water (liquid)
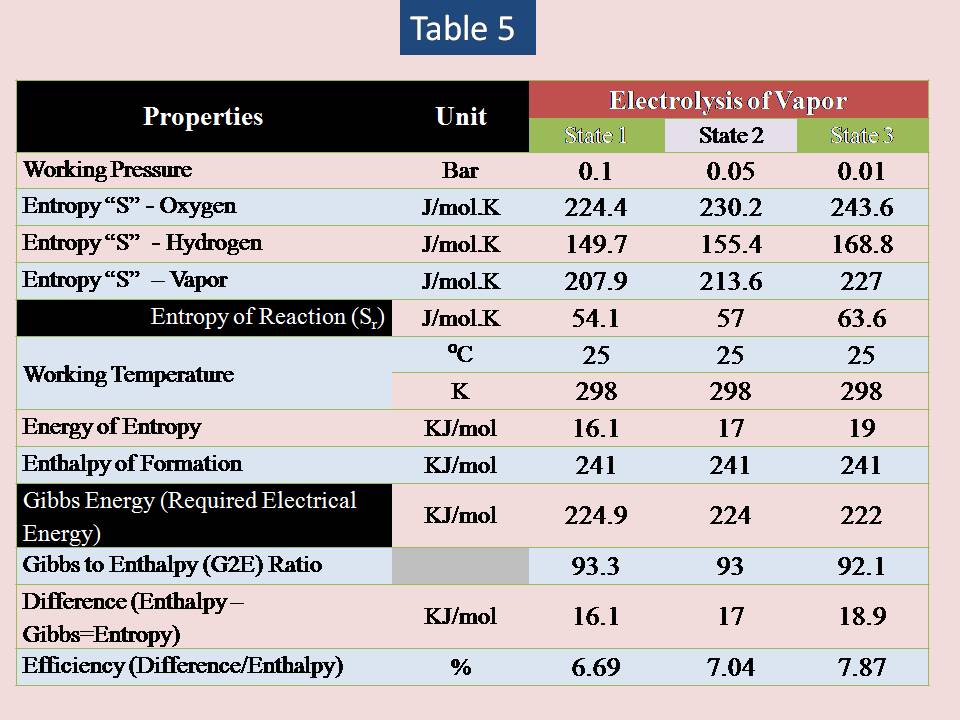
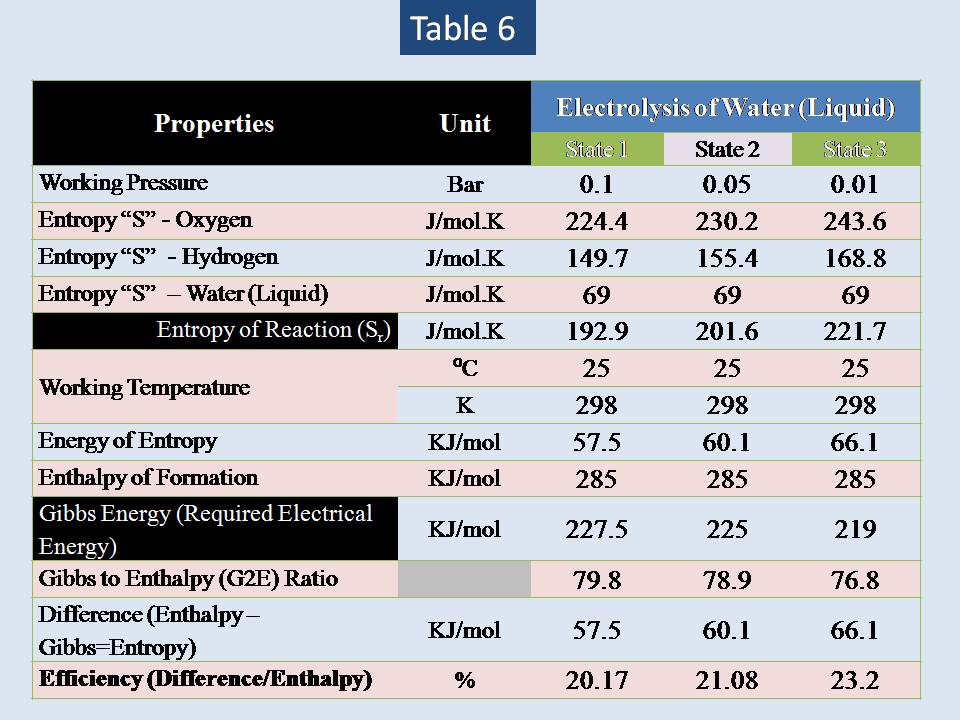
Now let us to analysis different values of pressure for vapor & water (liquid) . The result is shown in table (5) & (6).
The summary:
The results shows that there are small influence of lowering pressure to increase the efficiency of electrolysis of water.
Increasing the pressure will lead to decrease the entropy change of any gas but not liquid substances. So, our study will focus on electrolysis of liquid water only (vapor is excluded).
Maybe someone think that, there is another way to increase the efficiency of electrolysis by increasing the pressure up to hundreds of Bar (the water will boil in365 ⁰C @ P=200 Bar) & then we will utilize from concentrated solar energy to raise up the water in the bottom of ocean.
We must mention firstly, that to find entropy at different temperature for isobaric process (constant pressure), we will use equation (63):
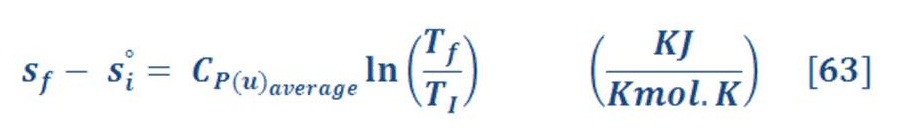
Cp-u is the heat capacity per mol (not Kilogram).
I have calculated this type & I don’t found too much increasing in efficiency, because increasing temperature & pressure will lead to increase the entropy change of oxygen & hydrogen (vapor not included as the water in high pressure is still in liquid status). So, you may neglect this smart passing idea.
Aero-Oceanic Power (AOP)- Proposed Technology
Preface:
Maybe one day you have notice either in your fish pool or river, that bubbles has arisen from bottom to upper surface.

Figure (23) – bubbles in Ocean
Did you ask yourself why this natural phenomenon is happen ?
The answer was given by Archimedes, the genius scientist of dark eras.
He stated that “ The magnitude of the buoyant force on an object always equals the weight of the fluid displaced by the object”.
This statement is known as Archimedes’s principle.

Figure (24) – Physicist Archimedes
In mathematical words, the principle is given by equation (64):

Where:
g: the gravity acceleration.
ρ _ flui: The density of fluid (such as water = 1000 Kg./m3)
ρ _ object: The density of object which is float on the surface of fluid.
V_disp: The volume of fluid which is displaced by object.
Try to immerse beach ball on a small water pool & you will feeling how much upward force is reacted against you for a short distance.
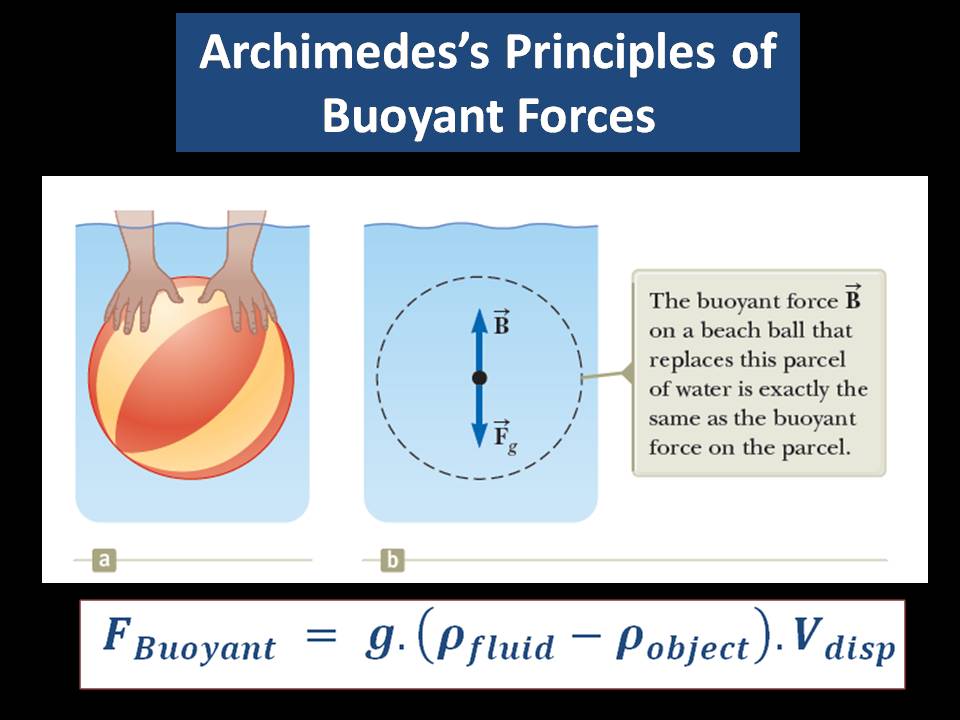
Figure (25) – Beach ball in water pool
Basics Concepts:
What’s the relationship between buoyant bodies & generating electricity in ocean ?
If we have a beach ball which have radius of 0.1m, so the volume of ball is 4.1e-3 & assume the density of ball is 2 Kg/m3 (air + cover material of ball).
Now if we immersed all beach ball in the water pool, how much buoyant force will be exerted ?

Now, if the water pool have an oceanic wheel/turbine of radius 0.4m as we see in figure (26).
Definitely, when the ball hit the bucket, oceanic wheel will not rotate 360 degree, so we can assume it will rotate 15 degree with fixed force.
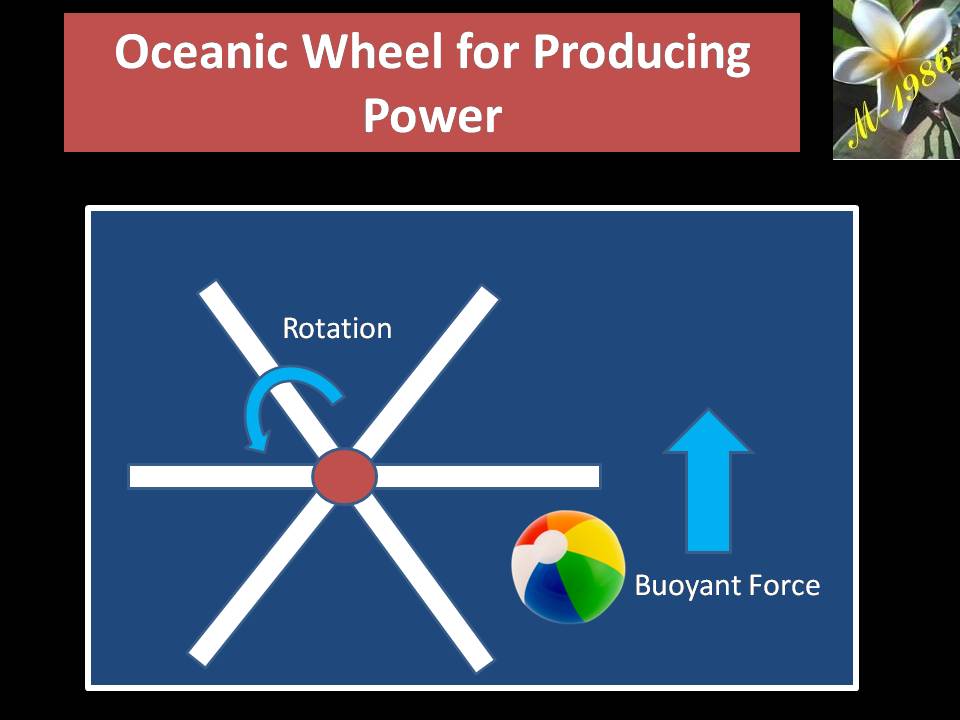
Figure (26) – Oceanic Wheel & Beach Ball
Remember that, changing the angle will lead to change the effected force on the bucket as the buoyant force is always an upward force.
Then, the torque of oceanic wheel is:

Assume, that rotation of wheel is 2 r.p.m (it can be calculated by measuring the friction force of buckets & we will discuss it later in detail).
The power of oceanic wheel :

As “N” is speed of wheel (r.p.m – Revolution per minute)
If we have 1000 oceanic wheel for this simple system, then we may produce 1500 Watt for 24 hours.
Principle of Aero-Oceanic Power (AOP)
The principle of aero-oceanic power is very similar to previous example of beach ball. The difference that we will substitute the ball by the bubbles of Hydrogen & Oxygen gas which is produced by electrolysis by deep water technique as we see in figure (27).
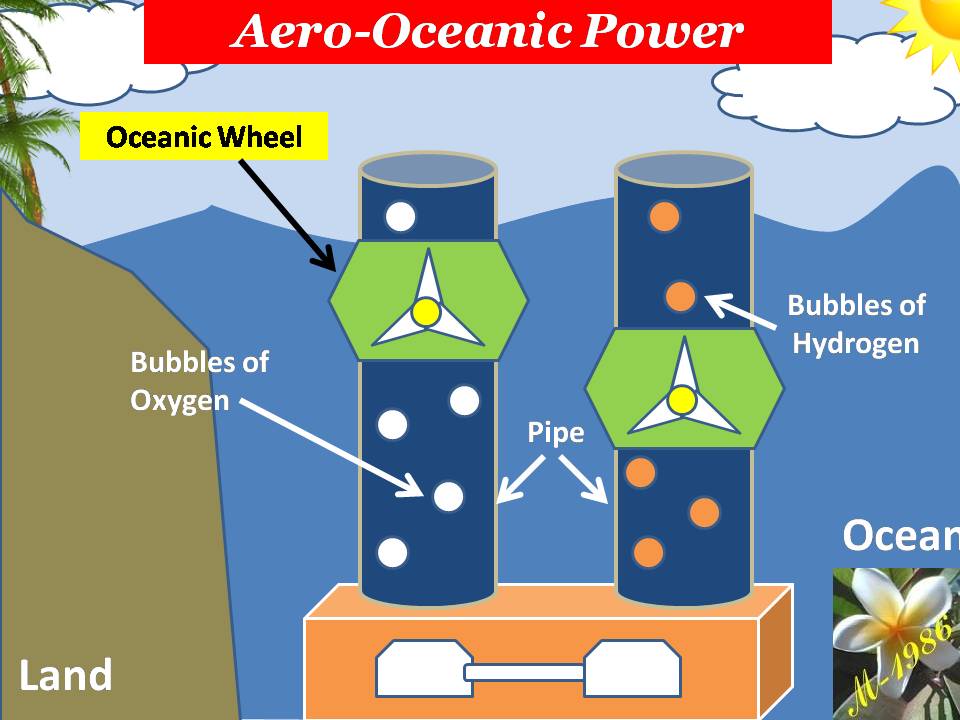
Figure (27) – Aero-Oceanic Power (AOP) Technology
What we did actually, is changing the surrounding fluid around the turbine of Dam which is called “Hydro Power”. Figure (28) shows how it works for both hydro & aero-oceanic power.
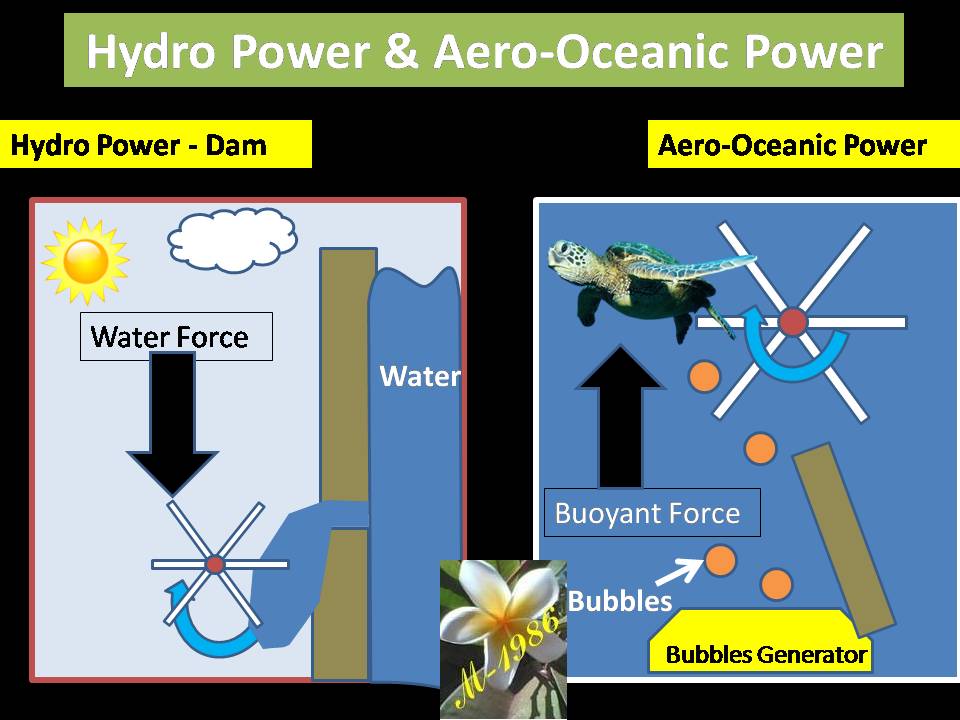
Figure (28) – Hydro Power & AOP Technology
There are different models of AOP technology according to the economical potential of investors. But the important thing is the thermodynamics properties of gas motion in the deep water.
As we know oxygen & hydrogen are an ideal gas, so the density (specific volume) has a direct relationship with temperature & pressure as we see in equation (68):

So, what’s the scientific problem with variation of density ?
If you recall, the buoyant force is depend on the density difference of fluid (water) & object (gas), so we must formulated new equation which consider the variation of pressure with the depth of water.

Initially, we will start to discuss the condition of gas motion in deep water & then talking about types of oceanic wheel & how they may produce electricity.
1) Gas Motion Conditions in Deep Water:
To simplify the study we will give some assumptions which must be considered:
- No fluctuation & rotational motion with gas bubbles.
- Bubbles can’t be dissolved in the water for any condition (solubility).
- No fluid vibrating (oscillating) associated while bubbles motions.
- Ignoring Laplace pressure of bubbles.
- The geometry of bubbles is sphere.
- The friction due to the pipe surfaces is negligible.
- The viscosity force has been neglected .
- The change of bubble pressure will change consequently with the depth.
- The only force which acting on the bubbles is drag force.
- The flow of bubbles is considered laminar (although it’s true as the velocity is relatively small)
Let us start now our interesting mission.
The ideal gas law is :

By substituting equation (70) in equation (69), we will obtain:

We will assume that we want a volume for mole of gas, This may be found by:
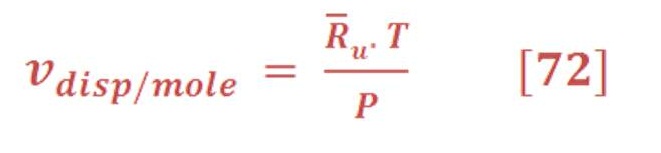
\So, the buoyant force per mole of gas will be:

R_u is the universe gas constant which is equal to 8.315 KJ/Kmol.K.
The drag force is obtained by equation (74):

Where:
Cd : The coefficient of drag (dimensionless). It depends on the geometry of object (gas shape) & Reynolds number.
A_bubble : Cross sectional area of bubble (m2).
C: the speed of object relative to the fluid (m/s).
The cross sectional area of sphere is given by:

Definitely, the radius “r” will be change according to the volume of sphere. As we know the volume per mole of sphere is :
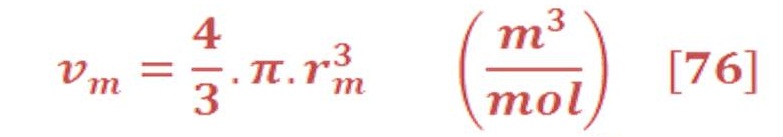
By substituted the value of “r” of equation (76) in equation (75), we will have:

By substituting equation (77) in equation (74) we will have:
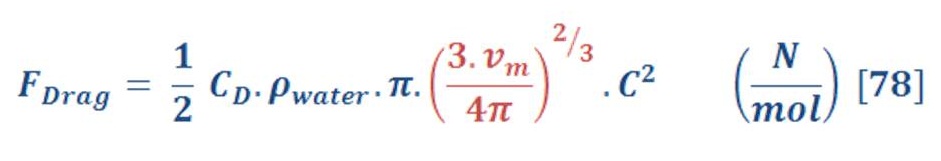
Put the ideal gas law in equation (78) instead of molar volume we obtain:
The last equation is represented the drag force equation as a function of ideal gas law in deep water.
There are two condition for solving both equation (buoyant &drag force)
1) Isothermal Process (constant Temperature)
2) Adiabatic Process (Isolated Thermally).
Pressure & molar volume can’t be constant at all. So, there is no isobaric process (constant pressure) or constant volume.
The real nature of gas motion will lay between isothermal & adiabatic process. We will explain both process to find the average force & the average velocity of gas bubbles in the next section.
Models of Aero-Oceanic Power in Deep Water:
In the traditional hydro turbine field, there are two types for generating rotational motion :
- Impulse Turbine
- Reaction Turbine
Figure (29) shows this types with main differences.
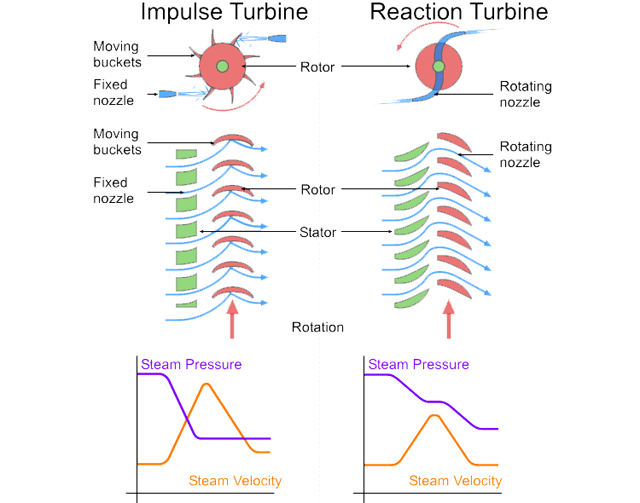
Figure (29) – Impulse & Reaction Turbine
In Aero-Oceanic Power (AOP) we will construct something very similar to impulse & reaction turbine but inside the ocean.
The models of AOP systems are:
- Single –Impulse Oceanic Turbine (SIOT)
- Multi-Impulse Oceanic Turbine (MIOT)
- Single –Reaction Oceanic Turbine (SROT)
- Multi-Reaction Oceanic Turbine (MROT)
The single models is used for short depth & multi used for long depth. Definitely the assets cost of multi turbines will be higher than single turbine. Also the average force of multi is too higher than single turbines, which means more power (watts) by apply multi turbines (we will explain why in the next section).
As I said previously, select the appropriate models is depend on the assets cost. In addition, the location of project (depth of seawater) & other environmental factors.
Next section will discuss the engineering analysis of Aero-oceanic Power (AOP) and see how much energy may be produced per mole of oxygen or hydrogen.
Engineering Analysis of Aero-Oceanic Power.
As we mentioned in last section, it will deal to analysis two conditions of gas motion in the deep water which they are:
Isothermal Process & Adiabatic Process
Isothermal Process & AOP
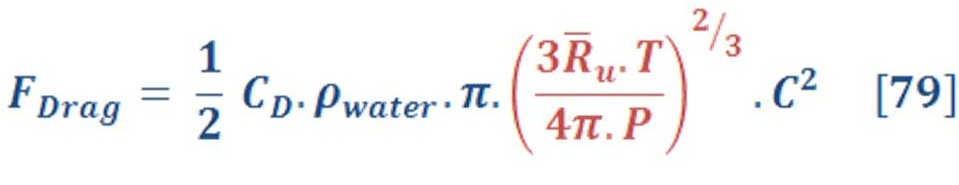
Equation (80) is concerned with buoyant force in specific pressure (also depth of water):

Isothermal process mean that temperature is constant, so equation (80) will convert to:

Where “M” is the molar mass (Unit is mol not Kmol)
Now we have one variable parameter (Pressure) in the equation of force.
Assume that we have this initial properties for hydrogen gas inside the electrolysis system (variable box) are:
- Molar Mass = 2 Kg/Kmol
- Temperature (1) = 25 ⁰C = 298 K
- Pressure (1) = 100 KPa
- Molar Specific volume (1) = 0.0248 m3/mol
- Density (1) = 0.0807 Kg/m3
Assume that depth of seawater is 1000m & density is 1000 Kg/m3. The correspond pressure for the depth will be 99.1 Bar.
Now, when we transfer a mole of hydrogen by a unique method from the variable box to surrounding seawater, the gas will compressed quickly as a result of high pressure of seawater in the bottom. The final states of hydrogen gas properties will be:
- Molar Mass = 2 Kg/Kmol
- Temperature (2) = 25 ⁰C = 298 K
- Pressure (2) = 9910 KPa
- Molar Specific volume (1) = 0.00025 m3/mol
- Density (2) = 7.999 Kg/m3
The last data of will be used to find the force in the bottom of seawater. The Figure (1) is represent a graph of P-F curve to see how the behavior of buoyancy force is affected by changing the pressure (depth) by using MS-Excel software .
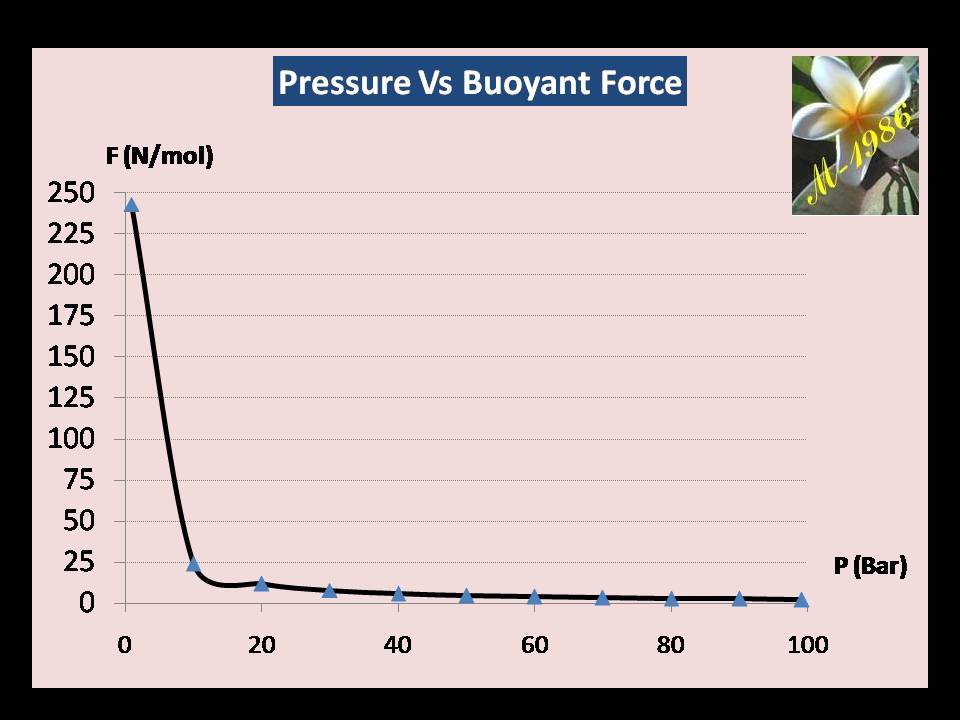
Figure (30) – Graph of Pressure & Buoyancy Force
The force at P= 99.1 bar is 2.43 N/mol (minimum) & at P=1 Bar is 243 N/mol (Maximum).
It obvious that the buoyant force has a inverse relationship proportional with pressure as it’s very weak in the depth of 1000m, but when we use the multi-turbines it will give an advantage to this weakness point.
Anyway, we know that pressure will vary along the depth as we see in graph, so we must find the average force of upward motion of gas.
This can be obtained by integral the buoyant force in respect to the pressure (area of P-F curve) & divide it by the pressure difference as we see in equation (82):
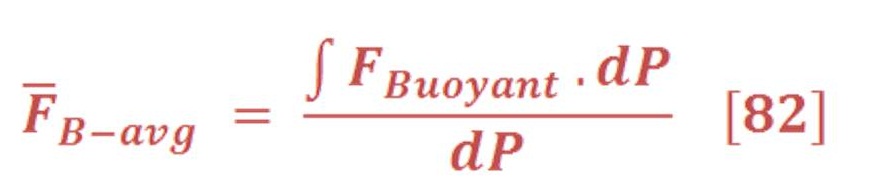
Then, we will obtain:
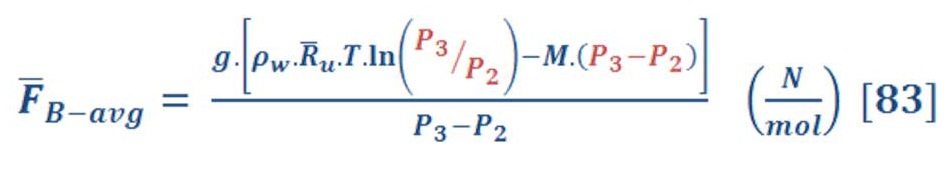
P3 is the pressure at the surface of seawater & definitely is equal to atmospheric pressure (you may assume it P=1 Bar)
When we solve equation (83) for our previous example, we find that the average force is equal to 11.37 N/mol.
It seem the answer is logic because the higher force is exist near the surface of seawater only as a result of increasing the molar specific volume by decreasing the pressure of gas.
Now let us talk about the drag force of Hydrogen motion.
We remember the equation (84), isn’t ?
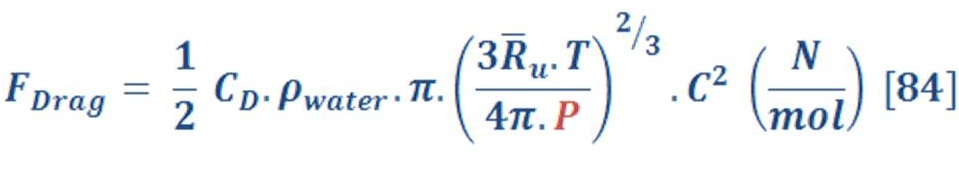
Similar to what we did to the buoyant force, we have one variable parameter “Pressure”.
We will assume the coefficient of drag is 0.5 & average speed of bubble will be C=1.9 m/s (It has been calculated by equal the average force of buoyant & drag). Definitely the initial velocity is zero, but we may use average velocity to determine how the curve of pressure & drag force will be.
The figure (31) shows the result of how pressure effect on the drag force by using MS-Excel software .
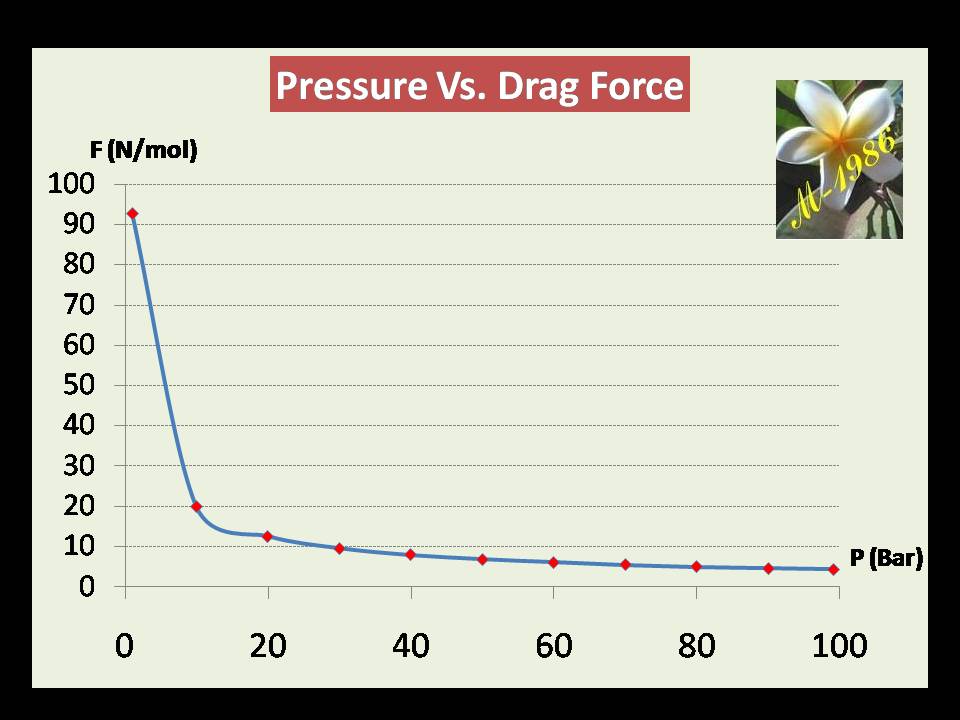
Figure (31) – Graph of Pressure & drag Force
The force @ P= 99.1 bar is 4.33 N/mol (minimum) & @ P=1 Bar is 92.7 N/mol (Maximum).
It seems the effect of pressure on the drag force is similar to the buoyant force.
Now, The average drag force may be obtained by the same manner of average buoyant force. The result of integral will be:
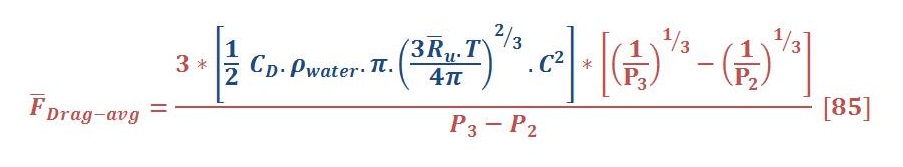
The average drag force for previous example is 10.3 N/mol.
To determine the velocity of bubbles, we must use true-false method until we reach an approximation between the average force of buoyant & drag. When that happen, bubbles will not accelerate according to first law of Newton, but will move in constant velocity.
Now let us to utilize from this kind of force by using the models of Aero-Oceanic Power.
1) Single Impulse Oceanic Turbine (SIOT):
Figure (32) shows the important parameter of SIOT design:
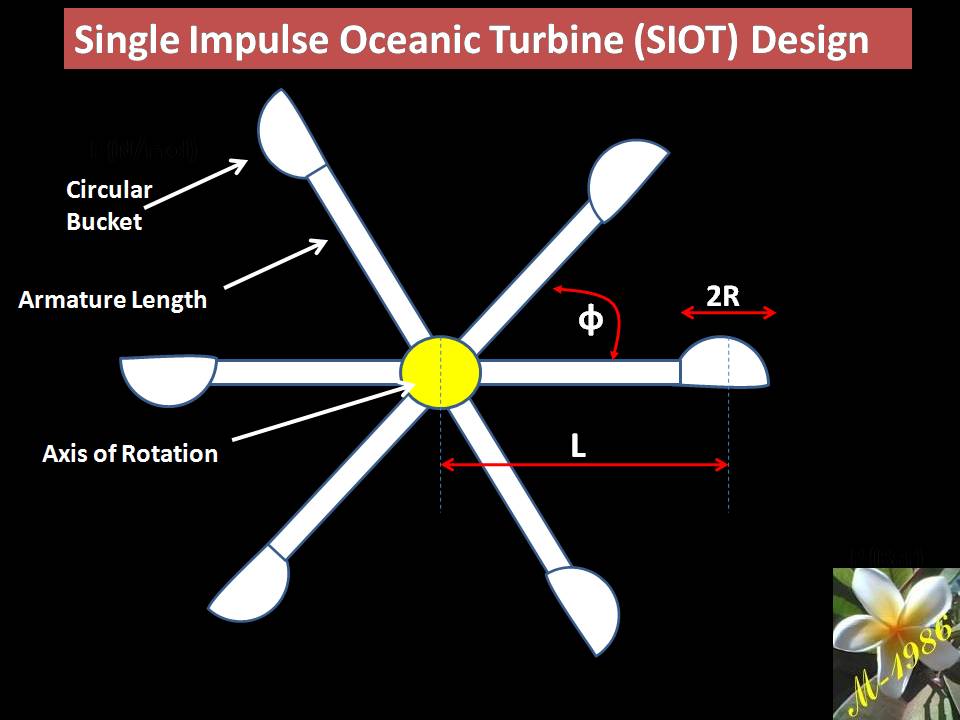
Figure (32) – Design of SIOT
The SIOT system is consist of number of circular buckets, armature & axis of rotation.
The purpose of circular bucket is to keep the bubbles inside until it released in specific angle & to decrease the coefficient of drag.
The symbol “φ” in the figure (32) it’s named as the effective angle. It determines in what angle will bubbles leave the bucket. The required number of buckets is determined by these angle according to the simple formula of equation (86):

Also, we must mention that buoyant force is always upward force. That means the effective force on the turbine will change & it depend on the effective angle as we see in figure (33).
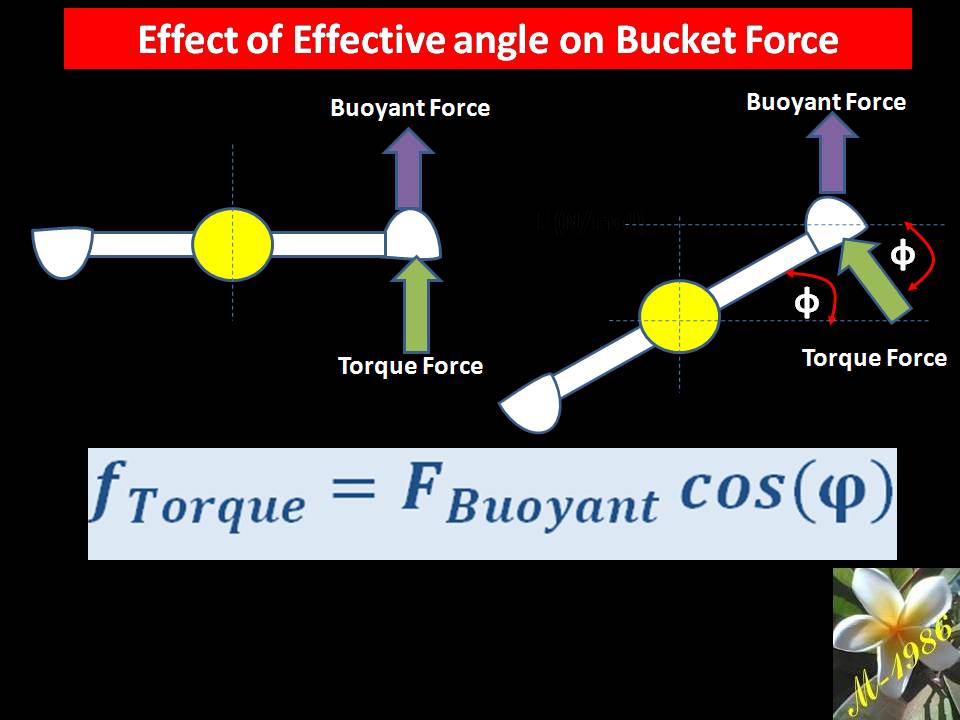
Figure (33) – Effect of Effective Angle on Torque
Equation (87) will determine the effective force as a function of effective angle:

So, we must find the average effective force in the period of effective angle, & that’s may be done by using integral.
Equation (88) give the average effective force on the bucket:

Recall, effective angle in the denominator is in “rad” not “Deg”. You may use this alternative equation:

The average drag force per one bucket motion in steady condition may be found by using equation:

The velocity of bucket may be found by:
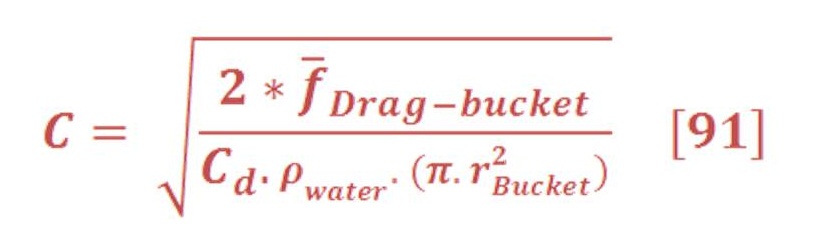
The torque of turbine:

Where:
T_tot: Total Torque (N.m)
B: number of all turbine
f_avg effective: The average effective force on bucket. (N)
L: The radius of turbine armature from the center of rotation to the geometry center of bucket. (m)
The total power of turbine:

ω: The angular velocity of turbine (rad/sec).
Also, we will introduce the molar energy density:
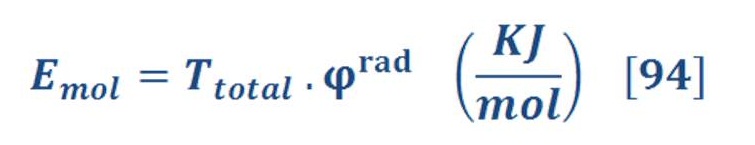
Where:
E_mol : Molar energy density (KJ/mol)
Finally the power density per unit of area:

Where :
P; The power produced (Watt).
L: the radius of turbine (m)
Let us solve an example to understand above equation well.
Assume that we have a design specification of SIOT as follows:
- Effective angle (φ) = 45⁰
- Average Radius of bucket “r” = 0.12m
- Armature length “L”= 2m
- Coefficient of drag on bucket = 0.5
- Density of water = 1000 Kg/m3
Note: The radius of bubbles on the surface will be 18 cm & in the bottom of seawater will be 3.9 cm. As we will use the average force buoyancy, so we must use the average radius of bubbles equal to 0.12m.
By using previous equation & the buoyant force of Hydrogen gas is 11.37 N/mol, we will find:
- The effective force on bucket = 10.24 N/mol.
- Number of bucket = 8
- The drag force per bucket = 1.279 N/mol
- The velocity of bucket = 0.34 m/s
- The angular velocity “ω”= 0.17 rad/s
- The rotational speed of bucket = 1.61 r.p.m
- Torque = 20.47 N.m/mol
- The power = 3.44 Watt/mol
- The molar energy density = 0.02 KJ/mol
- Power Density= 0.27 Watt/m2.
If we intend to produce 10,000 mol (20 Kg) of hydrogen gas per day, the output energy of SIOT model will be 0.16 MJ/Day.
Note: The friction due to motion of mechanical parts has been neglected in all examples)
2) Multi Impulse Oceanic Turbine (MIOT):
The idea of MIOT is very simple as we will use too much single turbine in seawater & it will arranged vertically as we see in figure (34).
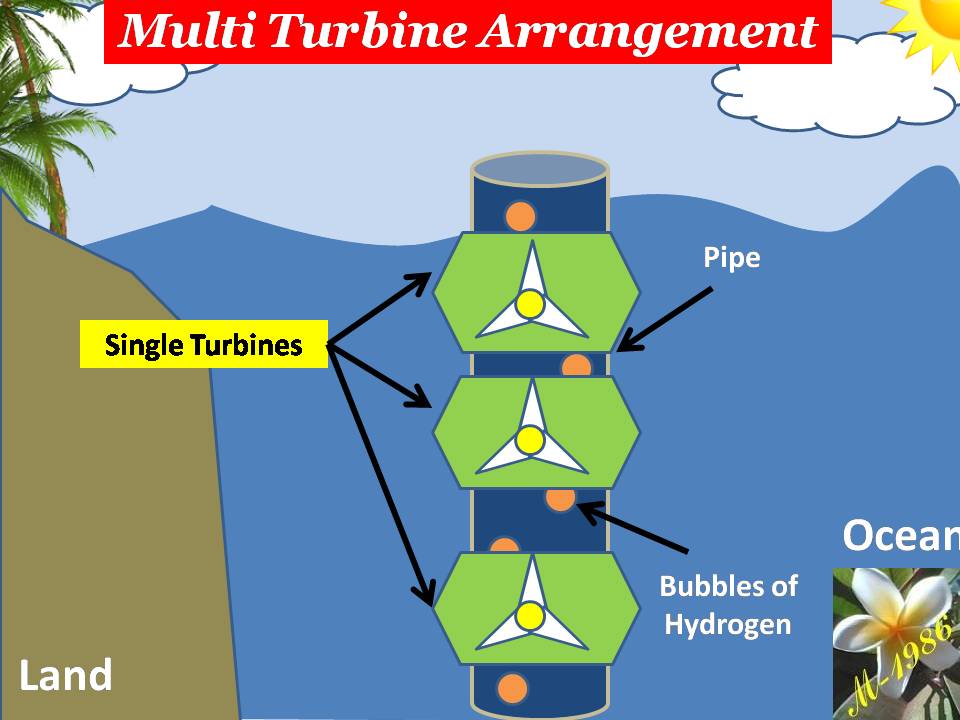
Figure (34) – Design of MIOT
So, we must divide the total depth of ocean into several layers & each layer will have it’s special single turbine (radius of bucket).
The height of layer will be obtained by:

Where:
H_layer: the height of seawater layer “division”
D_tot: The total depth of seawater
K: number of layer/division/turbine
How we can calculate the buoyant force in each layer ?
By the same manner which we have did to bottom & upper surface of seawater. We will find the pressure in the upper & lower part of layer as we see in figure (35).
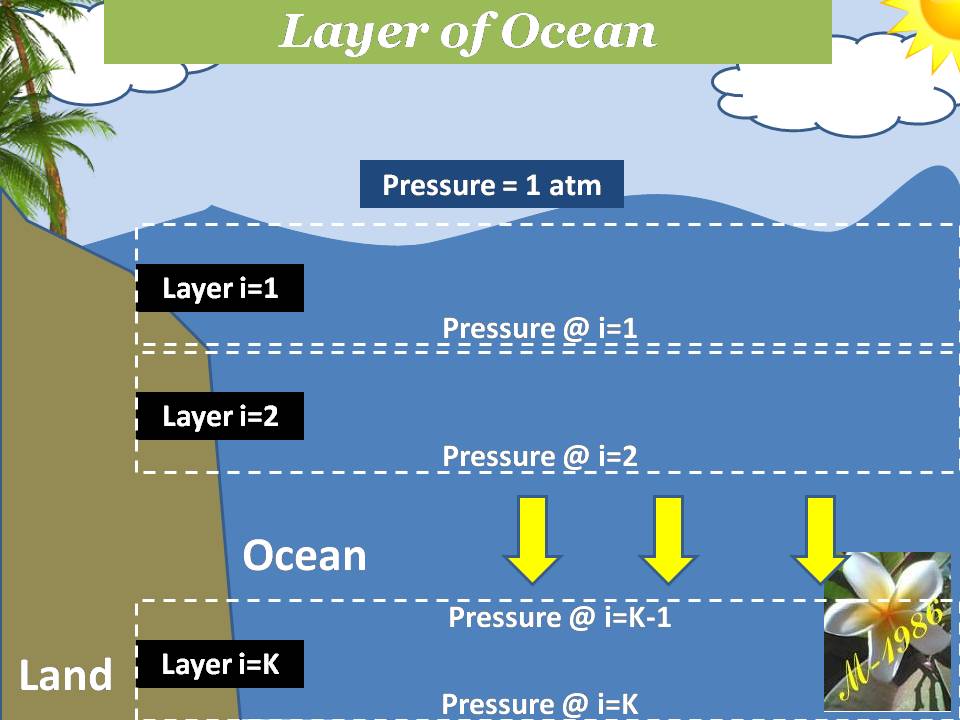
Figure (35) – Pressure Layers of Seawater
by using equation (97):
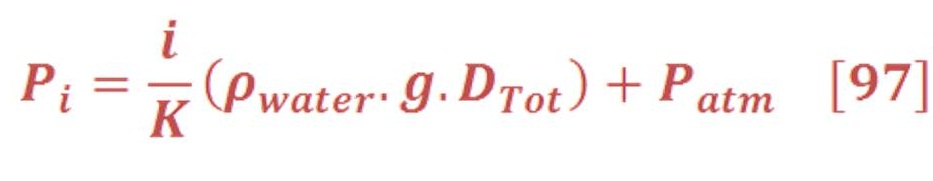
P_i: the pressure in the lower part of layer number “i”
i: a variable parameter (i=1,2,3,4,…..,K)
P_atm: Atmospheric pressure
& then we apply our old & lovely equation (98):
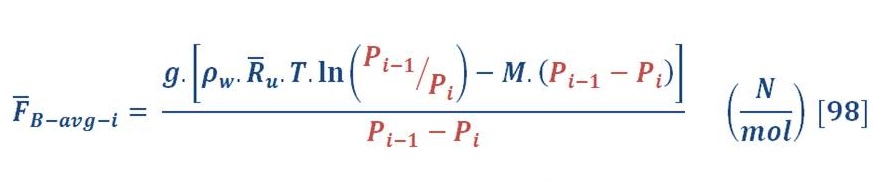
To find average radius of bucket , we must find the average radius of bubbles between the surface & bottom of seawater. We will use equation (99):
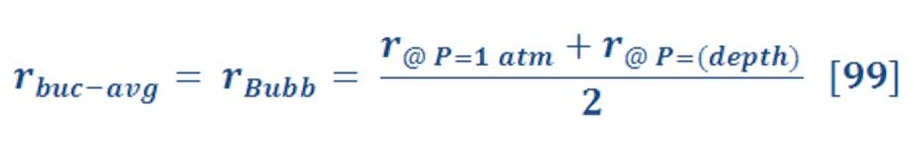
So, we must find the average force per layer on all layer by using summation of all layer average forces:
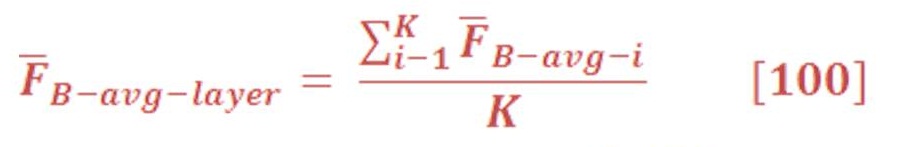
If the total depth of water has still 1000m & we want to divide it by 100 layer (K=100),then each layer will have height of 10m.
It seem that we will not need to equation (100) as the value will be approximately similar to the average force in single turbine.
Suppose that we want to use the multi impulse oceanic turbine (MIOT) models, we will have this information for our study:
- Effective angle (φ) = 45⁰
- Average Radius of bucket “r” = 0.12m
- Armature length = 2m
- Coefficient of drag on bucket = 0.5
- Density of water = 1000 Kg/m3
The average radius of bucket has been assumed according to equation of average radius of bubbles :
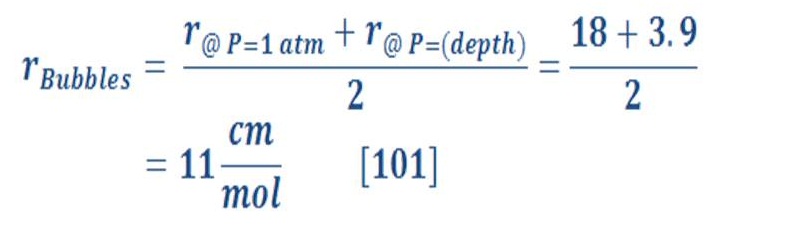
By using previous equation & the total buoyant force of Hydrogen gas is 11.36 N/mol, we will find:
- The effective force per layer= 10.24 N/mol.
- Number of bucket = 8
- The drag force per bucket = 1.279 N/mol
- The velocity of bucket = 0.34m/s
- The angular velocity “ω”= 0.17 rad/s
- The rotational speed of bucket = 1.61 r.p.m
- Torque per turbine = 20.47 N.m/mol
- Number of turbine = 100 unit
- Total torque = 2,047.1 N.m/mol
- The power = 344.27 Watt (0.34 KW/mol)
- The molar energy density = 1.6 KJ/mol
- Power Density= 27.4 Watt/m2
If we intend to produce 10,000 mol (20 Kg) of hydrogen gas per day, the output energy of MiOT model will be 16.1 MJ/Day.
Table (7) compare most features between SIOT & MIOT models.
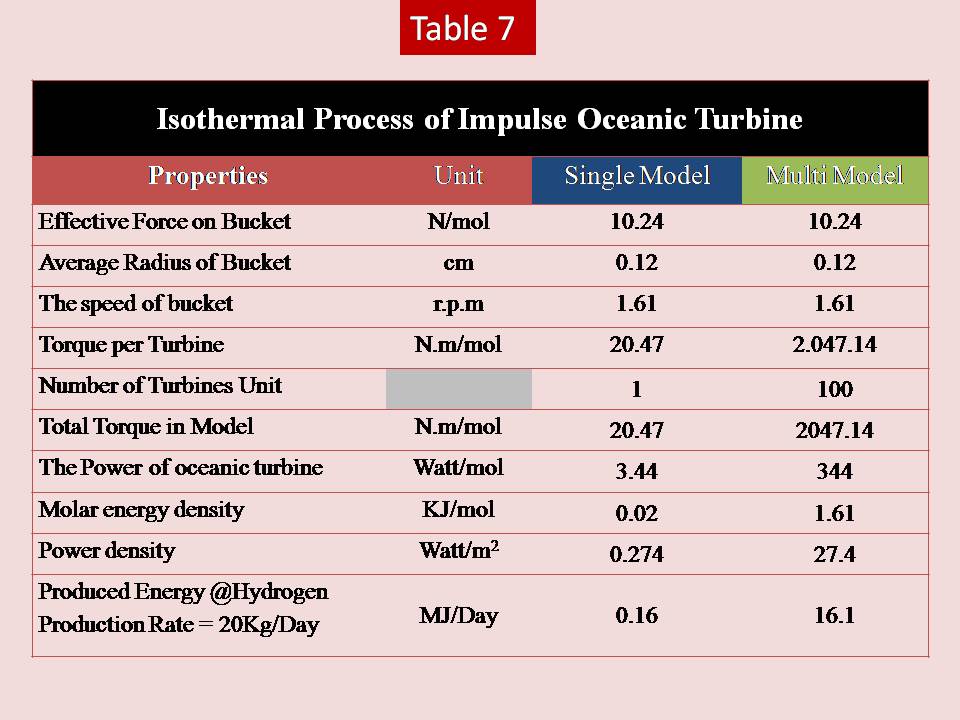
It seems that using multi impulse oceanic turbine (MIOT) model is the best choice for generating electricity but it will be expensive to construct it as we have 100 units of turbine & all must withstand the pressure in the deep water.
Let us to study the reaction oceanic turbine models.
3) Single Reaction Oceanic Turbine (SROT):
Figure (36) & (37) shows the horizontal & vertical view of important parameter of SROT design:
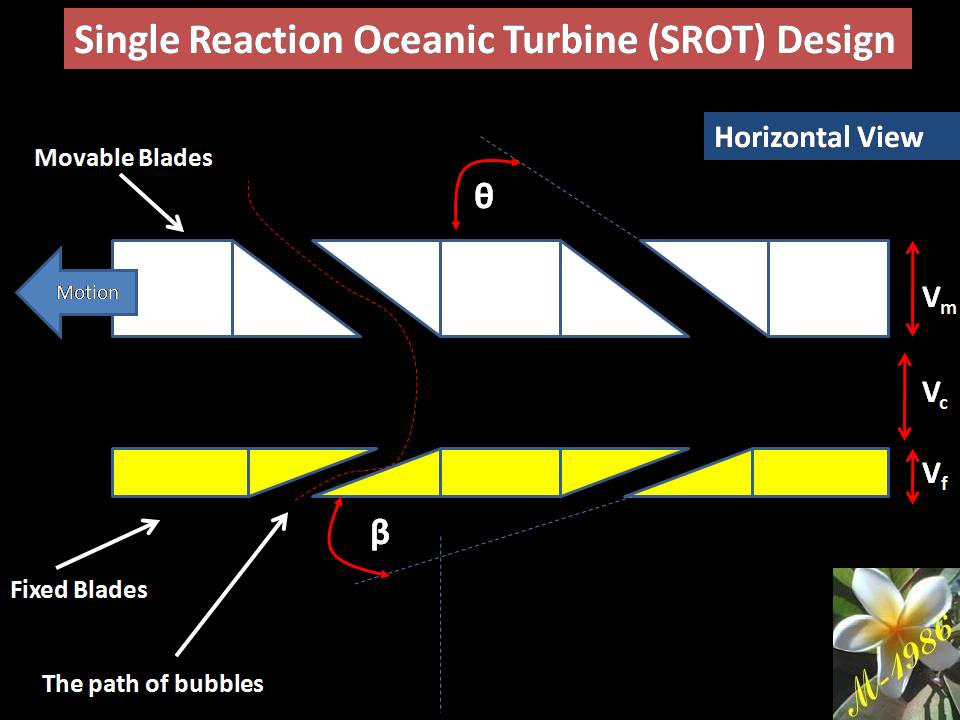
Figure (36) – Design of SROT (Horizontal View)
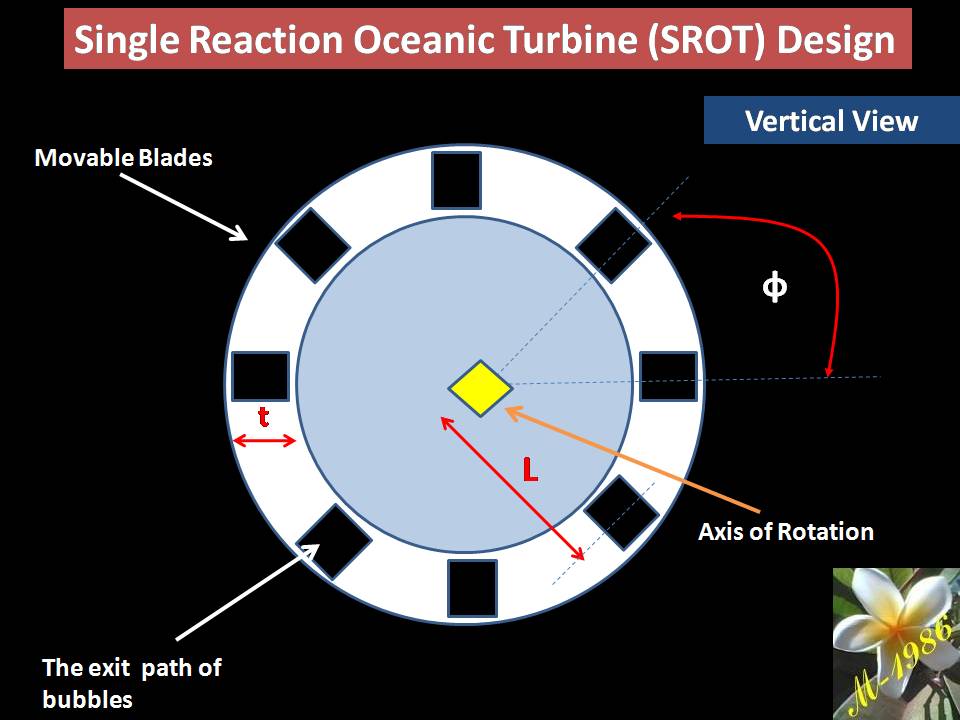
Figure (37) – Design of SROT (Vertical View)
The SROT system is consist of fixed & moving blades .
The different between impulse & reaction , that the flow of bubbles is always perpendicular to the axis rotation of impulse. In the reaction turbine, the flow is parallel & that give us to increase the quantity of turbines per layer.
The important parameters of SROT model are:
1) Angle of attach (θ):
It found in the movable blade & it’s very important parameter as it evaluated the effective perpendicular force of reaction turbines we see in figure (38):
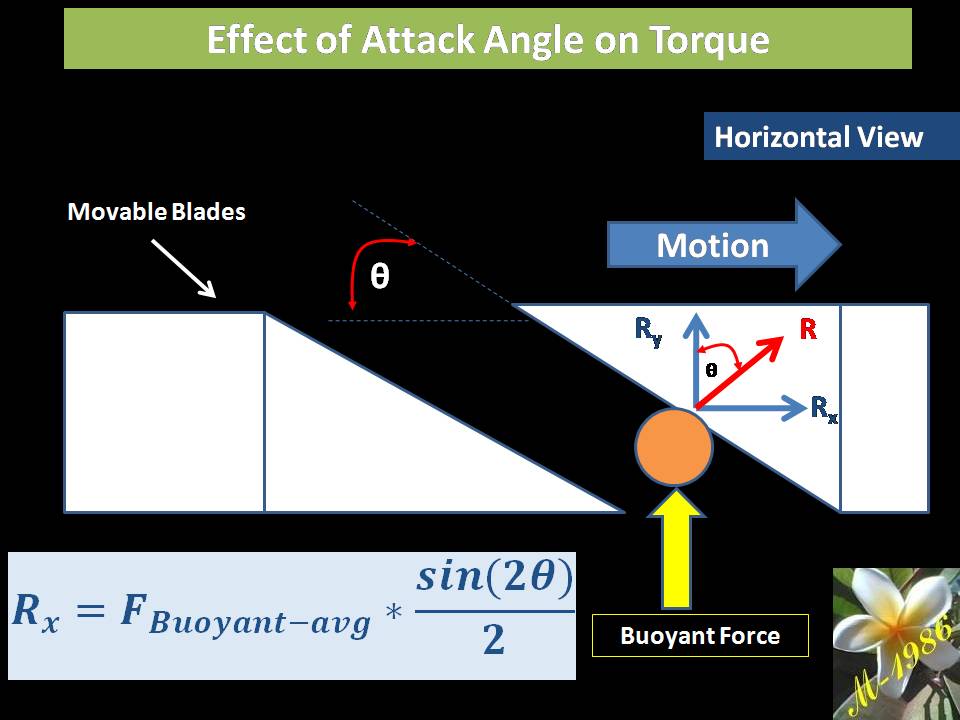
Figure (38) – Effect of Attack Angle
When the bubble hit the inclined wall of moving blade, it will arise an reaction force ( R ) which is equal in magnitude & opposite in direction. This force may be analyzed into two components :
Horizontal force (Rx) = R*cos (Θ)
Vertical Force ( Ry ) = R*sin (Θ)
What we interest about it, is the horizontal force because it is responsible of turbine rotation, so:


Then, the horizontal force become:
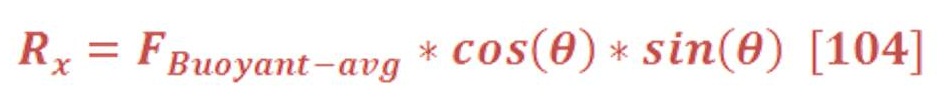
Or by using trigonometric formula :
Equation (104) may be written as:
2) Angle of Entrance (β):
It found in the fixed blade & it’ help us to determine the equivalent & relative path of bubbles when the speed of turbine is zero (stop situation) to give the same result of buoyant force on the moving blade.
Figure (39) shows the velocity triangle of turbine.
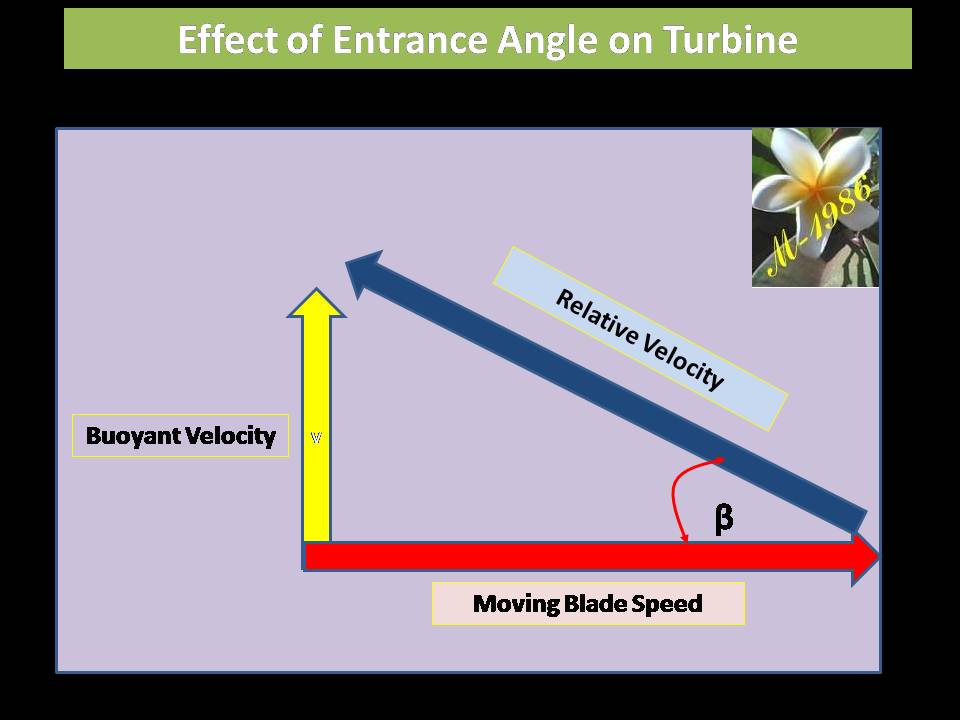
Figure (39) – Velocity Triangle in Reaction Turbine
The angle of entrance may be found by using equation (107):
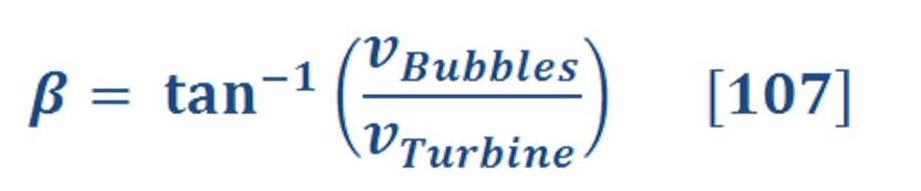
In our recent study we will not calculate the entrance angle as it’s not important for our the purpose of scientific post.
3) Total Width of Turbine:
There are 4 length units must be considered to know what’s the total width of the reaction turbine, and they are:
- The width of moving blades (Vm)
- The width of fixed blades (Vf)
- The width of clearance between moving & fixed blades (Vc)
- The thickness of moving blades (t)
Now the total width of turbine per unit are:

The thickness of turbine will be used to determine the area of drag force on the moving blades. It can be calculated by equation:

All length units may be choose arbitrary except the thickness of blade which must be more than the average diameter of bubbles.
The purpose of total width will help us to know how much reaction turbine may be exist on specific layer & that’s may be calculated by equation (110):
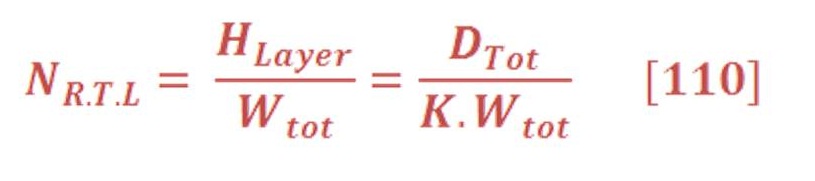
Where:
N_R.T.L : Number of reaction turbine per layer
Dtot is the total depth of seawater,
Hlayer : the height of layer
K: number of layer
Suppose we have this information for single reaction oceanic turbine (SROT):
- Effective angle (φ) = 45⁰
- Attack angle (θ) = 45⁰
- Width of Moving blade = 0.2 m
- Width of fixed blade = 0.2 m
- Width of clearance = 0.01 m
- Thickness of moving blade = 0.24m (the average radius of bubbles is 0.12m)
- Armature length = 2 m
- The layer height = 10 m
- The total depth = 1000m
- Coefficient of drag on blade = 1.2 (blade is similar to rectangular not sphere)
- Density of water = 1000 Kg/m3
By using previous equation & the buoyant force of Hydrogen gas is 11.37 N/mol, we will find:
- The horizontal force (Rx) on blade = 5.68 N/mol.
- Number of blades = 8
- The drag force per blade = 0.711 N/mol
- The velocity of blade = 0.16 m/s
- The angular velocity “ω”= 0.08 rad/s
- The rotational speed of bucket = 0.75 r.p.m
- Torque per turbine= 11.37 N.m/mol
- The total width of reaction turbine = 0.41 m
- The number of units of turbine per layer = 24 (approximated)
- The total torque = 272.9 Nm/mol
- The power = 21.4 Watt/mol
- The molar energy density = 0.21.KJ/mol
- Power Density= 1.71 Watt/m2
If we intend to produce 10,000 mol (20 Kg) of hydrogen gas per day, the output energy of SROT model will be 2.14 MJ/Day.
4) Multi Reaction Oceanic Turbine (SROT):
By the same manner which we have illustrate the multi impulse oceanic turbine (MIOT), it is here valid.
All specification of single reaction turbine will be used except the thickness of blade as it must equal to the average diameter of bubbles which is equal approximately to 0.24m.
There will be 100 layers, so there will be 2400 units of reaction turbine
The result will be after consider the average buoyant force on layer of Hydrogen gas is 11.36 N/mol are:
- The horizontal force (Rx) on blade = 5.69 N/mol
- Number of blades = 8
- The drag force per blade = 0.71 N/mol
- The velocity of blade = 0.16 m/s
- The angular velocity “ω”= 0.08 rad/s
- The rotational speed of bucket = 0.75 r.p.m
- Torque per turbine= 11.36 N.m/mol
- The total width of reaction turbine = 0.41 m
- The number of units of turbine per layer = 24 (approximated)
- The torque per layer = 272.9 N.m/mol
- Number of layer = 100
- Number of all turbines = 2400
- The total torque = 27,285.6 Nm/mol
- The power = 2,142.9 Watt/mol
- The molar energy density = 21.43 KJ/mol
- Power Density= 170.53 Watt/m2
If we intend to produce 10,000 mol (20 Kg) of hydrogen gas per day, the output power of SROT model will be 214.3 MJ/Day.
Table (8) compare most features between SROT & MROT models.
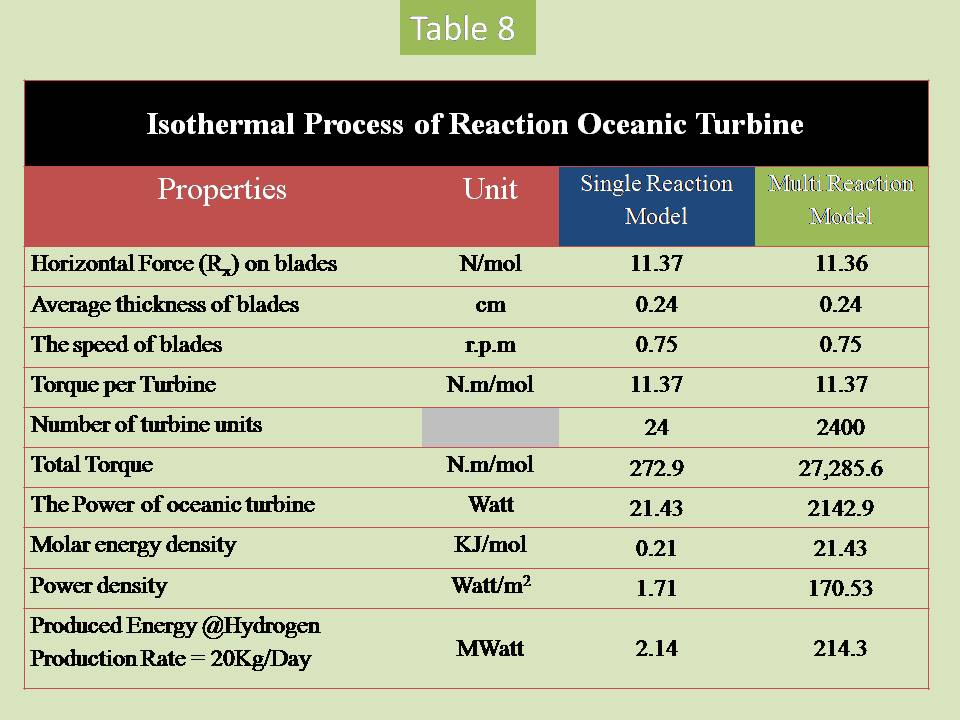
Adiabatic Process & AOP:
Similar to what we did in isothermal process, we will repeat it again but we will add something.
The thermodynamic equation which is governed the adiabatic process is:
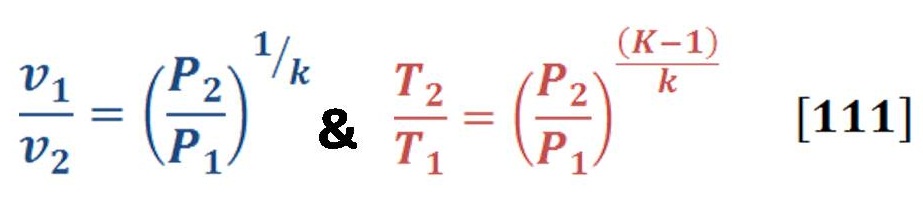
K: is the heat capacity ratio of gas.
Before the gas transfer into the seawater from electrolysis system, it was a thermodynamics properties which may be referred as P1,T1& v1.
While the transferring process, gas will be compressed adiabaticaly & new property will rise P2,T2 & v2. All that happen before starting the buoyancy effect.
Equation (112) is concerned with finding the buoyant force for adiabatic force:,
V2/mol mean the molar volume in state 2:

After substituting equation (111) in equation (112) we will find:
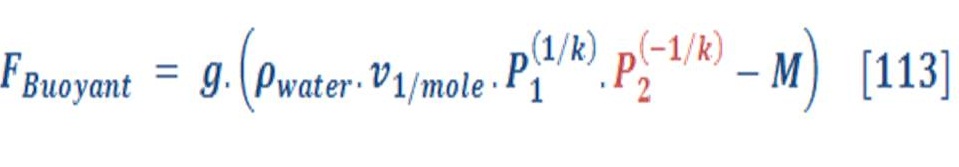
Now we have buoyant force equation with one variable (P2 ) which is change with the depth.
The average force of buoyancy will be similar to the isothermal process & we will find :
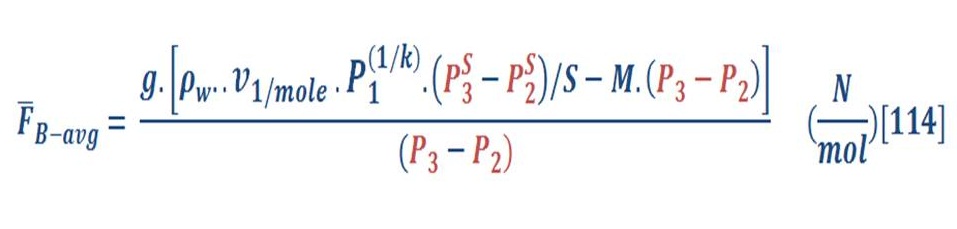
Which :
K is the heat capacity ratio of gas.
Remember the P3 is the atmosphere pressure (upper layer) & the P2 is pressure corresponds to the depth.
The drag force in the adiabatic force is:

Area is the calculated at state (2) by finding the molar volume (2).
Then we will find,
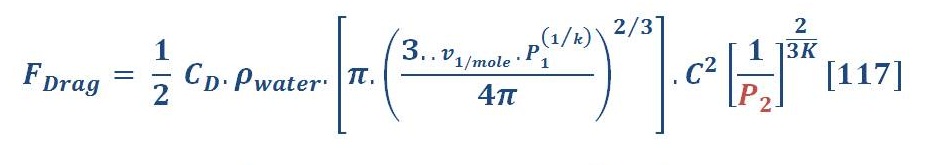
The average force of drag is given by:
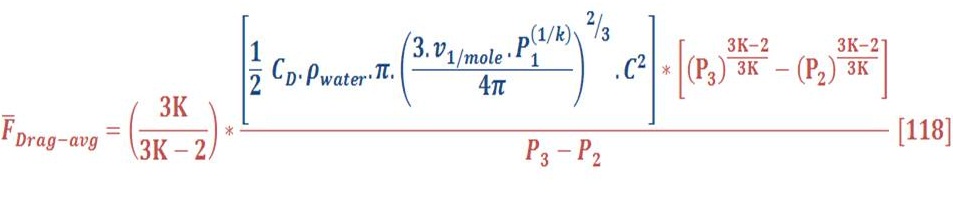
Or
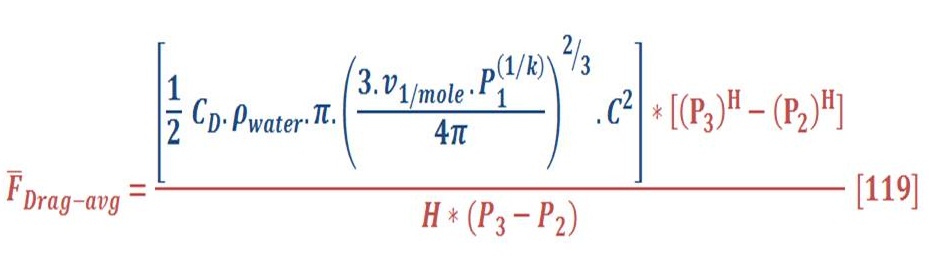
Where:
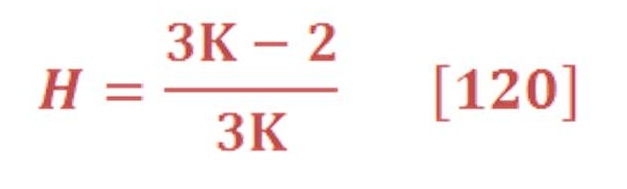
For lovely style of mathematical equation:

Where:
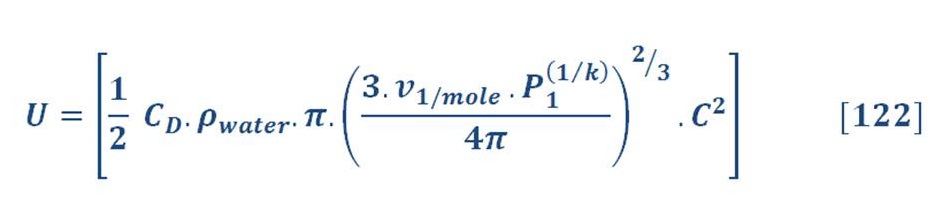
“U” is constant for every change of pressure.
We will not give an example for saving the time. We will give the final result for both impulse & reaction turbine models.
All specifications of model is valid here, so you may use previous data if you want to check the result.
Assume that we have this initial properties for hydrogen gas inside the electrolysis system (variable box) are:
- Molar Mass = 2 Kg/Kmol
- Temperature (1) = 25 ⁰C = 298 K
- Pressure (1) = 100 KPa
- Molar Specific volume (1) = 0.0248 m3/mol
- Density (1) = 0.0807 Kg/m3
Heat capacity ratio of Hydrogen gas (k) = 1.405
Assume that depth of seawater is 1000m & density is 1000 Kg/m3. The correspond pressure for the depth will be 99.1 Bar.
Now, when we transfer a mole of hydrogen by a unique method from the variable box to surrounding seawater, the gas will compressed adiabatically as a result of high pressure of seawater in the bottom. The final states of hydrogen gas properties will be:
- Molar Mass = 2 Kg/Kmol
- Temperature (2) = 848⁰C = 1121 K
- Pressure (2) = 9910 KPa
- Molar Specific volume (1) = 0.00094 m3/mol
- Density (2) = 2.13 Kg/m3
- Heat capacity ratio of Hydrogen gas (k) = 1.405
The average force of buoyancy in adiabatic process is 32.72 N/mol & the average radius of bubbles will be 0.12m.
Table (9 & (10) shows the comparison between single & multi of oceanic turbines for both impulse & reaction type.
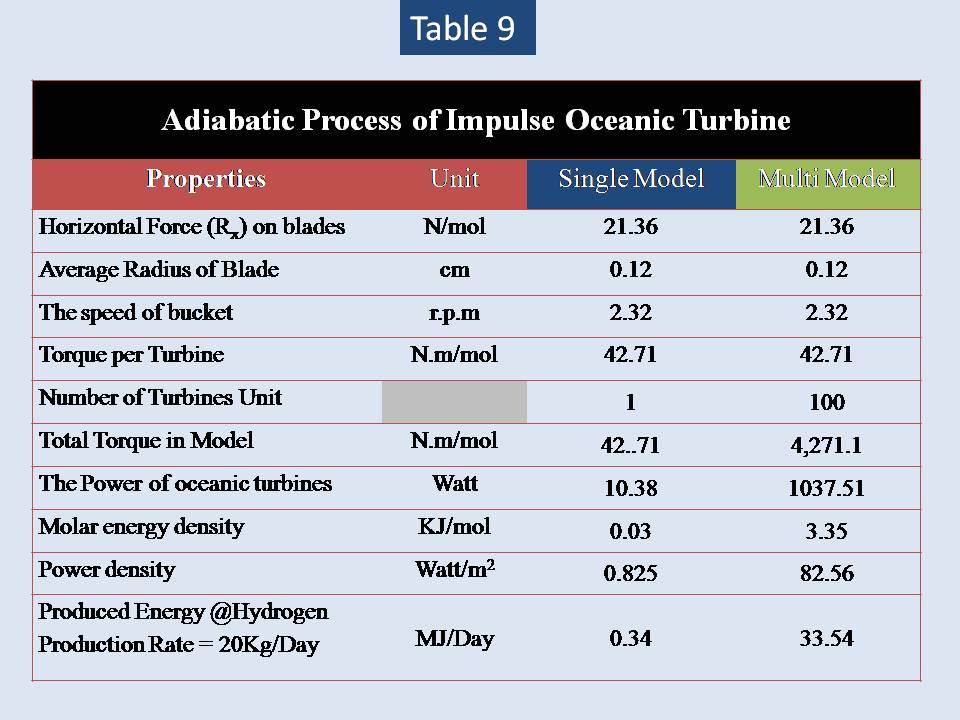
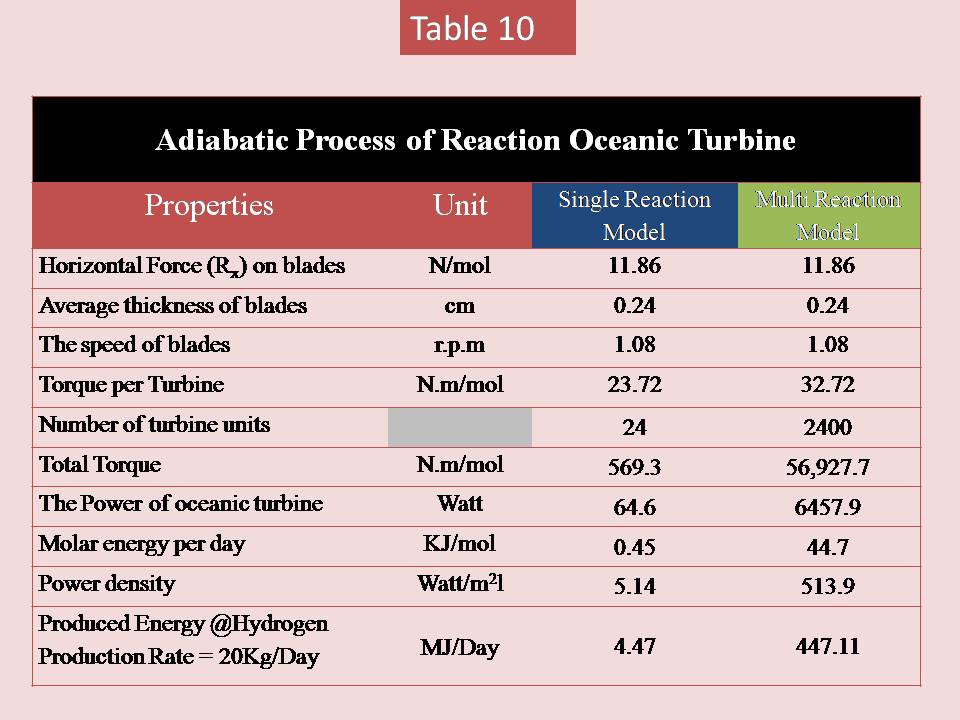
It obvious that adiabatic process is good option for producing power rather than isothermal process. Table (11) shows a comparison for all models of Aero-Oceanic Power (AOP) models with isothermal & adiabatic process for different range of depth.
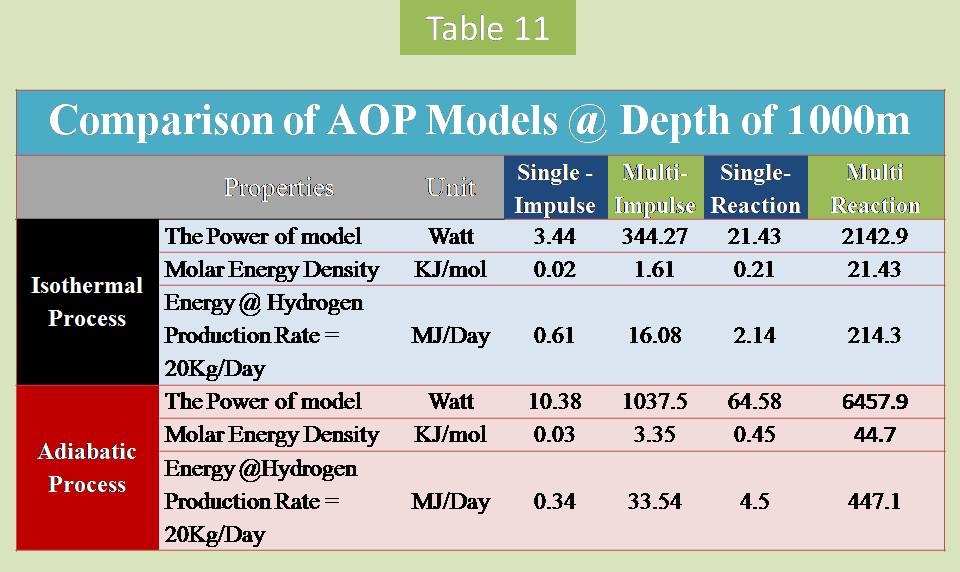
One of disadvantages of the adiabatic process, is that may associated with high temperature (more than 800 ⁰C) due to adiabatic compression by water. So, the surrounding water will evaporated but because the size of water pipe is larger than size of bubble, the effect will be small but still a problem in long term.
As I said previously, the real motion of bubbles is between the isothermal & adiabatic process.
Table (12) shows the a comparison of Aero-Oceanic power (MROT) model in isothermal process with traditional fuel. (Ref-1)
Remember that we are use hydrogen, so 1 mol = 0.002 Kg. Converting molar energy density of AOP 21.43 KJ/mol will be 10.72 MJ/Kg.
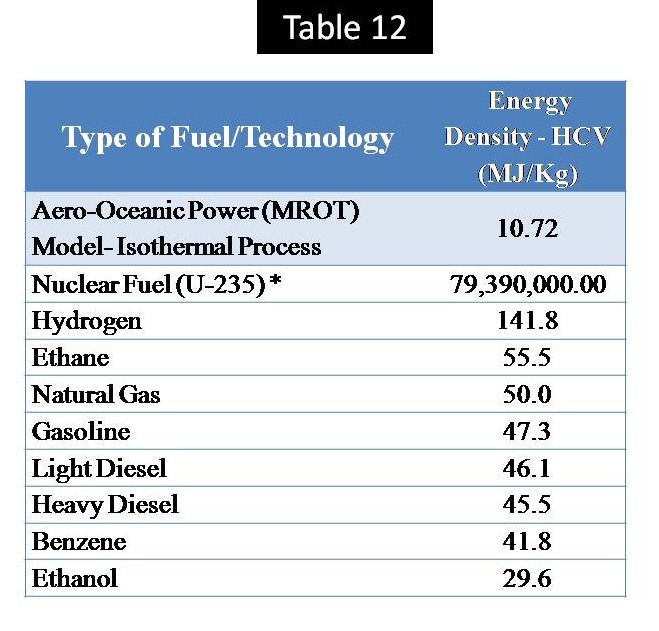
- Nuclear fuel (U-235) value [[Web –7]]
It seem the energy density is very low compared with other fuels, isn’t ?
If we are want to use this energy to increase the efficiency of electrolysis system, then we will have @ STP:
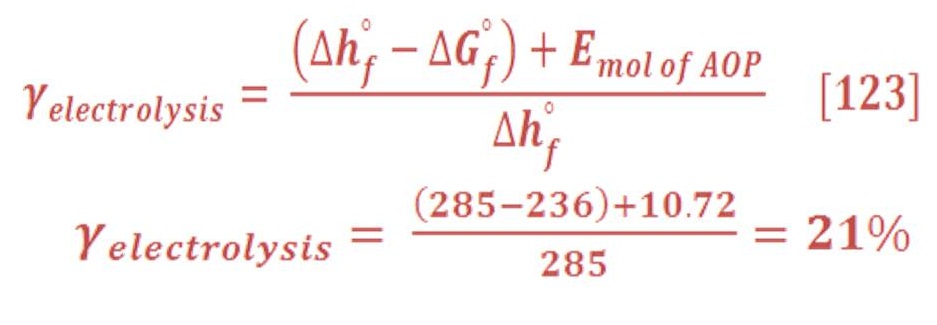
In STP condition, the efficiency is 17%, now by utilizing from the aero-oceanic power (AOP) of hydrogen we may increase the efficiency of electrolysis system of water (liquid) by 4%.
Ok, there is a smart way to increase the energy density of hydrogen gas up to 500 MJ/mol (321 MJ/Kg) which is definitely more than the energy density of hydrogen 285 KJ/mol (141.8 MJ/Kg)
The smart method is called “Recycling Technique of Gas Bubbles”.
We will explain it later.
Table (13) shows a comparison between MROT model of AOP Technology & some of renewable energy technology. [Ref-6 ]]
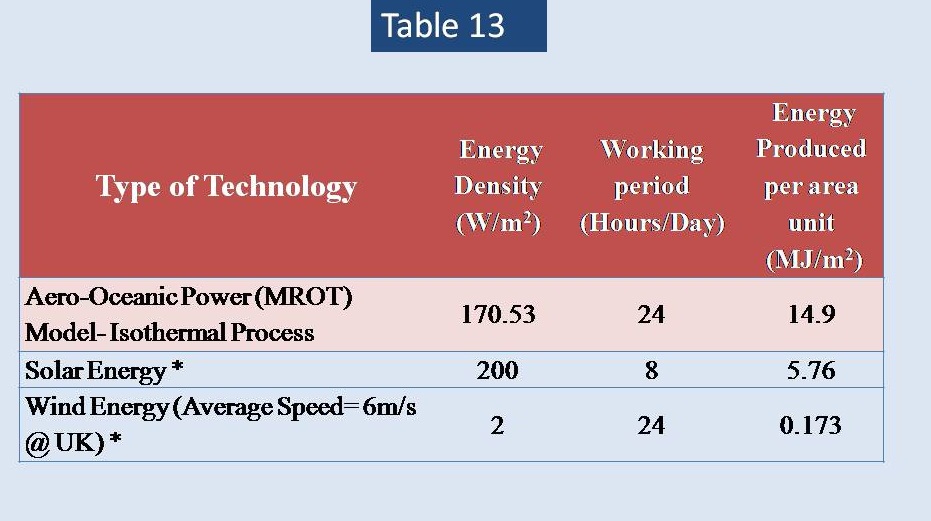
After all positive results of Aero-Oceanic Power (AOP) technology, does anybody ask himself :
“How we may transfer bubbles of gas from electrolysis system “variable box” to the bottom of seawater ?
We must use a magical system as we see in figure (40).
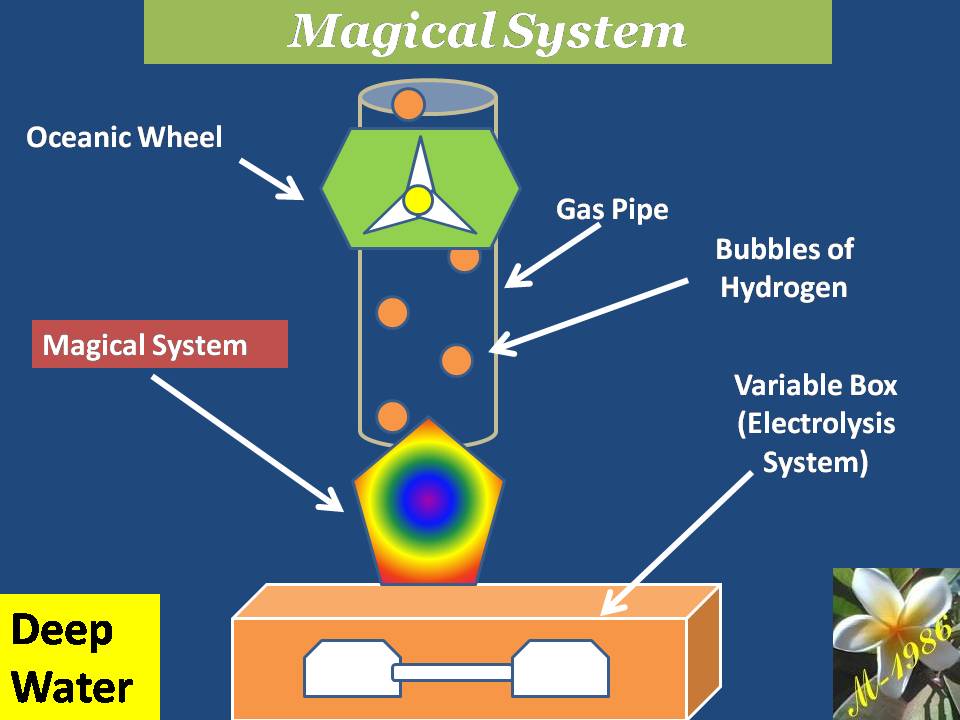
Figure (40) – Magical System in Aero-Oceanic Power Technology
Now, the magical system must comply with some specifications & features:
Not allowed to dissipate too much heat & high temperature in the deep water (adiabatic process – i.e. compressor- is not option at all).
- The electrical consumption is very low.
- Withstanding the high pressure of deep water.
- Effective & fast performance of system for producing bubbles to the gas pipe.
- Lubrication system must be available in the deep water. (No need to maintain the magical system on the land)
Using compressor is an adiabatic process & it’s not a solution. hot bubbles will start vaporize the surrounding water inside the pipe when it raise after short period. Vapor is one Green house gases (GHG) which will effect directly to the global warming.
Also, the required energy to compress hydrogen to 99 bar by using a compressor (assuming the efficiency is 100%) is 24 KJ/mol & definitely you are economically loss, because the power of Aero-Oceanic Power of Hydrogen gas in MROT model (with neglecting the friction of parts) is 21.43 KJ/mol.
So, you must thinking in another solution.
I have found more than 3 design of magical system with less electrical power consumption & iot different totally from compressor device. You may called it as Smart Compressed System (SCS).
One of my very simple design has an electrical energy for transferring the hydrogen gas from the variation box to seawater is approximately equal to 0.24 KJ/mol of hydrogen gas.
Amazing, isn’t ?
Now we will use the “Recycling Technique of Gas Bubbles”
As we see in figure (41) the gas bubbles will recycled in close path similar to the gas/steam power plants.
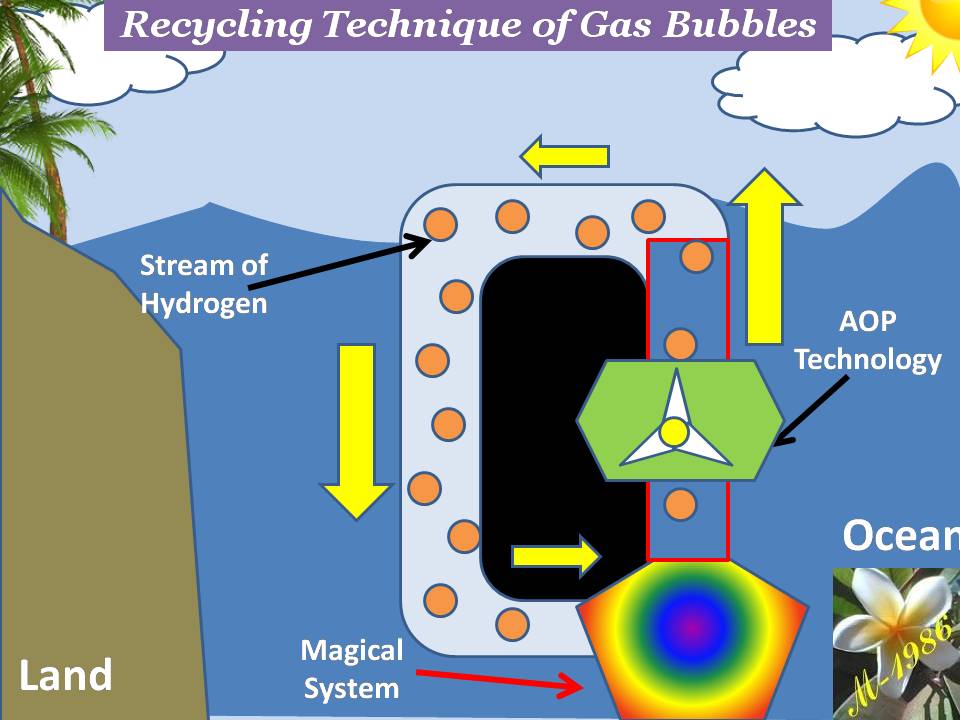
Figure (41) – Recycling Technique of Gas Bubbles
The number of recycling per day give us the value of energy density of gas bubbles.
We must determine the time which the gas (hydrogen) needs to complete one rotation & that’s may be done by using equation (124):
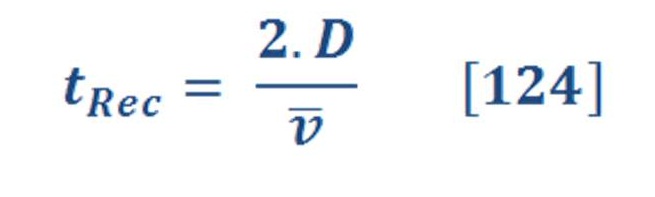
Where:
t_rec: time required to complete one cycle. (sec)
D: The depth of seawater.
v: the average velocity. (m/s)
The number of recycling (N_Rec ) per day is obtained by equation (125):
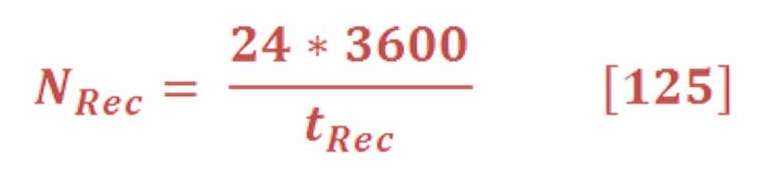
Then, the total energy density of gas bubbles will be:

Let us assume that the average speed of bubbles in water is 2m/s (it’s determined by balancing the buoyancy & drag force). The depth of water is 1000 m.
Then, we will obtain:
- The required time for cycling = 16.6 minute
- Number of recycling = 86.4 rotation
- The energy density of Hydrogen Gas per cycle = 21.4 KJ/mol (10.7 MJ/Kg)
- The total energy density of Hydrogen Gas= 1851.6 KJ/mol (925.8 MJ/Kg)
- The total electrical consumption of magical system = 20.7 KJ/mol
I think there is no need to compare it with hydrogen fuel or to find the efficiency of electrolysis system as it’s very obvious.
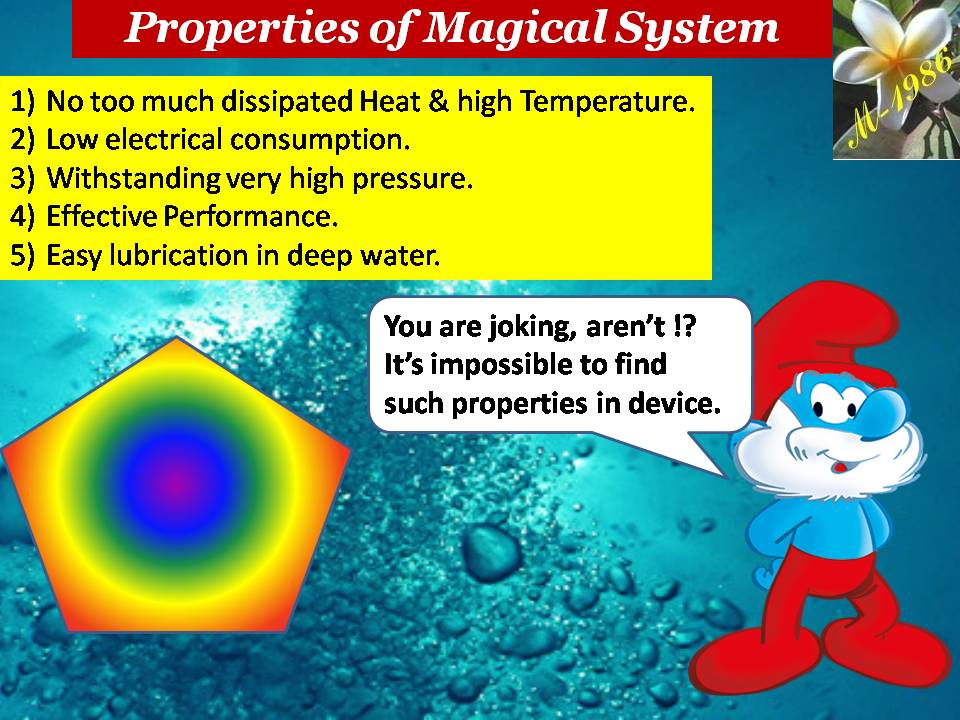
Figure (42) – Magical System is impossible to exist
The magical system is very simple to understand for beginners in engineering science. Experts & professionals will laugh too much for the simplicity of the design but they will liked & they will recommend it strongly for energy & hydrogen industry.
Understanding how the phenomenon of nature is the key to invent simple & effective devices to manipulate with the surrounding natural factors which let us to control the phenomenon as we like positively.
Special Condition: The Magical Ball

Figure (43) – The Magical Ball
Suppose that we have a magical ball which is filled by hydrogen gas & it’s impossible to be compressed at any circumstances.
So, all thermodynamic & hydrodynamic properties will be constant.
Now if the magical hydrogen ball has this properties (neglect the solid material of ball):
- Molar Mass = 2 Kg/Kmol
- Temperature (1) = 25 ⁰C = 298 K
- Pressure (1) = 100 KPa
- Molar Specific volume (1) = 0.0248 m3/mol
- Density (1) = 0.0807 Kg/m3
The constant buoyant force will be at depth of 1000m is :
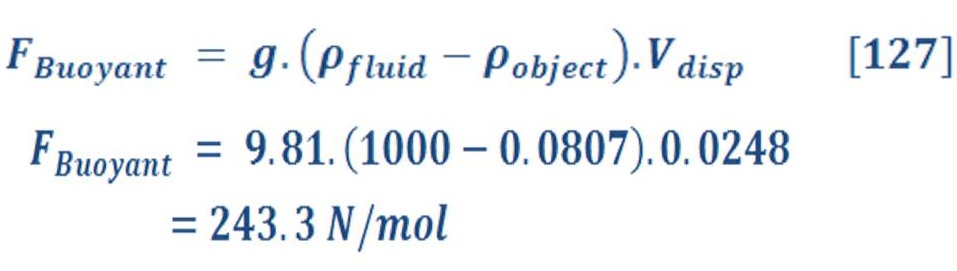
If we are using the multi reaction oceanic turbine (MROT) mode3l of Aero-Oceanic Power by the same specification which we have done previously, we will have in table (14):
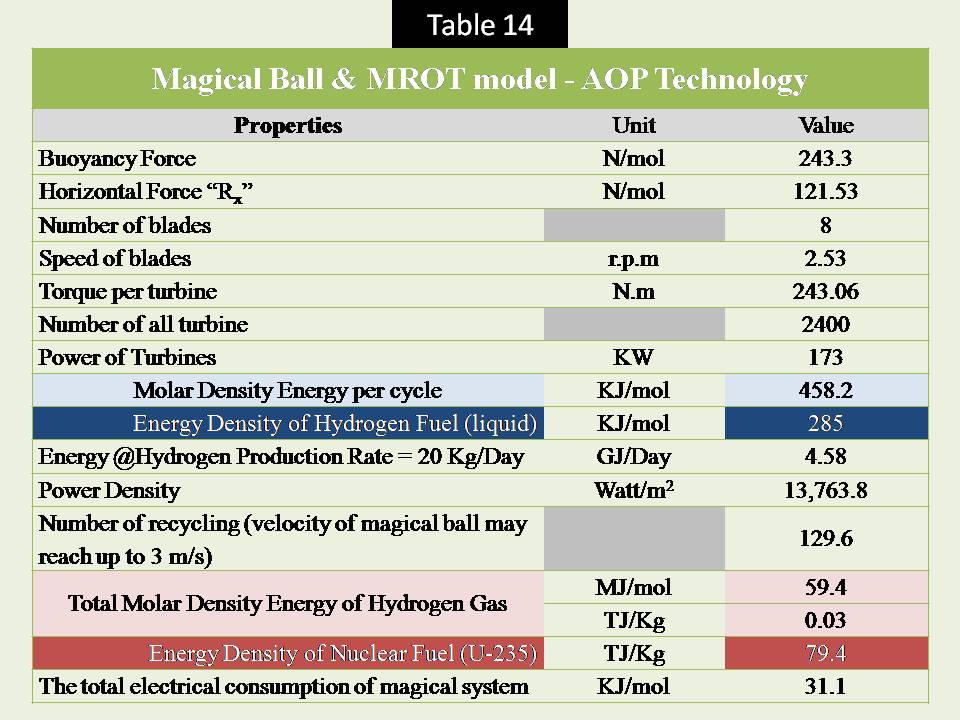
As you see, the total density of magical ball is less than the energy density of nuclear fuel (U-235).
Definitely, manufacturing this magical ball will let us to shut down all nuclear power plants as they are very dangerous zones for human & environment as they contain harmful radiation.
Some of us know what happen to Chernobyl nuclear power plant (1986 ) in Ukraine & Fukushima Daiichi nuclear plant disaster (2012) in Japan.
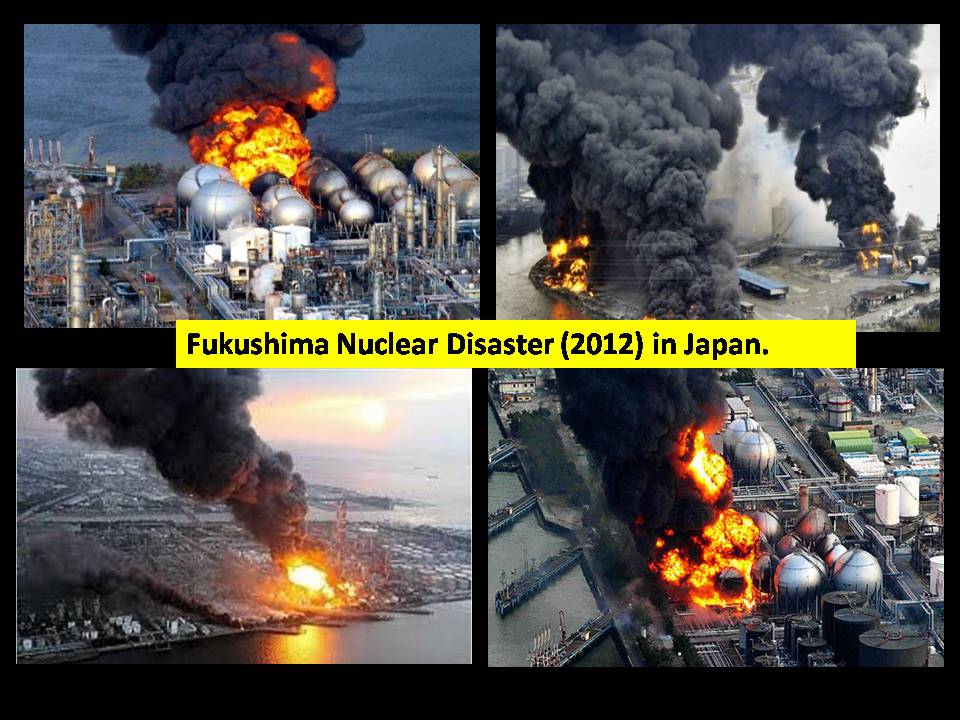
Figure (44) – Fukushima Disaster in Japan
Design the magical ball will be the key for the energy future & you can’t use compressor with magical ball because it is obvious that you can’t compress the magical ball.
So, you will need to use the magical system with magical ball.
Figure (45) – Magical Ball can’t be exist
I don’t spend time yet to think how we design it, so nobody ask me about it recently.
But I will devote my effort to find how we design it& maybe in the future you will hear that someone has made a magical ball which may withstand high pressure of deep water without changing the volume of ball.
Advantages of Deep Water Technique (DWT)
1) Producing Hydrogen fuel for transportation applications, then we will decrease using the fossil fuel.
2) Producing very large energy (electricity) by utilizing from Aero-Oceanic Power (AOP) – proposed technology – compared to the recent & traditional applications (solar, wind & thermal energy).
You may using AOP without need to electrolysis system .
We can definitely establish thousands of multi aero-oceanic power (AOP) without intend to produce hydrogen, so the daily consumption of electricity for country will be sufficient as there are too much area of seawater.. The economical value determine how & where to apply this unique & innovative idea.
But, you must find the appropriate design of magical system to give you the expected result of energy. Compressor is not a solution at all.
3) Solving the crisis of healthy water by producing purified water (Fuel cells) by large quantity .
4) Decreasing the sea level rise (SLR) which is related to increasing the size of electrolysis system to produce hydrogen gas.
5) Supply enough oxygen gas in the deep water or surface of ocean to survive sea animals which located in the deep water.
Challenges of Applying Deep Water Technique (DWT):

Problem 1: Hydrogen may be burn inside the pipe as oxygen is solved in water.
Solution: Substitute the water by oil in the hydrogen gas pipe. The power will decrease because the density of oil is less than water (1000 Kg/m3).
Problems 2: Sharks & big wheel may damage the construction of deep water technique.
Solution: Select a good location which doesn’t contain any big & wild sea animals or build an isolated wall inside the water.
Problems 3: Hurricanes & Storms.
Solution: The same answer of previous problem. Select a good location which doesn’t contain any big & wild sea animals or build an isolated wall inside the water.
Problem 4: The material of pipe is damaged by corrosion.
Solution : You may use electrolysis effect (advanced cathodic protection) or use protective coating to protect your metal from corrosion.
I have made new design for reaction oceanic turbine which let us to reduce the maintenance cost of units due to the corrosion.
Figure (46) shows the configuration of new design. As we see there is no axial rotation for each turbine. There are two axis only along the depth of seawater.
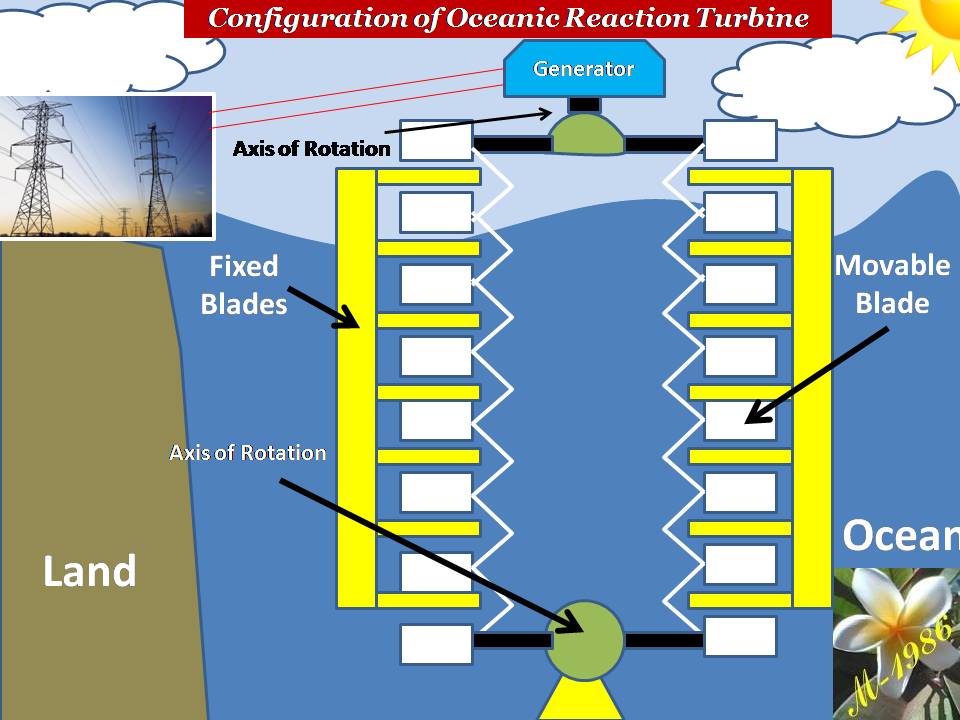
Figure (46) – New Design for Reaction Oceanic Turbine
Miscellaneous Notes:
1) The main electrical generator will be in the upper surface of seawater (oceanic platform/gas ship). That’s mean all turbines will be connected together for decreasing the assets cost of generator. Also, to protect electrical generator from any leakage by the water.
2) The material of pipe in the bottom must be strengthened more than in the surface layers, as the high pressure is exist on the bottom. So, the thickness of pipe will be varied along the depth.
3) By the way, I have forget something important.
Hydrogen will not raise alone in electrolysis system. There is an Oxygen & definitely it has private aero oceanic power (AOP). So, the total power of AOP will be approximately 1.5 times of the hydrogen power.
Why it will not be 2 times of hydrogen power ?
Good question & you must discover the truth by yourself . [Hint : Entropy Reaction]
Conclusion:
We have now noticing many thing about our scientific study, which are:
1) The cell potential of electrolysis system has been increased by reduce the pressure.
2)The deep water technique (DWT) increases the efficiency of electrolysis system by decreasing the pressure for both vapor & water (liquid).
3) The aero-oceanic power (AOP) gives unbelievable quantity of energy.
4) The location of oceanic platform/gas ship to establish the technology is very important factor of success for the project to prevent unusual events which may destroy the technology.
5) Adiabatic process must be not used because it will convert the bottom of cold seawater into heating zone (furnace).
6) Water has been assumed that is pure water. In ocean, seawater has percentage of salinity which will increase the power of AOP technology. The efficiency of electrolysis system must consider the effect of salinity in ocean.
Last words,
1) Story of Deep Water Technique (DWT) &Aero Oceanic Power (AOP) idea:
I found the an initial idea to utilize from electrolysis system of water with Photo-voltaic cells, when I was reading the papers & articles to understand & prepare my last episode “ Advanced Solar Photo voltaic (APV) in ocean “ – LINK HERE – since 3 months ago.
I always write the new ideas to keep & remember it until I decided to explore & expand this idea. It has been done several times & some times, the idea came from the preparation of previous scientific post as it has a direct relationship with the new & old idea.
After I published my last post in 23 of January 2017, I take a rest as it was very hard mission.
Couple of weeks ago (April), I had a leisure time, so I said to myself by meaning“ Let’s begin the exciting adventure to increase my scientific knowledge “
In that day, I was thinking that humidification phenomenon of seawater associated with electrolysis system will produce hydrogen gas efficiently as the water in ocean will evaporate, so the kinetic energy of molecules is weak in gaseous state, then we may break the bonds easily.
Then we can use hydrogen in fuel cell. PV cells will be used as electricity source for electrolysis system of water. I was decided to named it as “Triple Power” (Ocean + PV Cells + Electrolysis)
Humidification process is different totally from boiling as it has some condition which must be exist.
When I was starting to prepare this post ( that means that I should read some references , articles & blogs about what I think it’s valuable to have a clear vision of all related matters with electrolysis) so I discovered that humidification on ocean (as it consider as high humidity zone) will not be utilized too much as it doesn’t depend on the substance states (gas – liquid). Electrolysis is depend on Gibbs free energy.
Ignorance will lead to disaster which can’t be solved by ignorant people
I was feeling scientifically an extreme stupid person in that moment.
Then I was thinking of how to benefit from ocean to produce electricity effectively
The idea of Deep Water Technique has been born in my mind in few days ago
Although what I did & the efforts to increase the electrolysis system in deep water, but the efficiency is still very low, so I thinking again what shall I do to make my idea of deep water technique (DWT) attractive for investors ?
One day, after I make some calculations for the cell potential of electrolysis system, my mother send me to shop of my village.
That day I was frustrated because the result of cell potential was worst & while I was walking I still thinking to find a solution for the low efficiency of electrolysis system of water.
When I reach to the shop, it was crowded, so I wait outside. I saw the truck of soft drinks (Pepsi, Cola, Fanta,…..) & I don’t know why many drivers like to stop his car/truck near the door of the shop. It’s unethical behavior as you will harass the customers of shop. When some Sudanese people learn to think by their mind rather than finishing the job quickly regardless the ethical results.
Anyway, in that moment I glimpsed many soft drink bottles in the ground but I don’t care about it as I’m involved in a critical problem about efficiency of electrolysis system in deep water.
While I was thinking about how we can benefit from ocean & gas bubbles, I turned my eyes into the soft drinks bottles to imagine what I can do with bubbles inside the bottles.
“ bubbles …water…bubbles….water “ I repeated this words in my mind & my eyes is still staring to soft drinks bottles on the ground as you see in left side of figure (47).
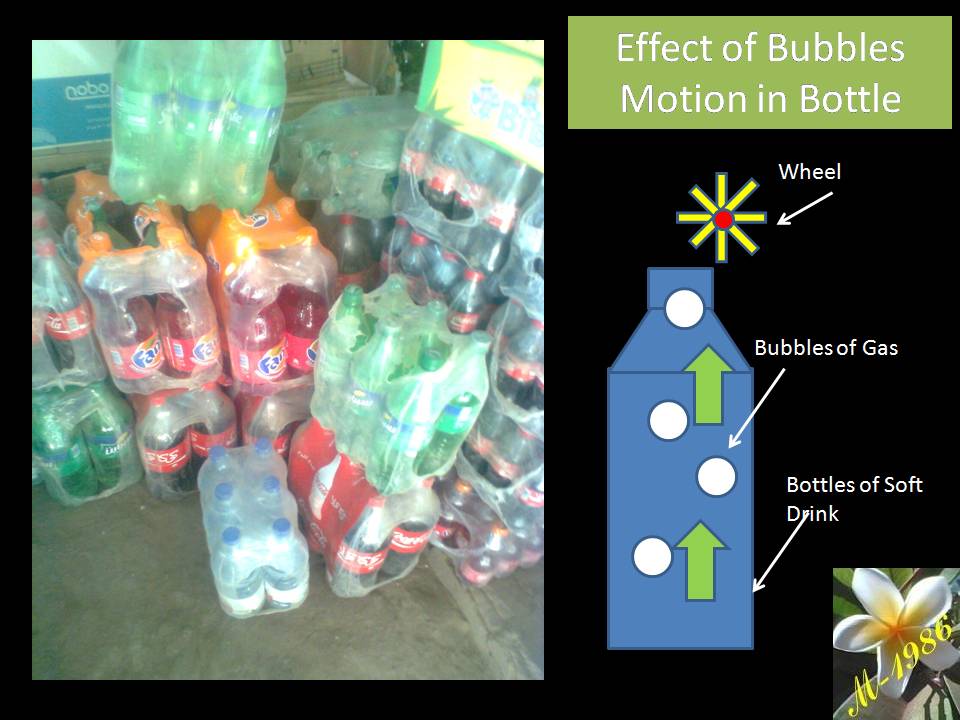
Figure (47) – Soft Drinks Bottles in Shop
And suddenly, I said to myself “ I have found the solution , why we don’t use a wheel/turbine in the surface of the bottle as the bubbles will arise in water with specific velocity. Then the buckets of turbine will rotate “
That’s was very beautiful day which can’t be forgotten. My sad day turned into happy day by finding the Aero-Oceanic Power (AOP) idea.
In one week, I started to establishing all equations related to the AOP & I discovered that putting the turbines on the surface of turbine will not give good result because the velocity of bubbles is too small (less than 2 m/s) & the buoyancy force will disappear.
So, I told myself “ why we don’t put wheel/turbines inside the seawater to utilized from high buoyancy force? “
The result (as we saw previously) was astonished & very proud to myself to find this new kind of power which may change the economical potential for some countries.
2) When I was very close to finish the draft of my post few days ago, I asked myself if anybody has make the same idea of deep water technique (DWT) or the Aero-Oceanic Power (AOP) technology.
I searched & I found one person who thinking like me to put the electrolysis in the deep water but not increase the efficiency of electrolysis.
Figure (48) – Bubbles Generator
He aimed to generate electricity by difference temperature of water & gas.
Any way although that I have some notes about his technology as the figure (48) don’t give a clear picture of the working principles & how the efficiency, I liked his idea of mixing water with air to generate electricity.
You may read his technology here.
3) I will not deny that I have many & many calculations & equations mistakes when I started this episode but I was lucky to discover it.
Always, to be late with excellent preparation is better than to end the job in rush with followed by big repentance. Patient give you chance to rethinking about your idea although that I was very hurry to post it.
Before 2 days of publishing this post, I have discovered an horrible error related to the power (watt) of Aero-Oceanic Power (AOP) technology which was initially depend on the number of moles. All results was imaginable & I was thinking in that moment I have discovered very interesting & innovative idea which has not been exist since decades.
That, Definitely that was wrong & I fixed it.
Before that horrible error, I was not even thinking about “Recycling Technique of Gas Bubbles” Idea. When I saw the result of energy density of hydrogen by AOP is very low, I think to find something to increase the energy density. Then the concept of recycling has been raised in that moment.
Thanks for The God as I escaped from putting myself in a very embarrassing situation from experts & professionals.
I believe always there is an “Engineering Feeling & Sense” which let you to doubt about your result if you are love science from your heart & want to change the universe to be more welfare, greener & comfortable to all organism (Human, animals & plants).
Amazing achievement, isn’t ?
Studying, preparation & writing the scientific post has been done in 2 weeks only (7-24 April 2017) & until yesterday I still modified the scientific post as I found some new ideas to improve the DWT & AOP technologies.
Science reveals the darkness of ignorance & give you strong belief about the case which you decided to adopt it & share it with reasonable people.
Waiting my 6th scientific episode for solving the Sea Level Rise (SLR) Issues

Thank for giving me your glory time to read my modest scientific post

Citations (Reference, Articles & Websites)
[[Ref-1]] – Thermodynamic – An Engineering Approach, 5th Edition , By: Yunus Cengel & Michael Boles [Textbook] McGraw Hill
[[Ref-2]] – Principles of Modern Chemistry , Seventh Edition (2012) – By:David W. Oxtoby, H.P. Gillis, Alan Campion – Brooks/Cole Engage Learning
[[Ref-3]] – Hydrogen Fuel Cell Vehicles –CLIMATE TECHBOOK – PEW Center Global Climate Change – March 2011
[[Ref-4]] – Fuel Cell Technologies Program – Hydrogen and Fuel Cell Technologies Program: Storage – US Department of Energy – Energy Efficiency & Renewable Energy
[[Ref-5]] : Fuel Cell Technologies Program – Energy Efficiency & Renewable Energy – US Department of Energy
[[Ref-6]] : Liverpool Energy Day
[[Web-1]] – (Dangerous of Hydrogen Fuel) : http://www.livestrong.com/article/128201-dangers-hydrogen-fuel-cells/
[[Web-2]] – (The smell of safety Odorized Gas ): http://www.elgas.com.au/blog/654-the-smell-of-saftey-odourised-gas
[[Web-3]] – (Hydrogen energy application) : http://www.lindeus.com/en/innovations/hydrogen_energy/hydrogen_energy_applications/index.html
[[Web-4]] : (Why are absolute enthalpies of reactants not available) : http://www.chemistry.stackexchange.com/questions/40291/why-are-absolute-enthalpies-of-reactants-not-avalable
[[Web -5]]: ( Water Hydrogen Bonding): www1.lsbu.ac.uk/water/water_hydrogen_bonding.html
[[Web-6]] – (The orientation of hydrogen bonds as water changes states dictates the properties of water in it’s gaseous, liquid & solid forms) : http://www.boundless.com/biology/textbooks/boundless-biology-textbook/the-chemical-foundation-of-life-2/water-51/water-s-states-gas-liquid-and-solid-282-11415/
[[Web-7]]: (Energy density of nuclear ) : https://whatisnuclear.com/physics/energy_density_of_nuclear.html
[[Web-8]]: (Marina Trench): http:// En.m.Wikipedia.org/wiki/mariana_trench


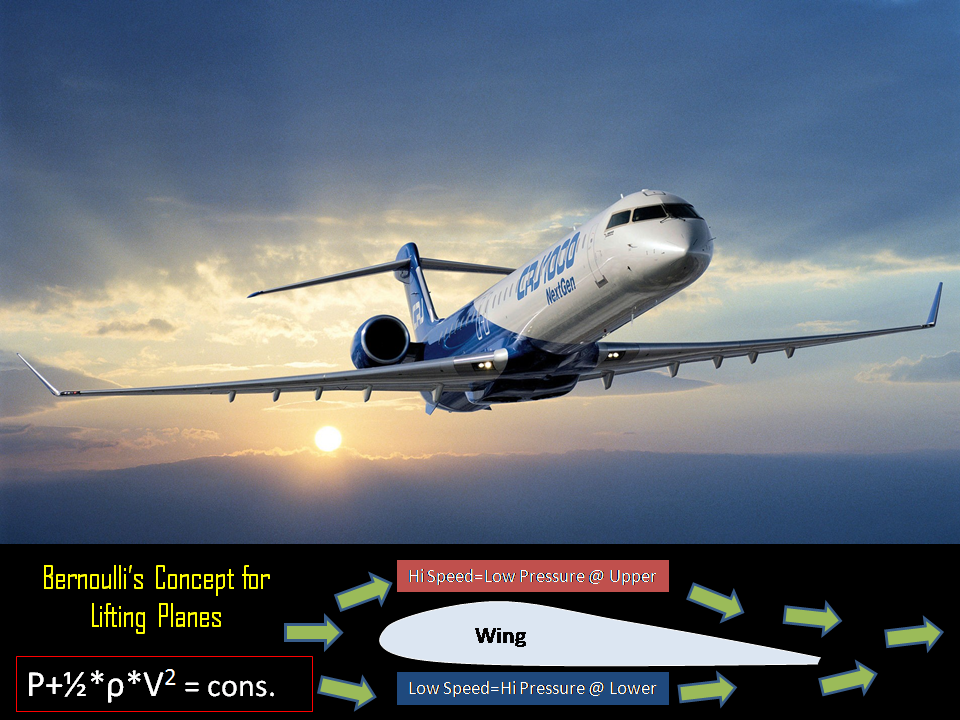

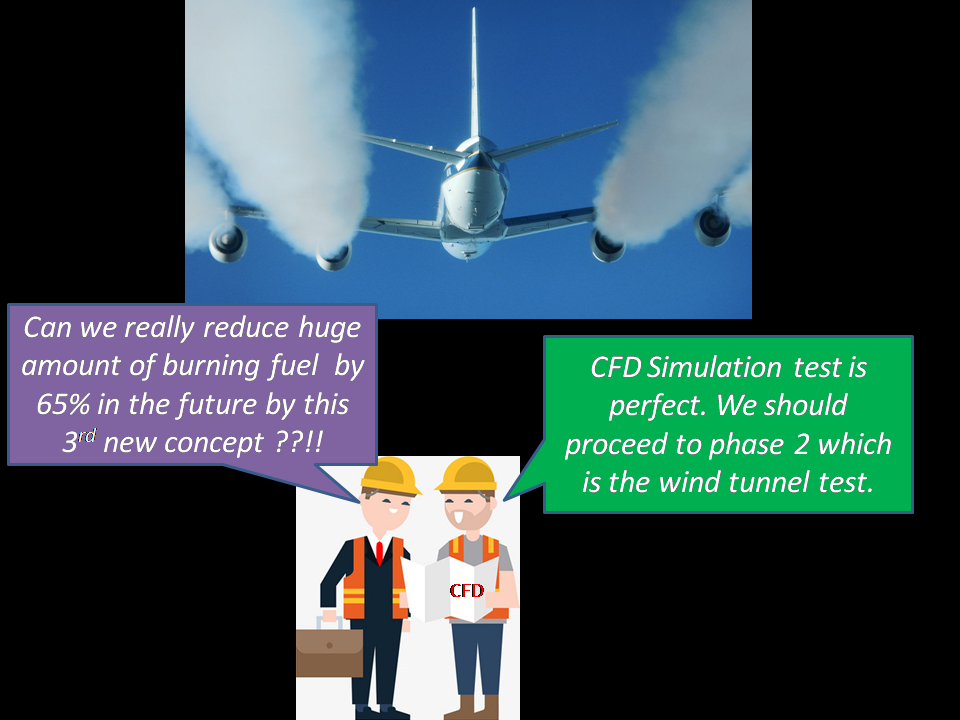
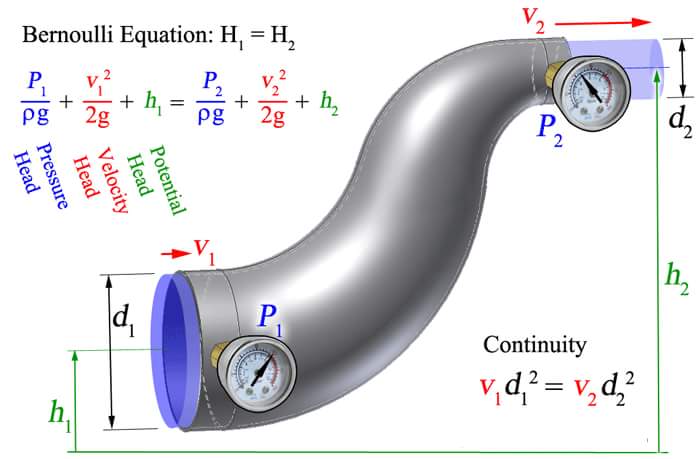

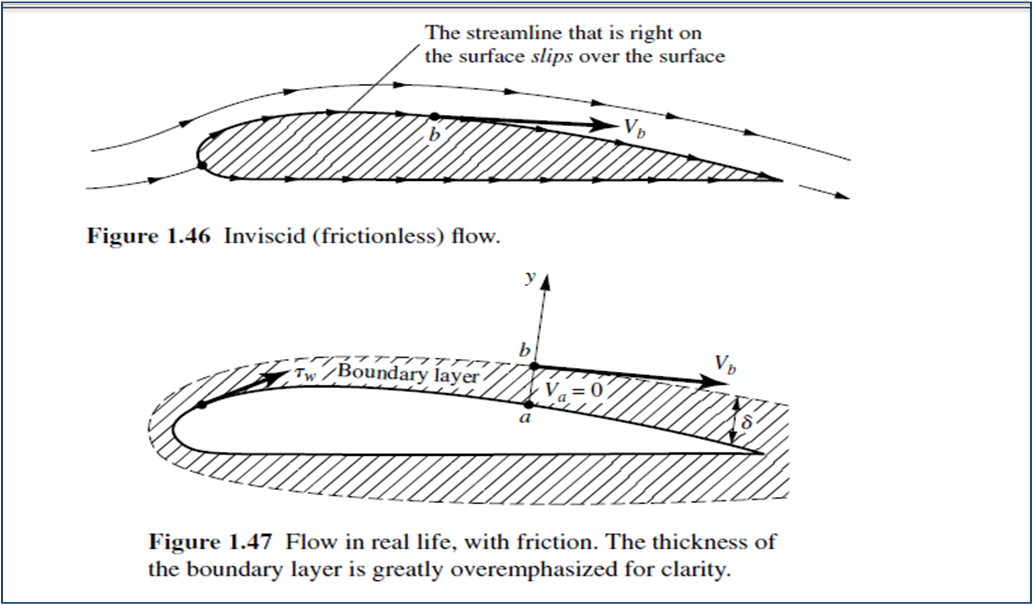


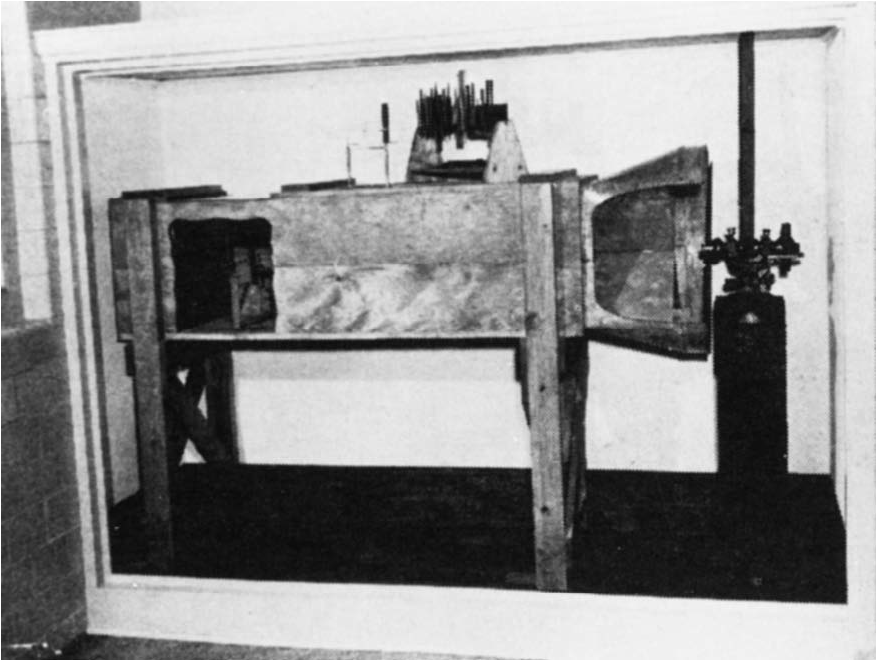

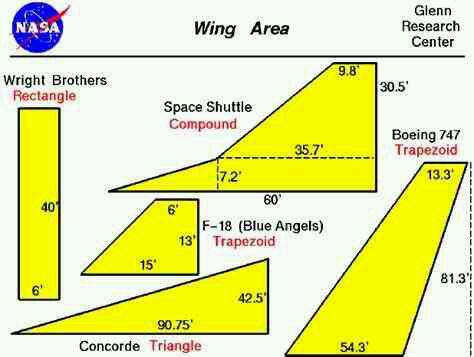

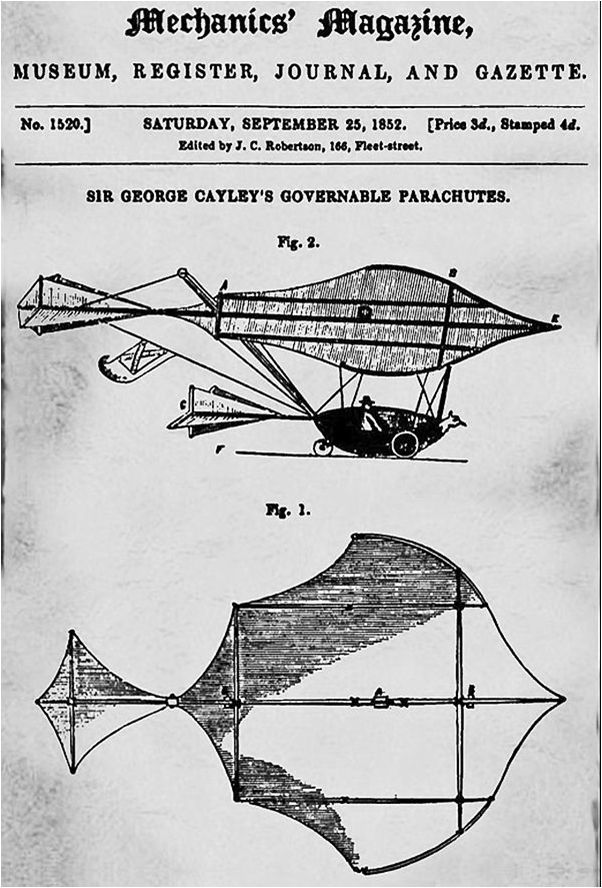
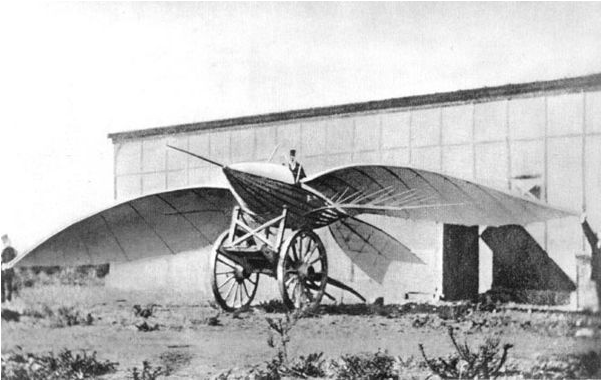


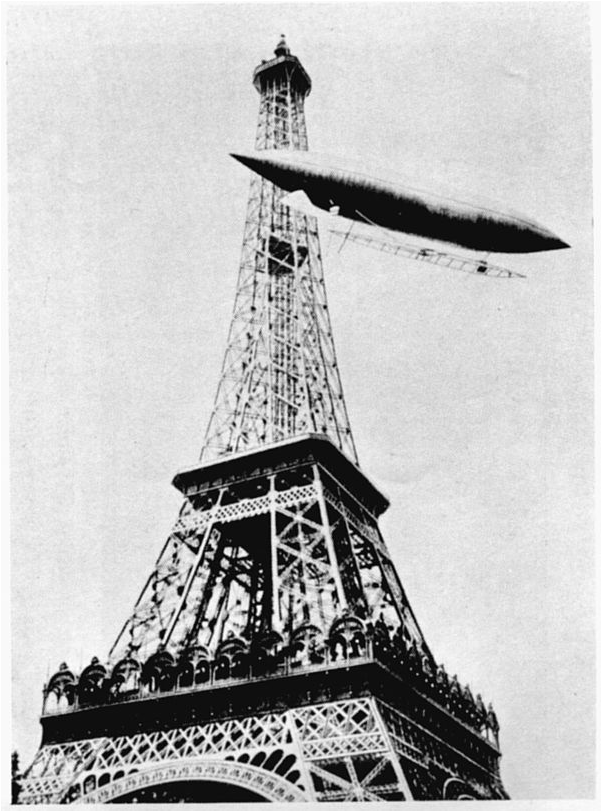


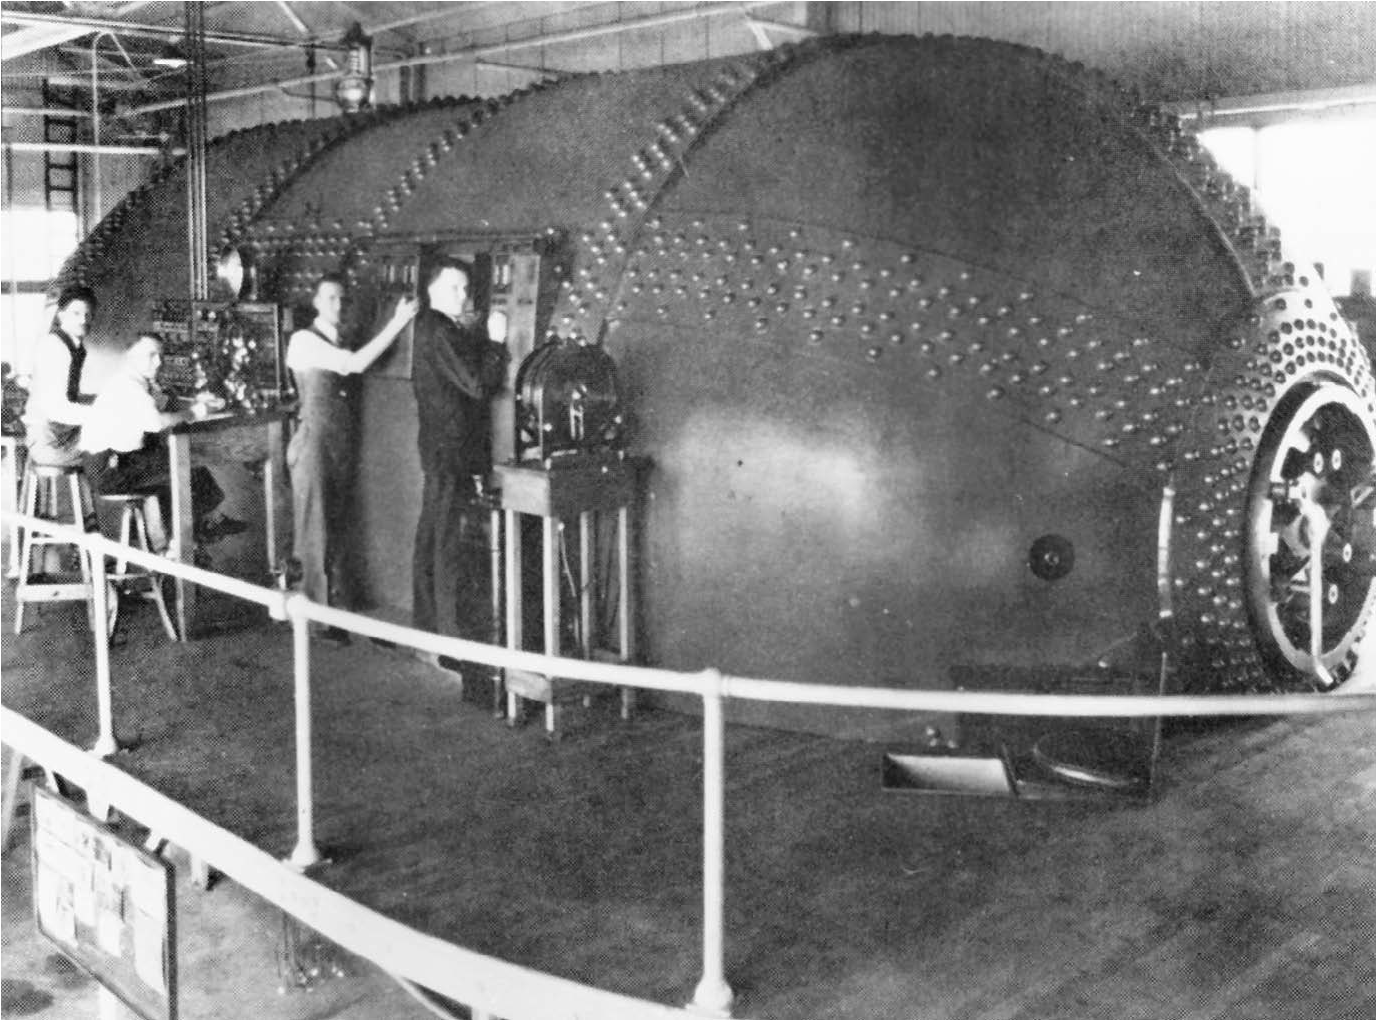
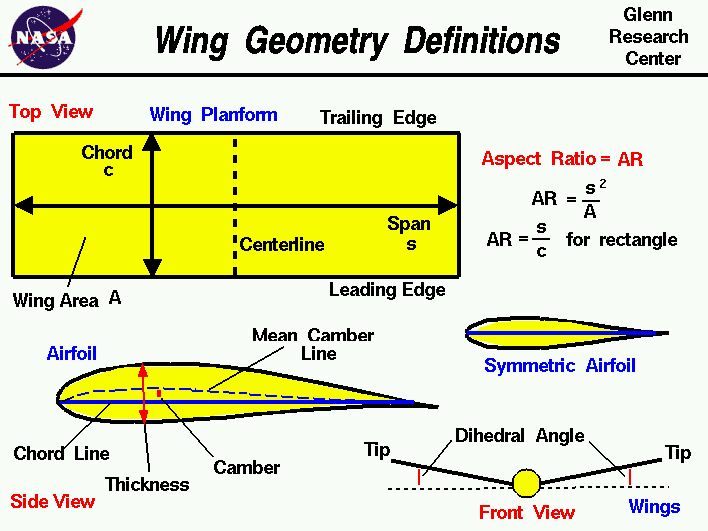
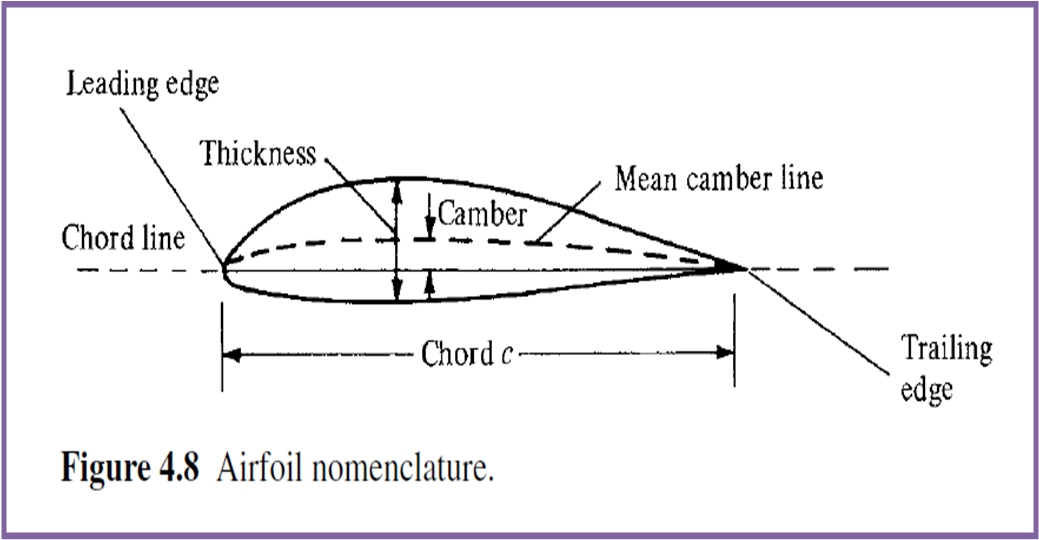
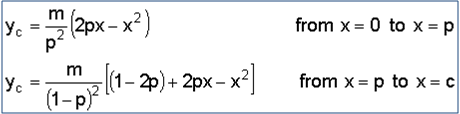


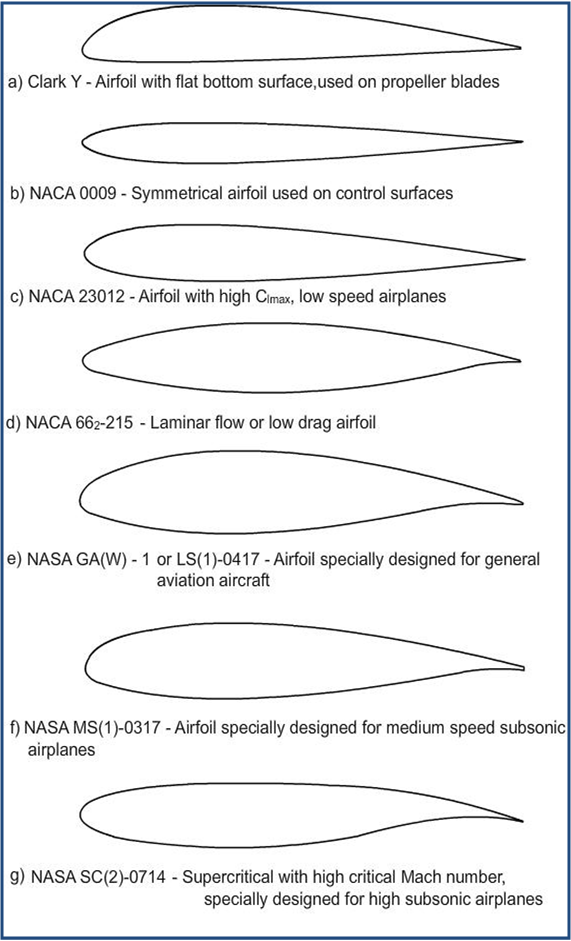
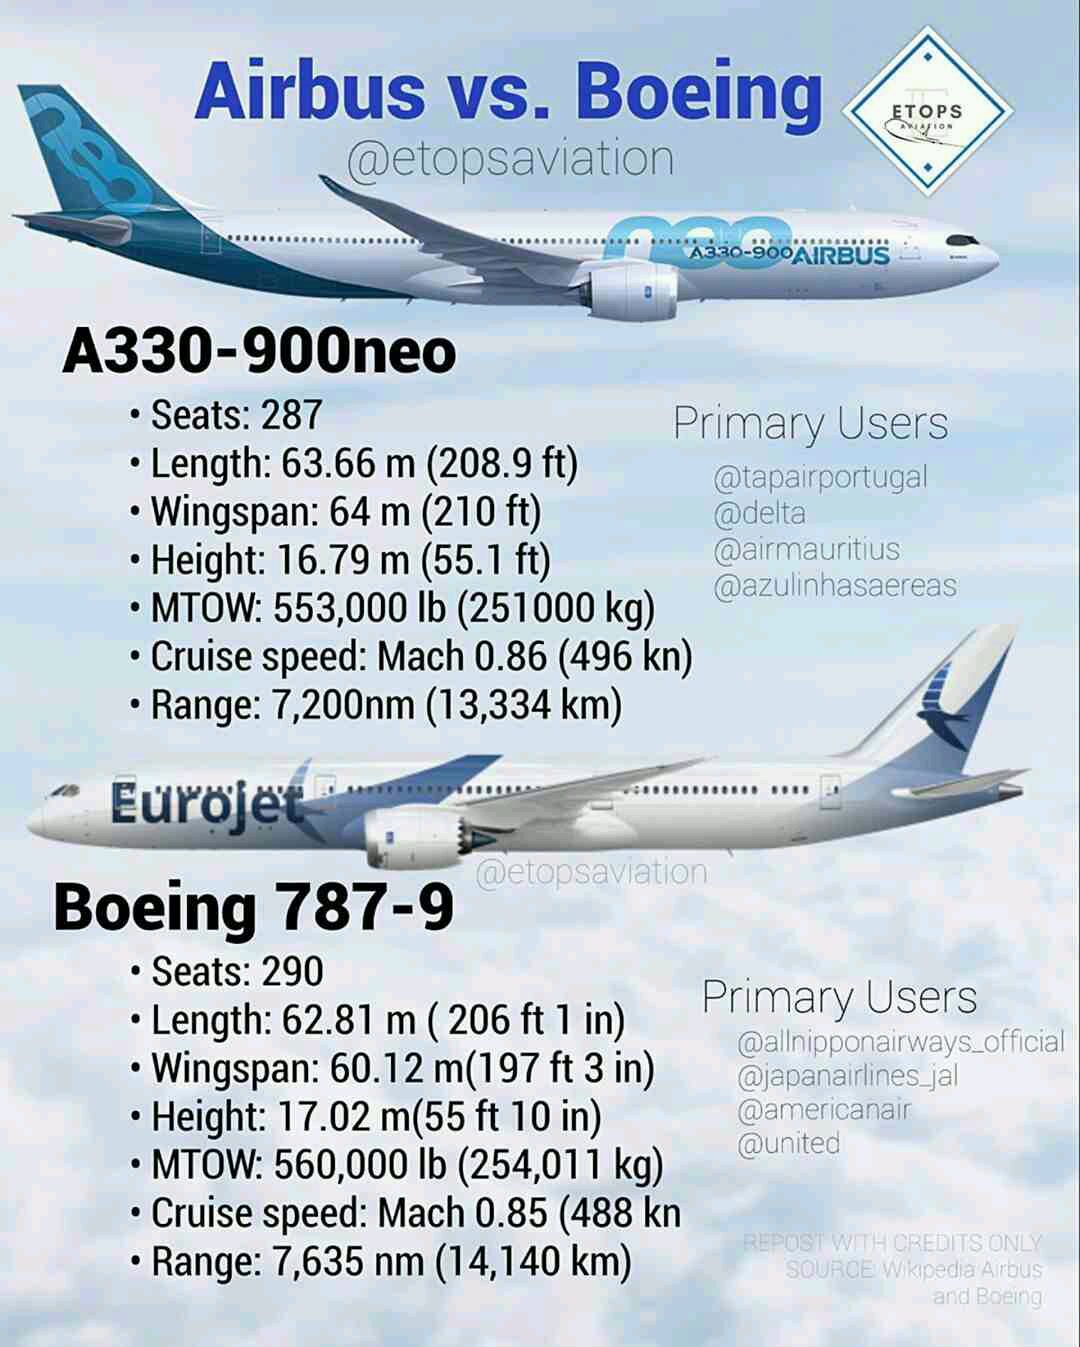
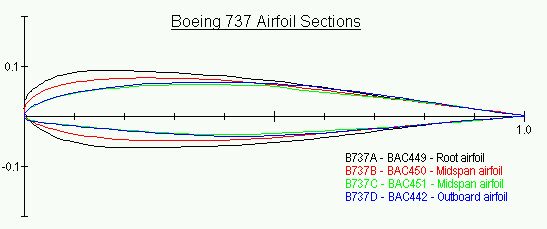


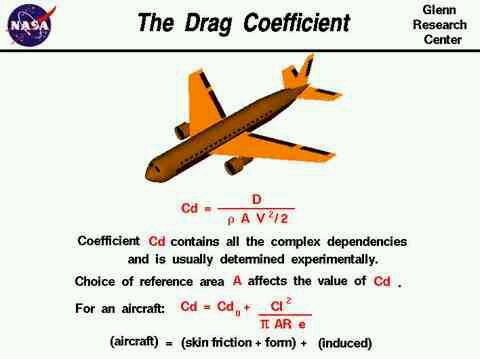
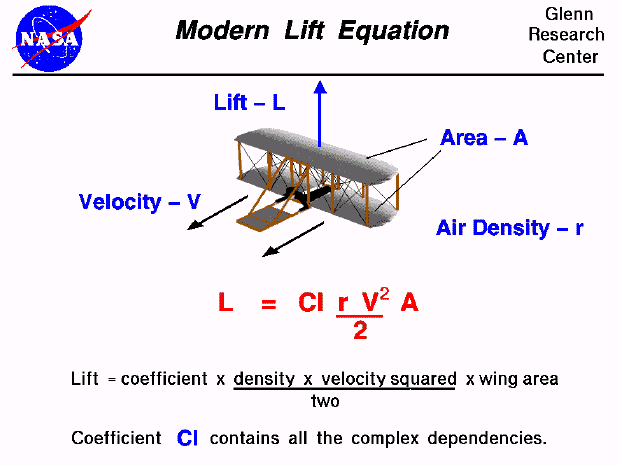
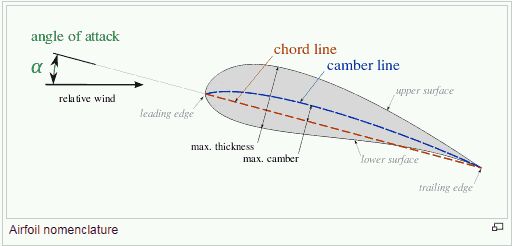
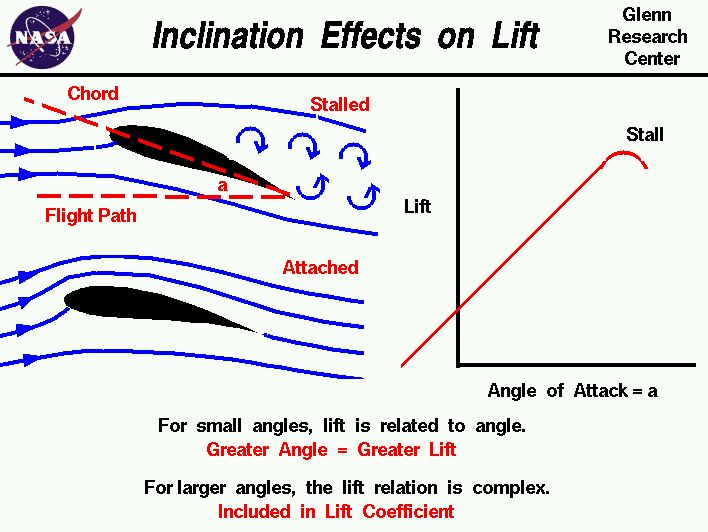
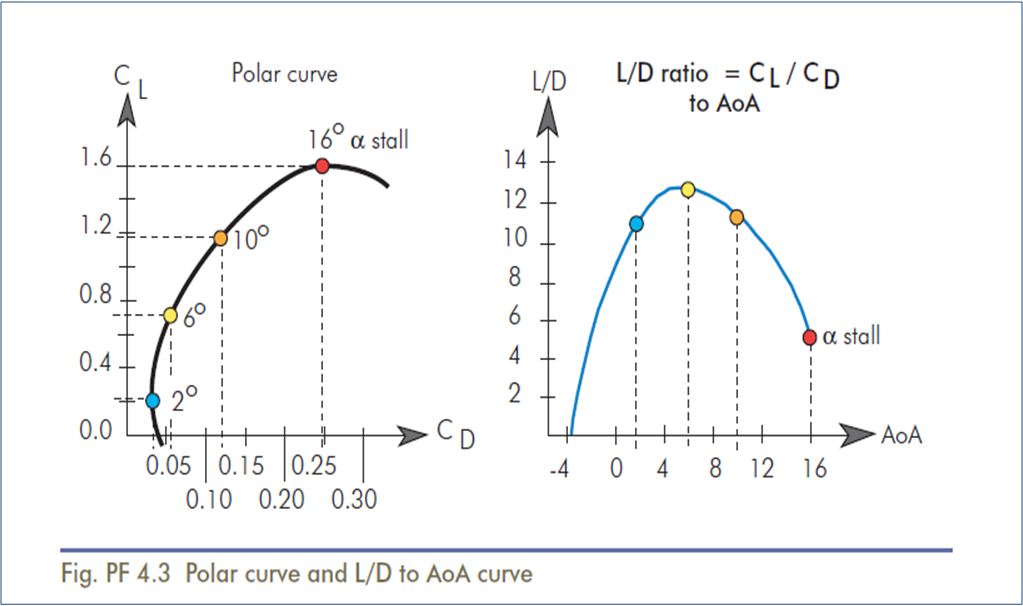
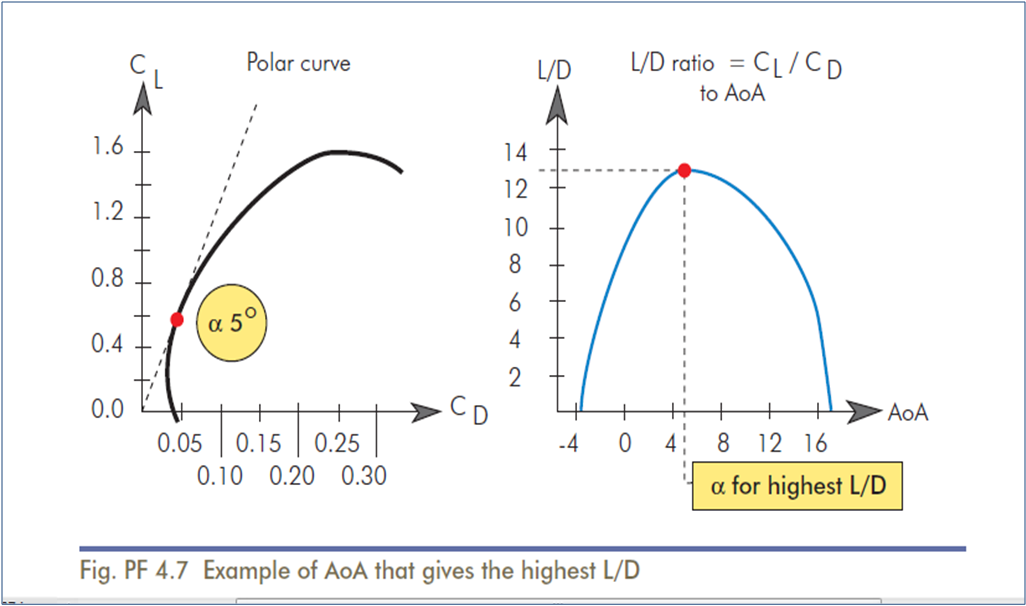
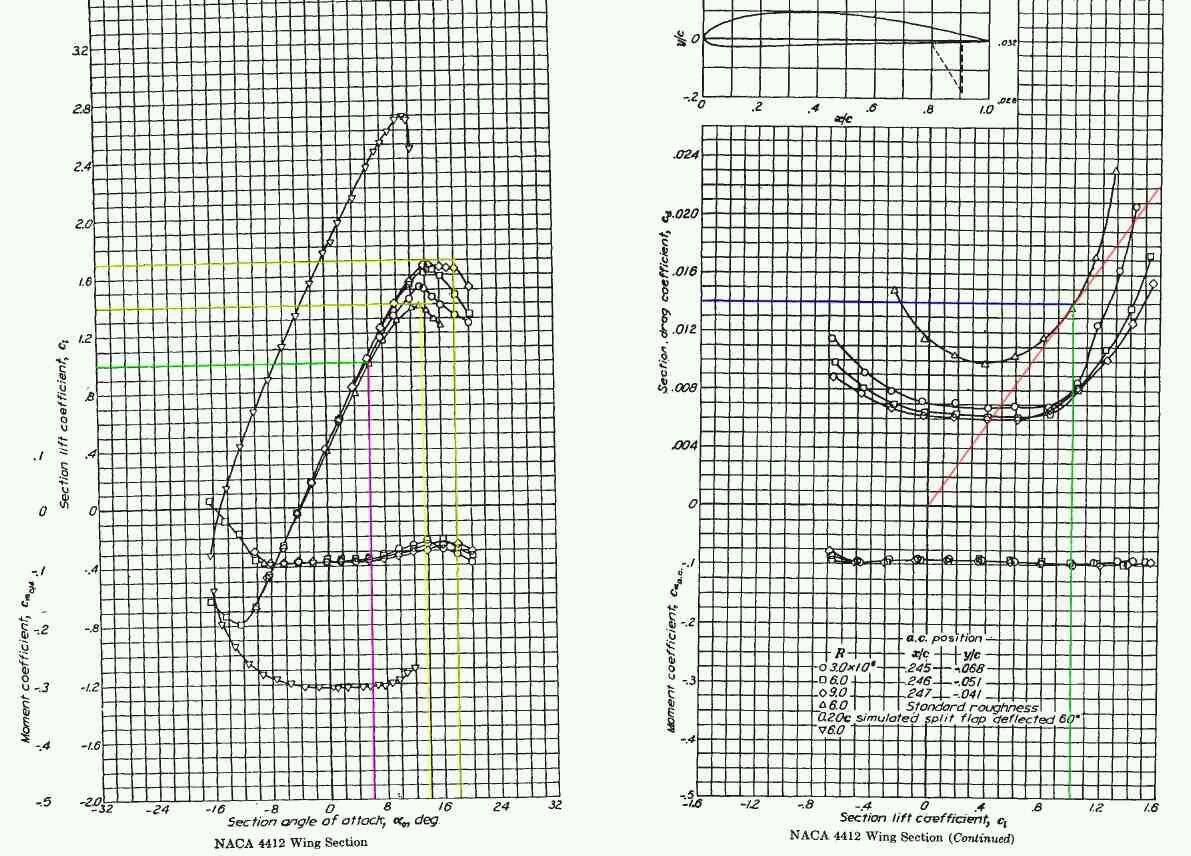

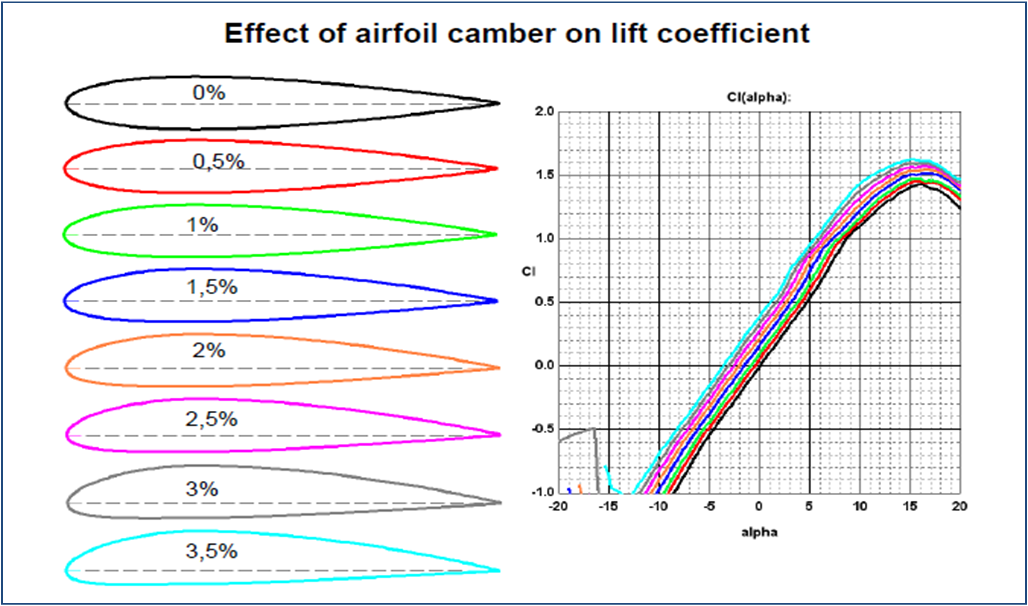
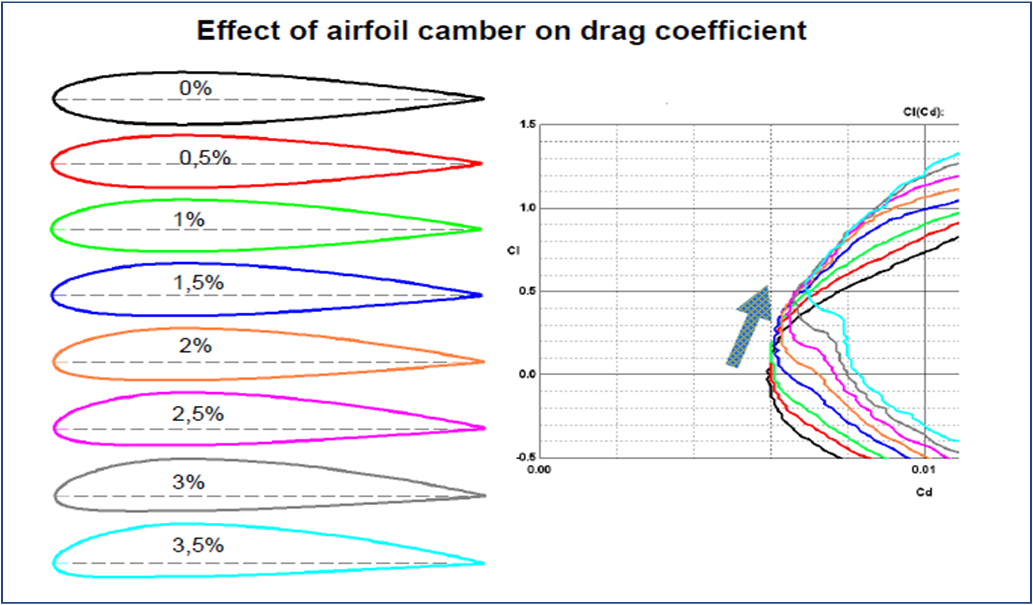

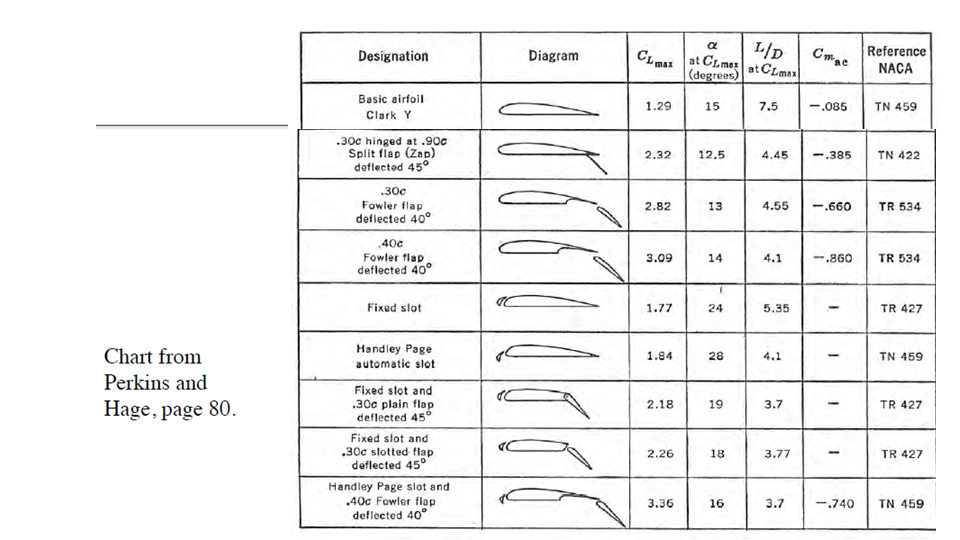


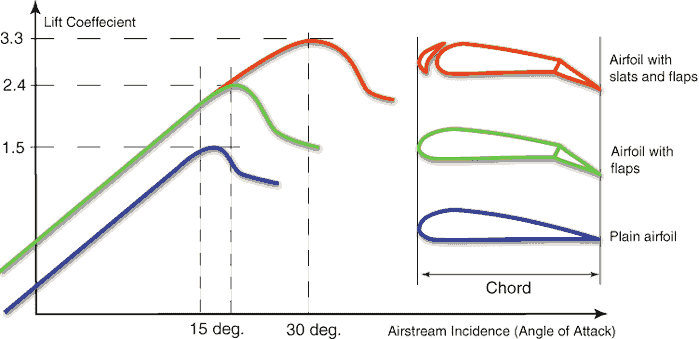

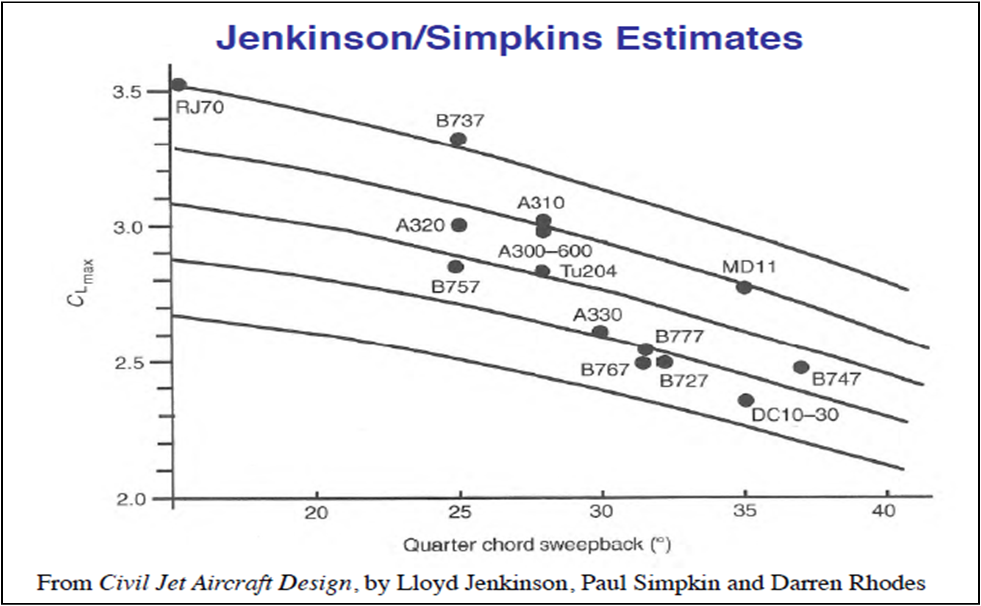
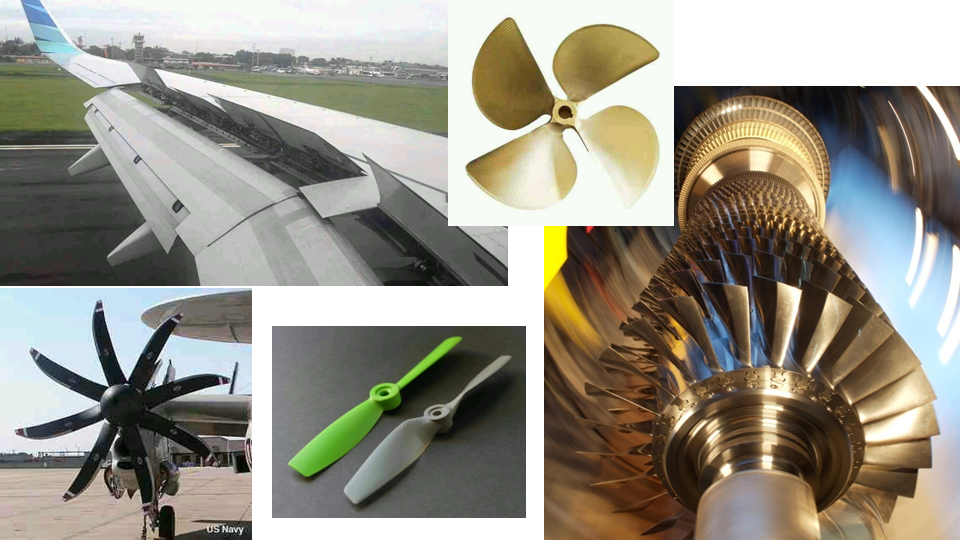

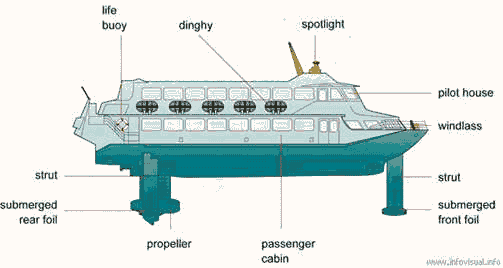

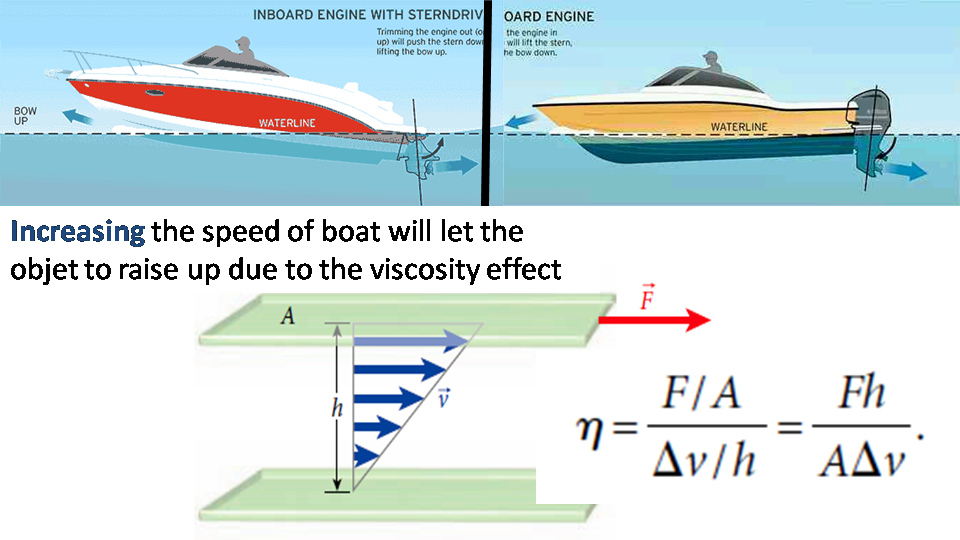
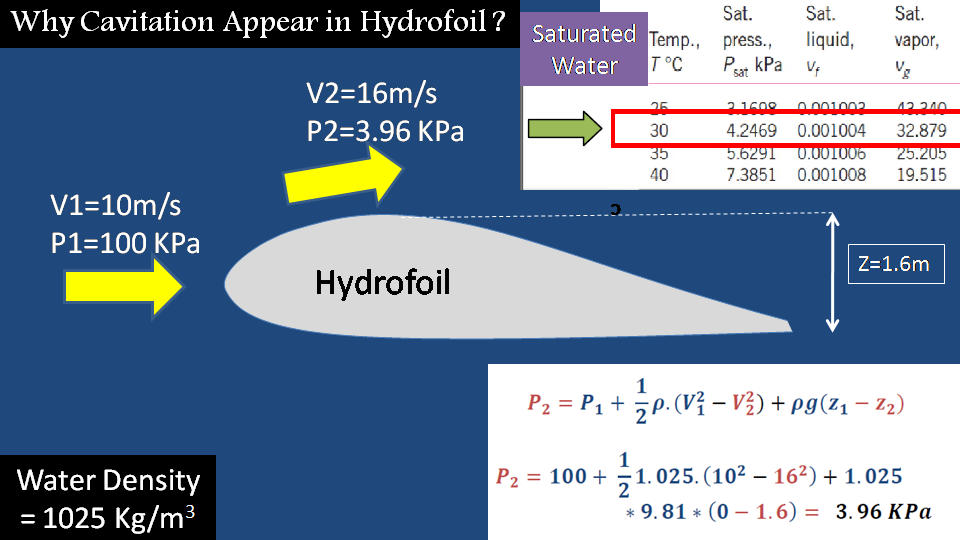
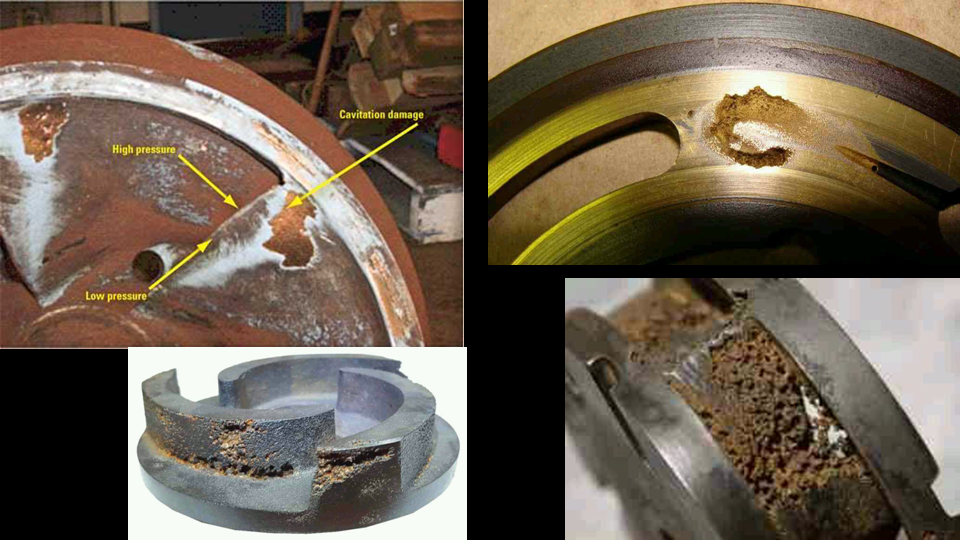
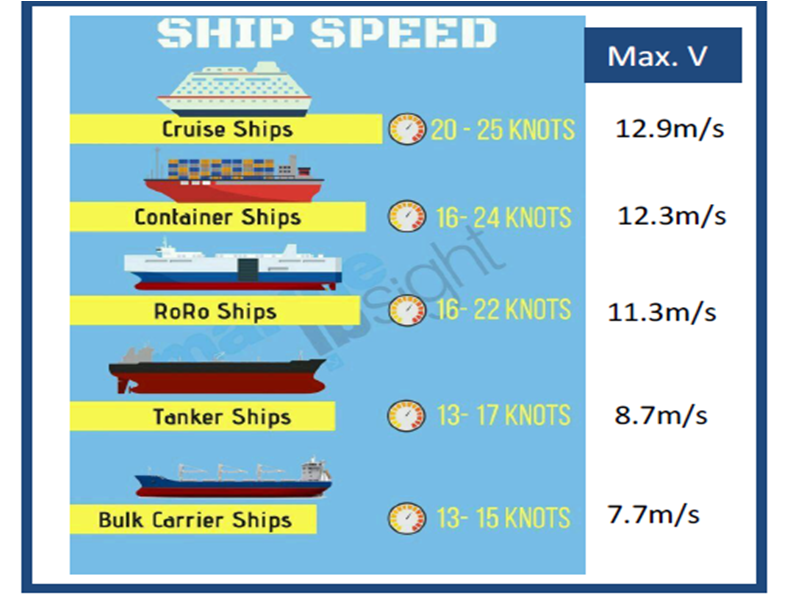


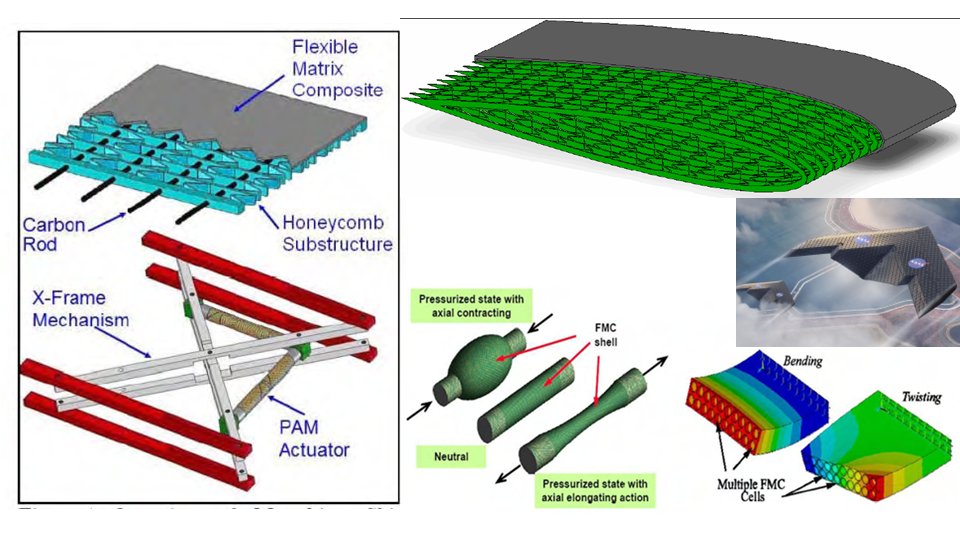


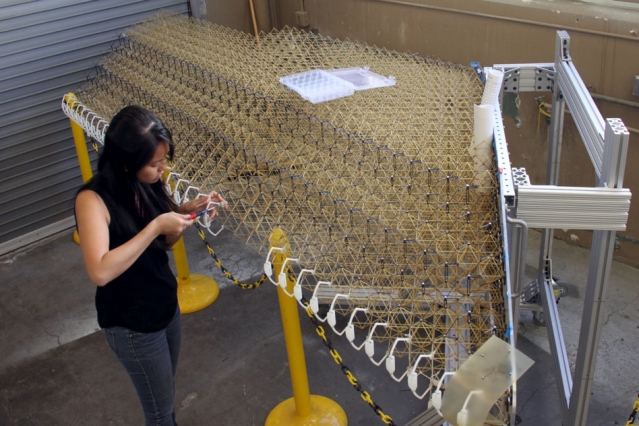


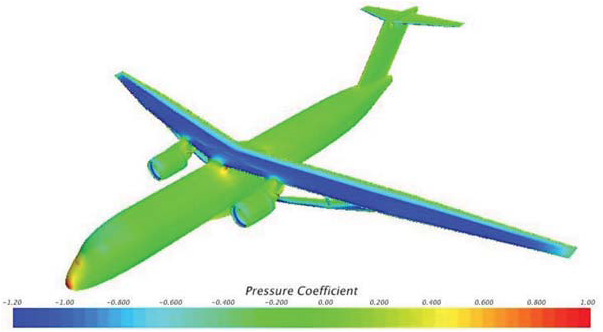
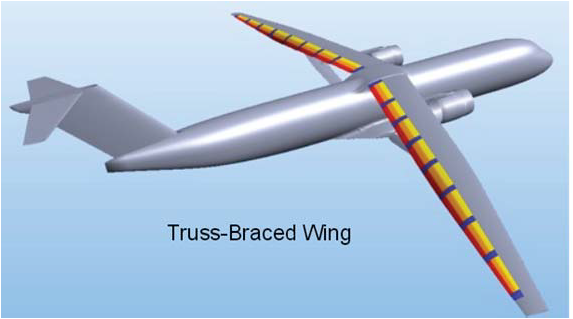
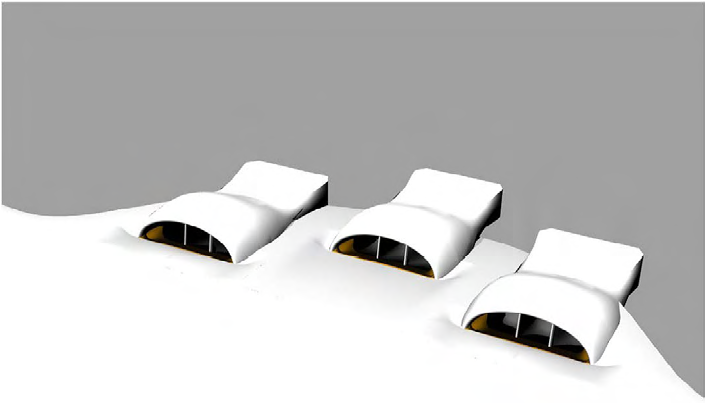
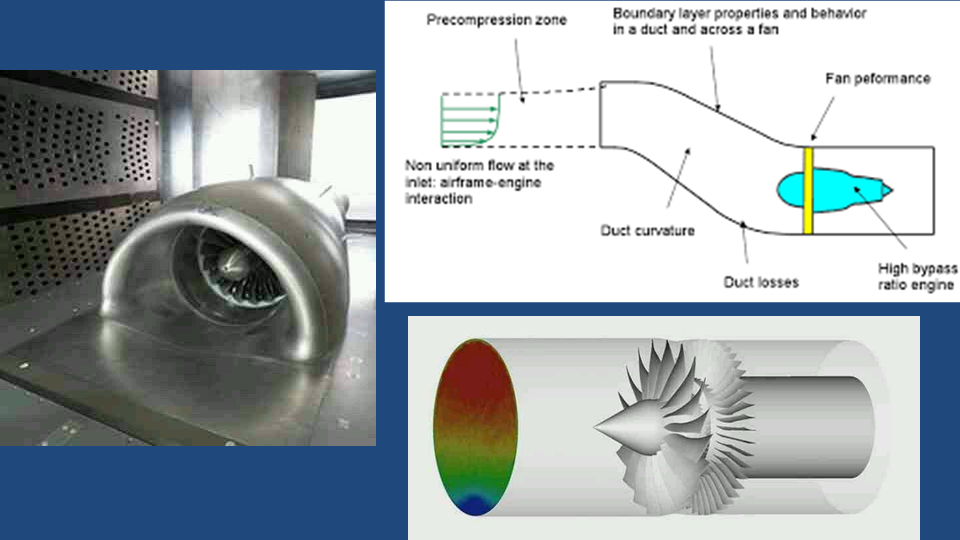
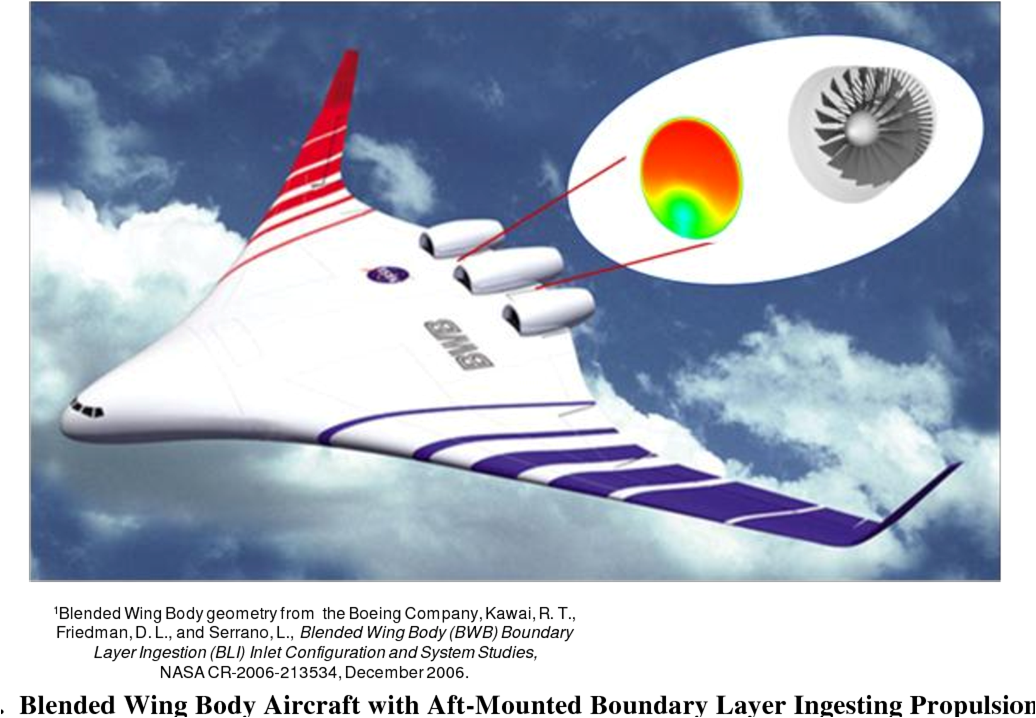


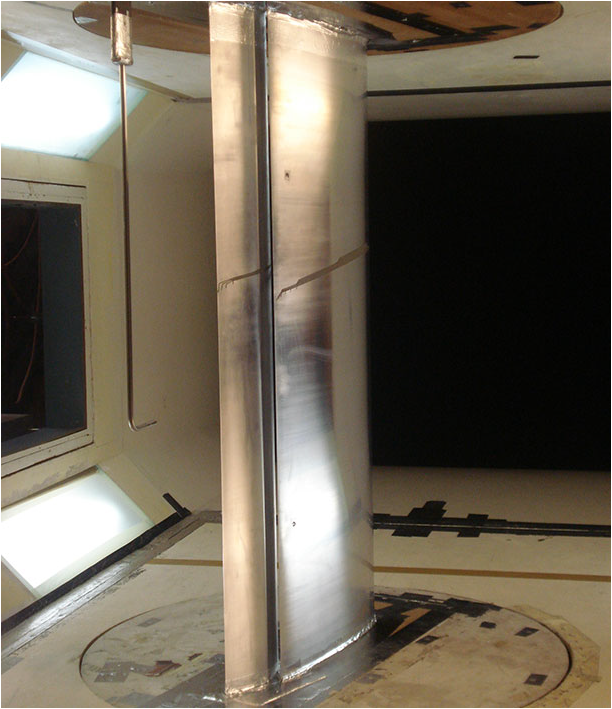

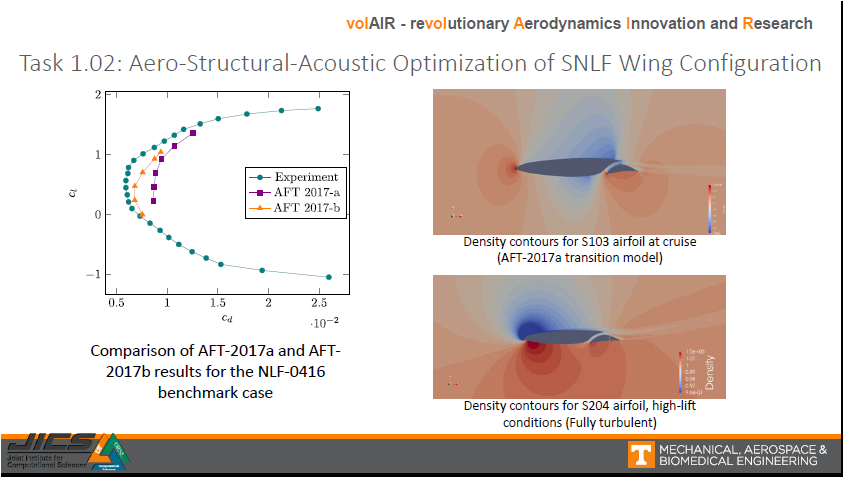

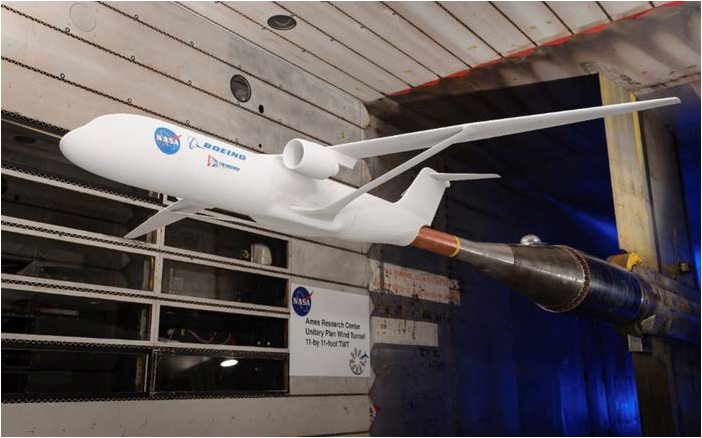


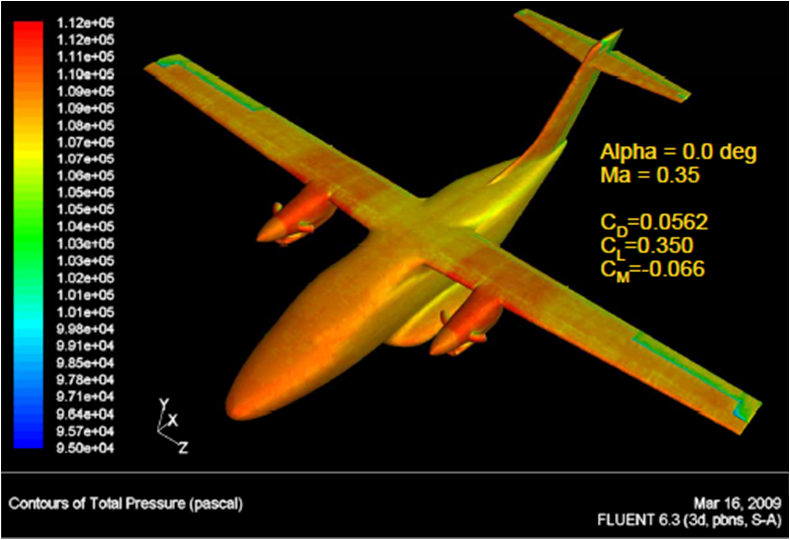
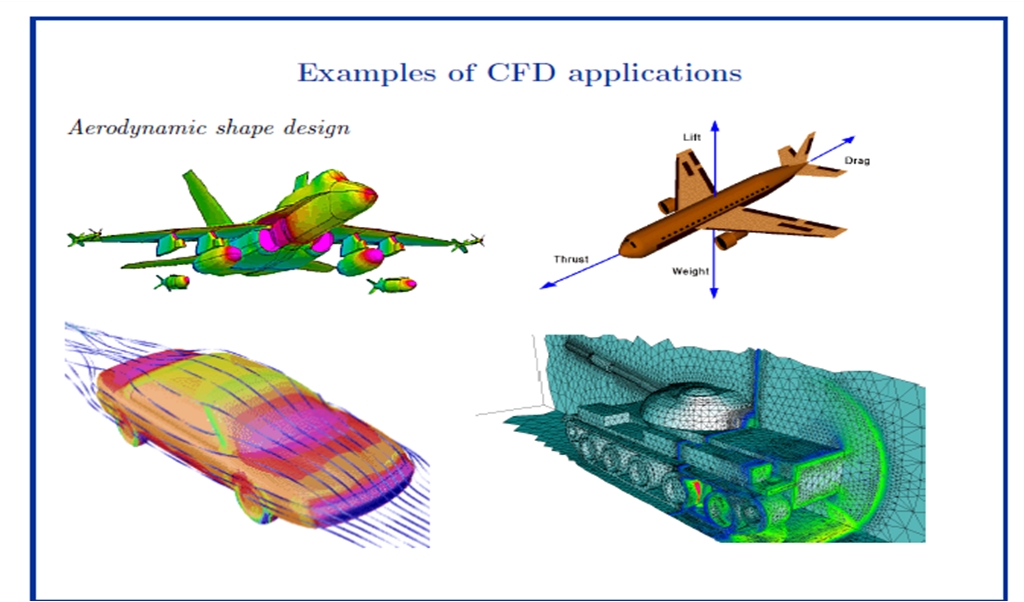
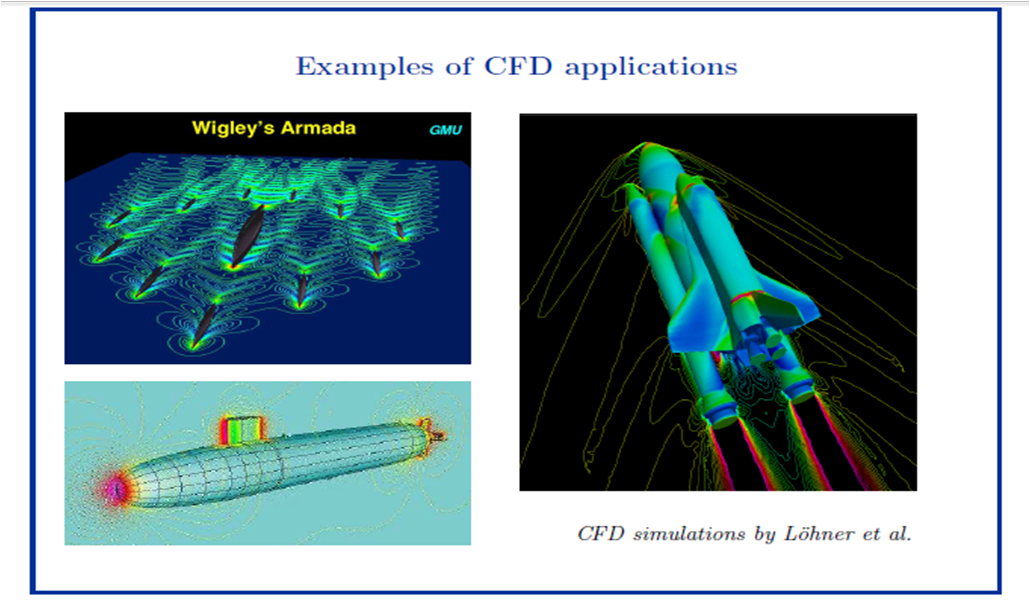
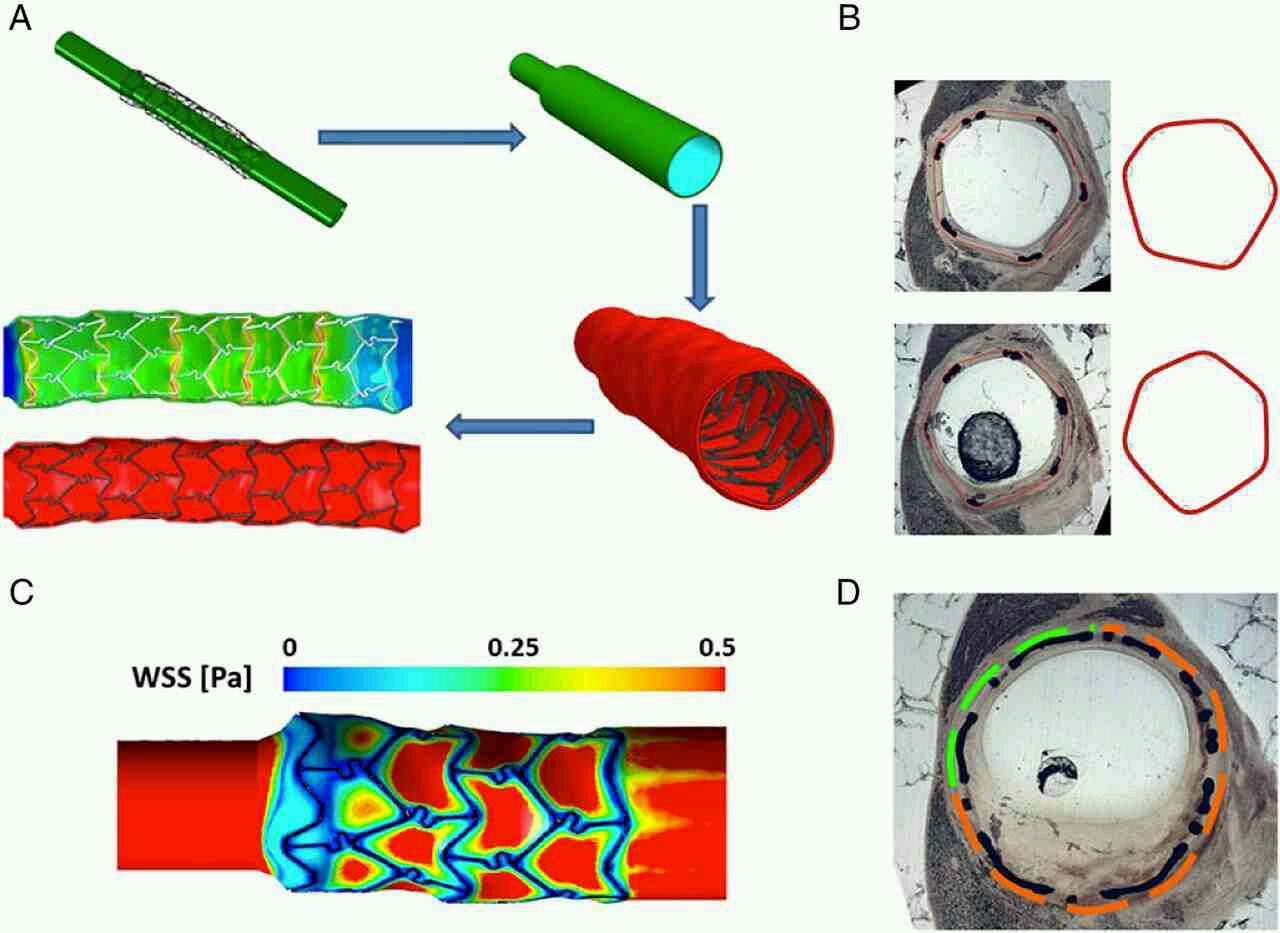
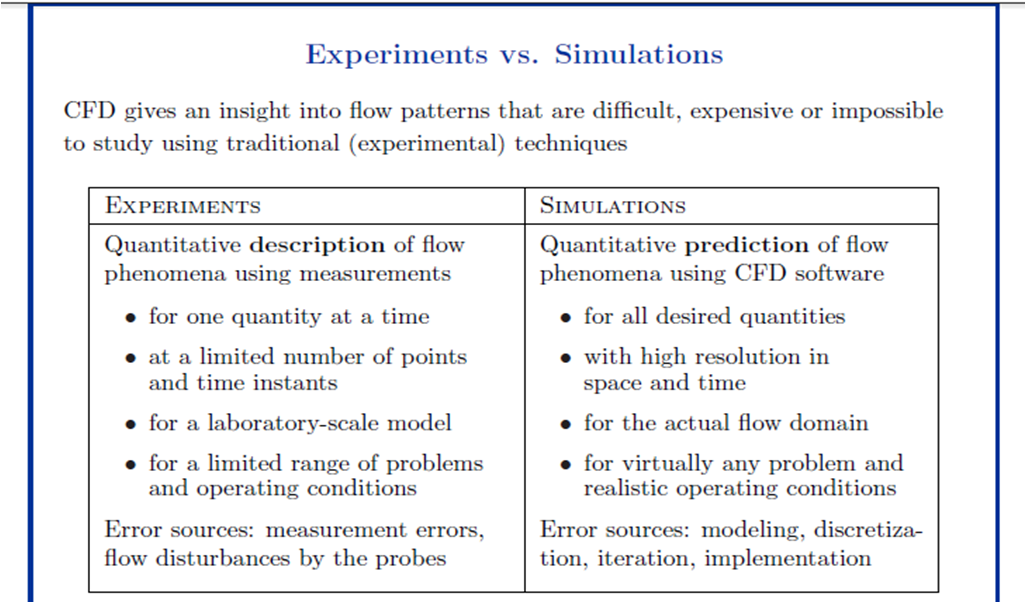
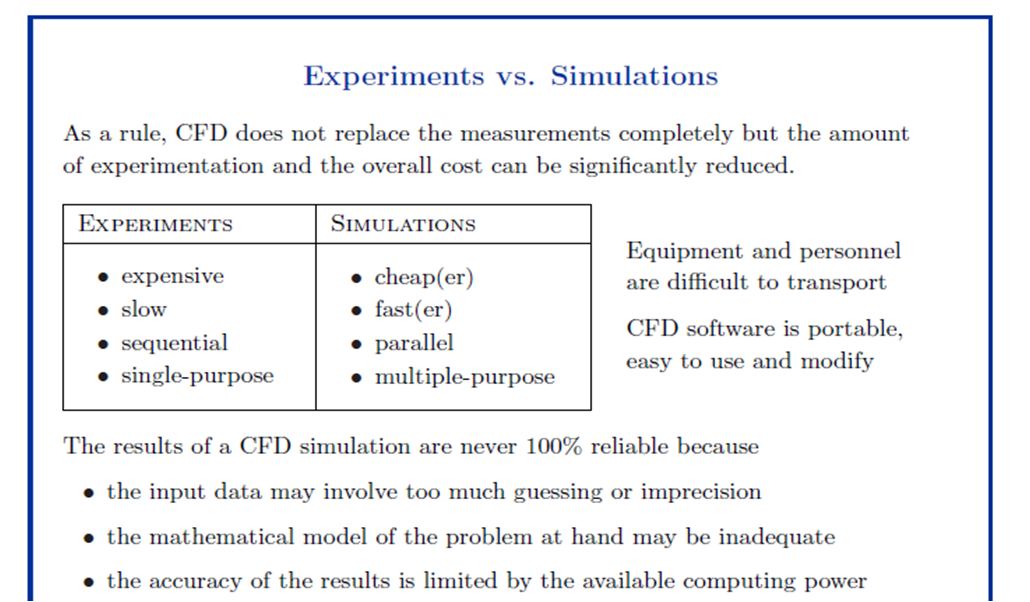

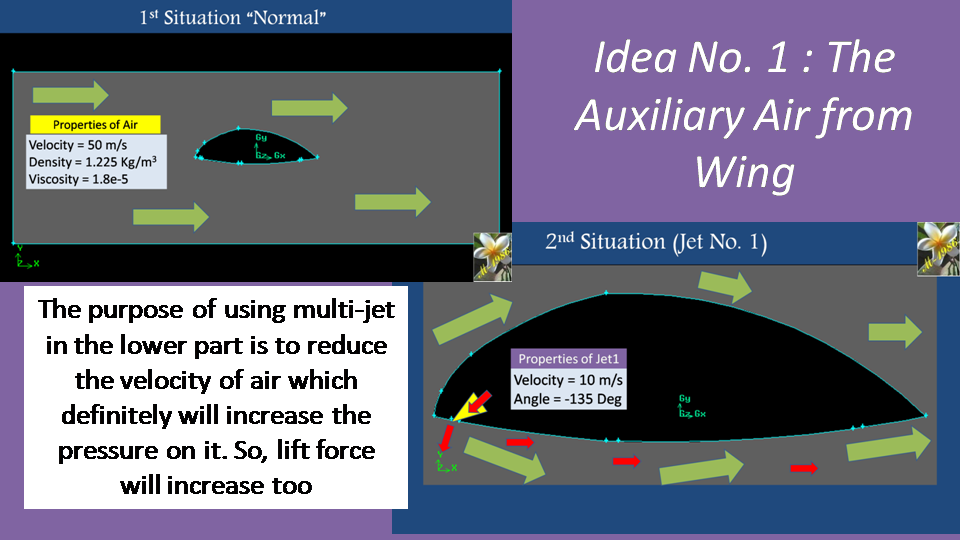
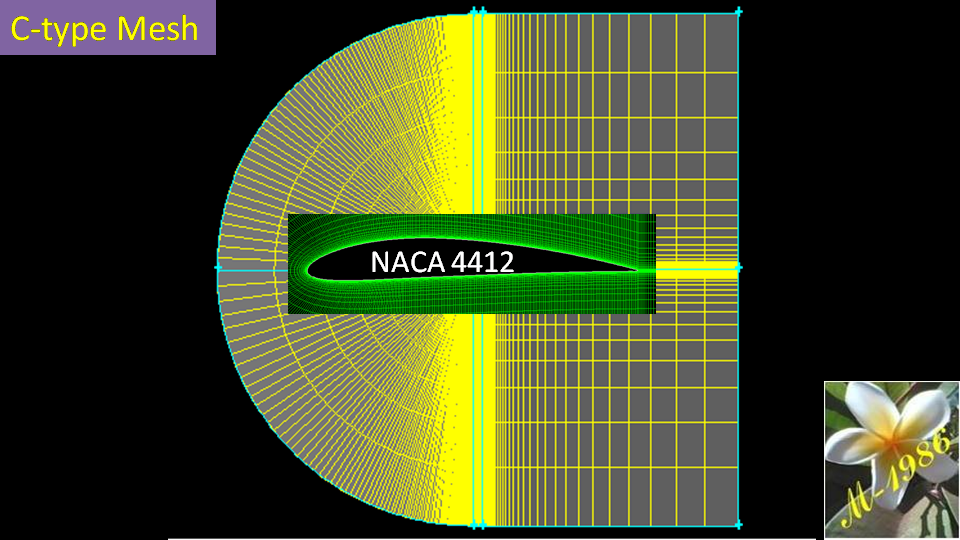
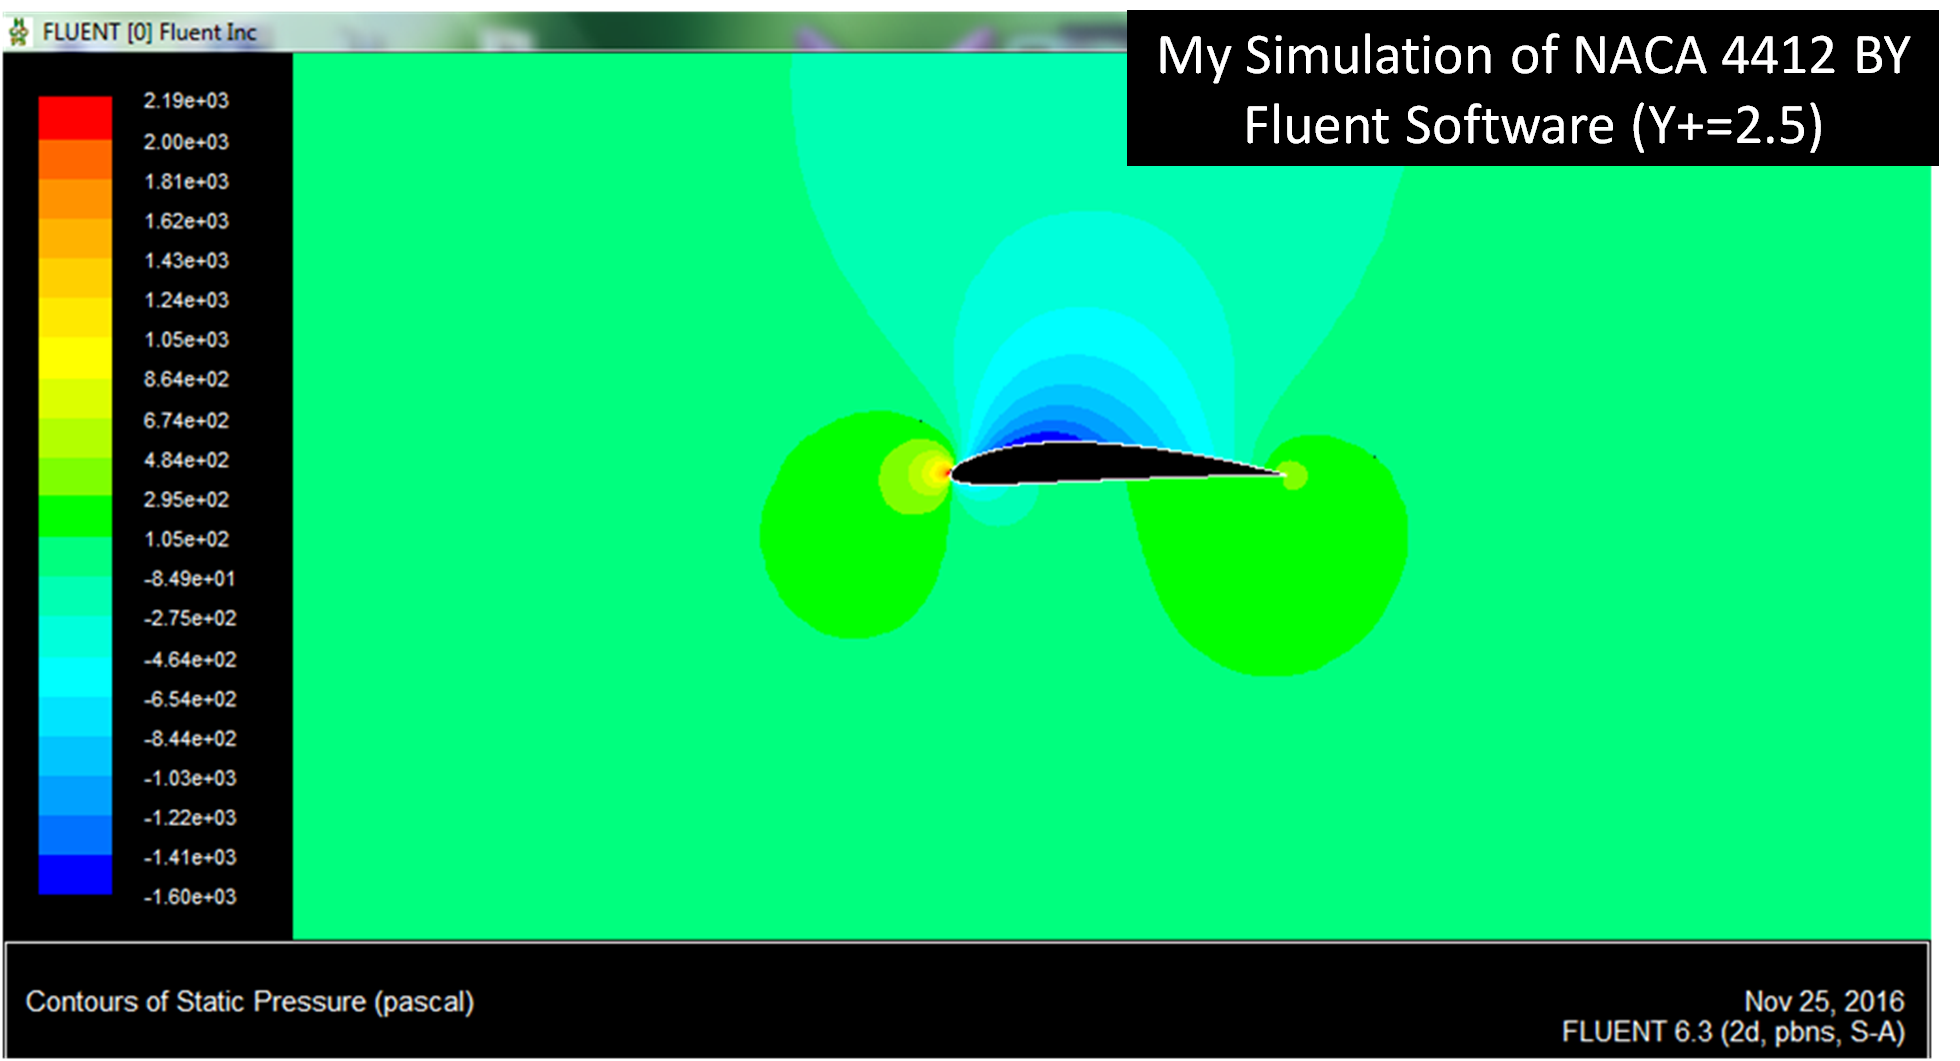
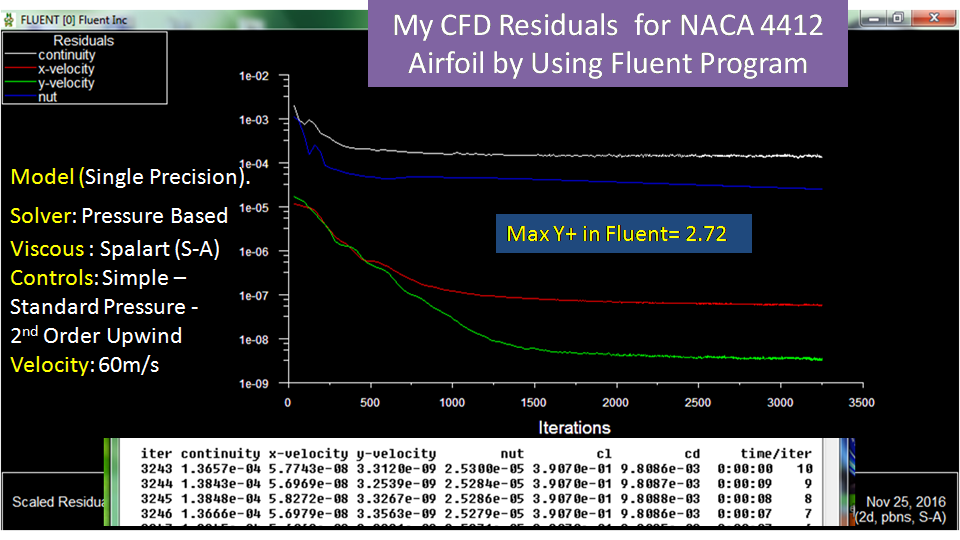

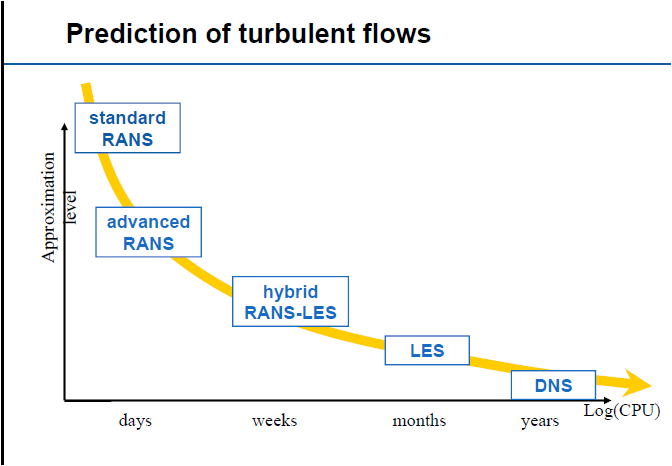
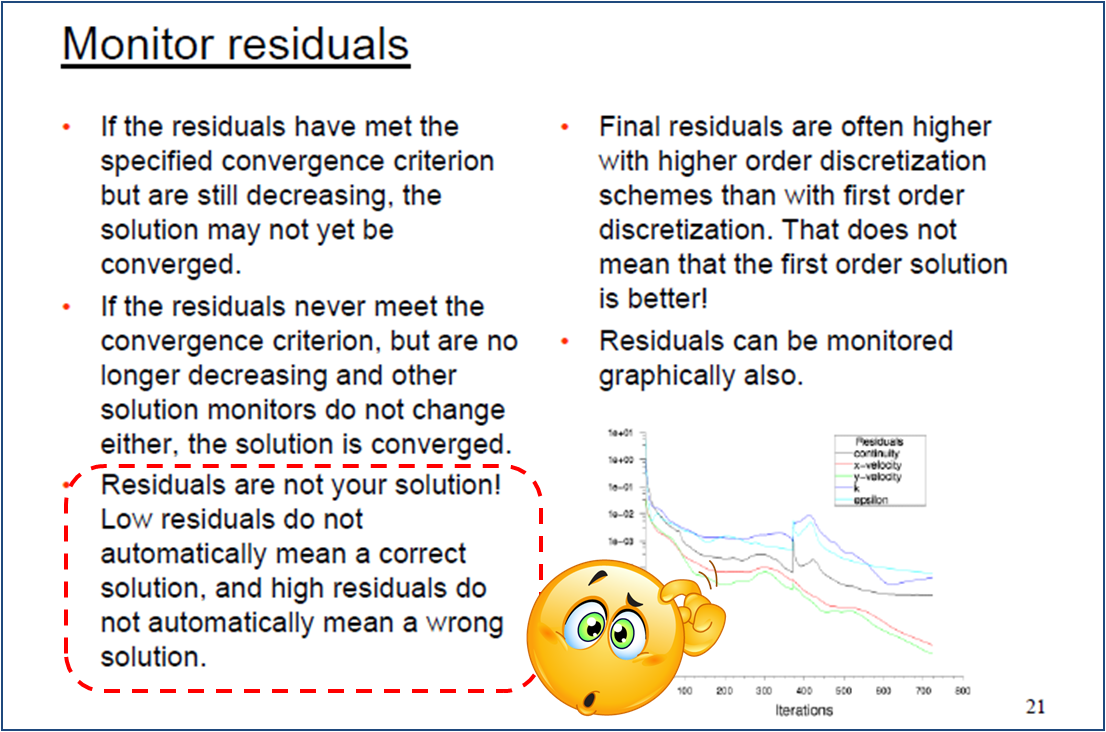
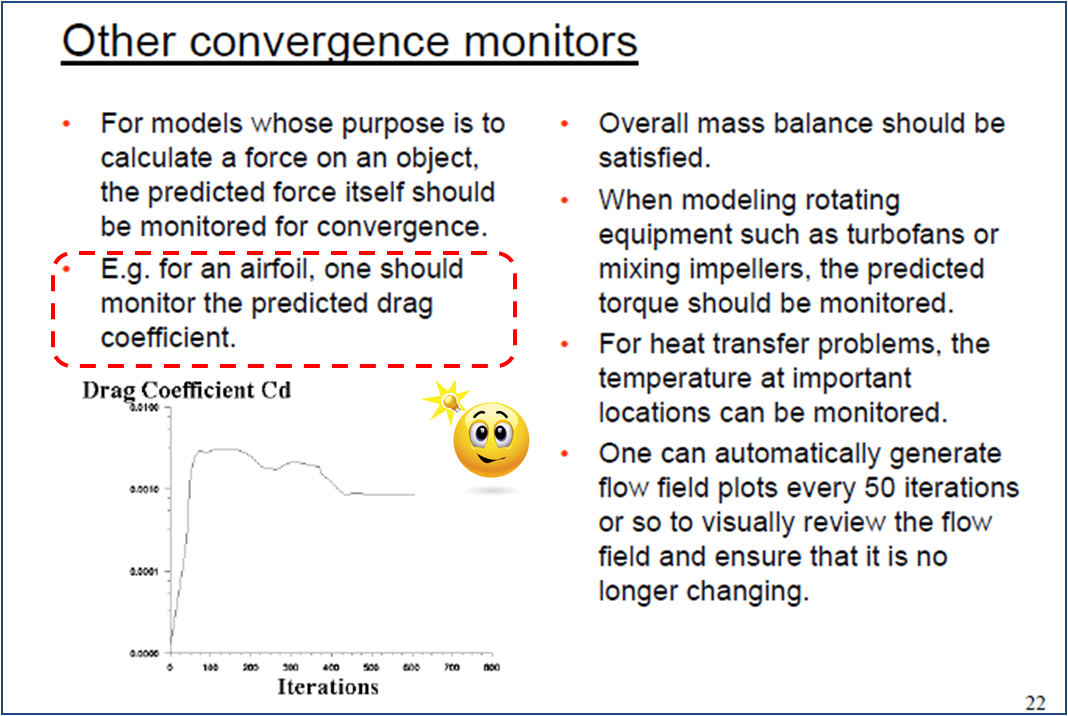
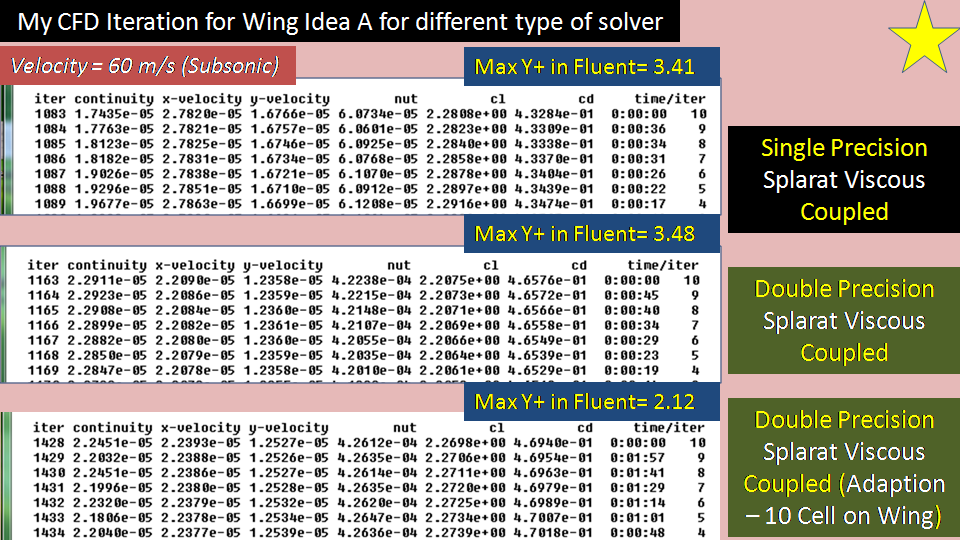


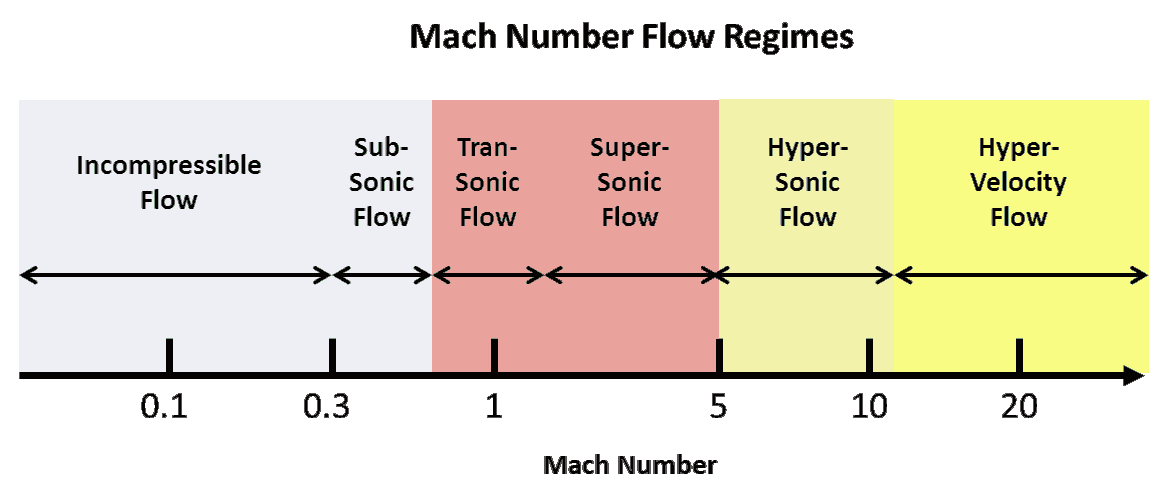

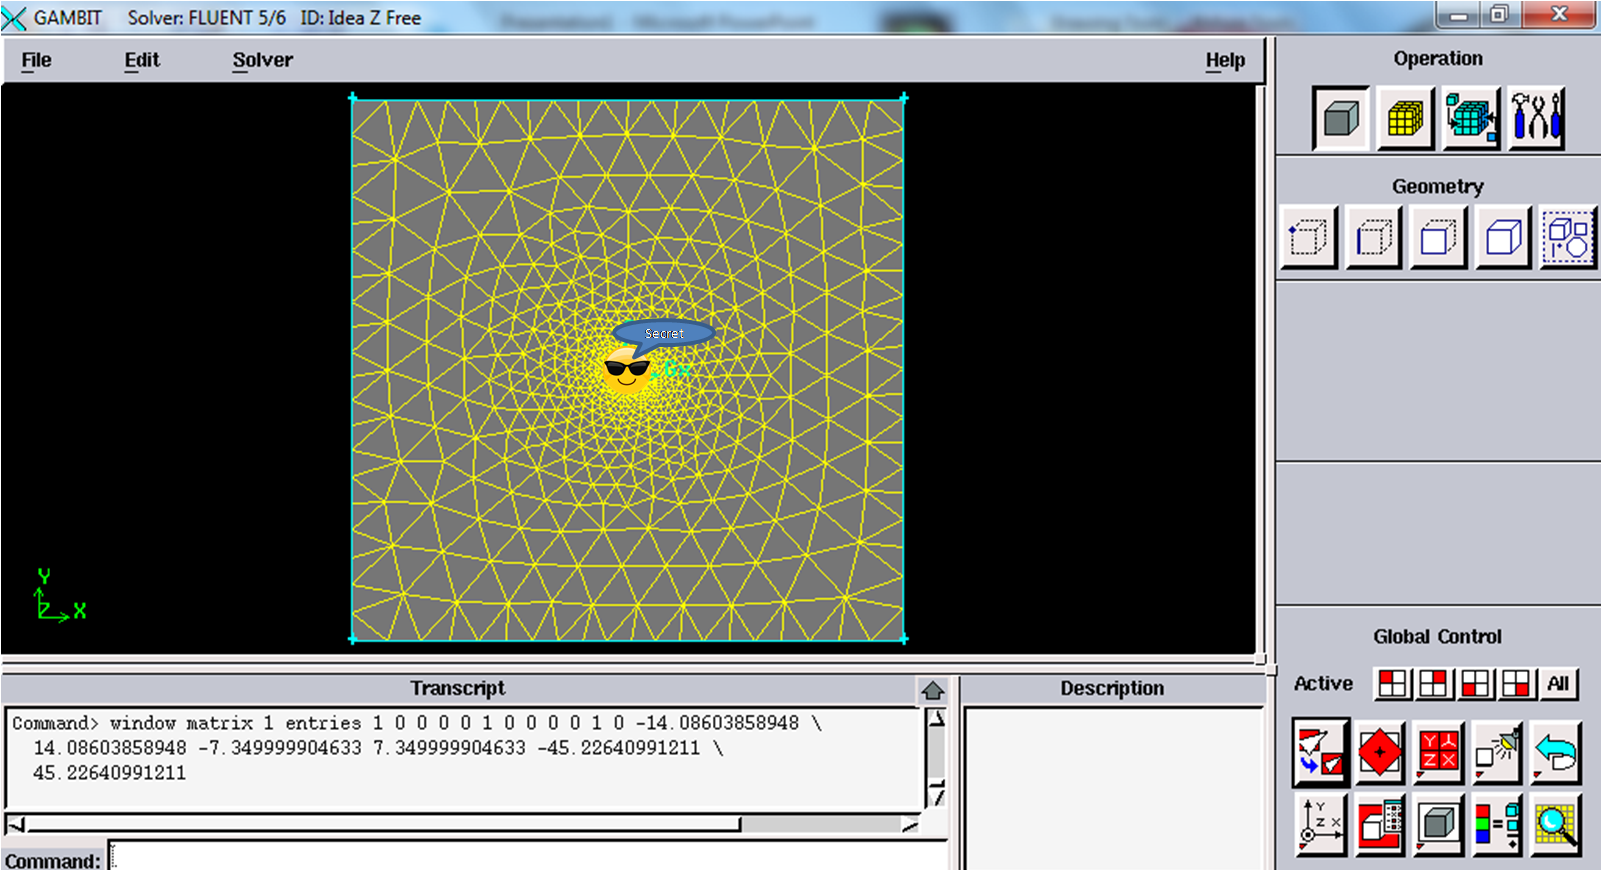
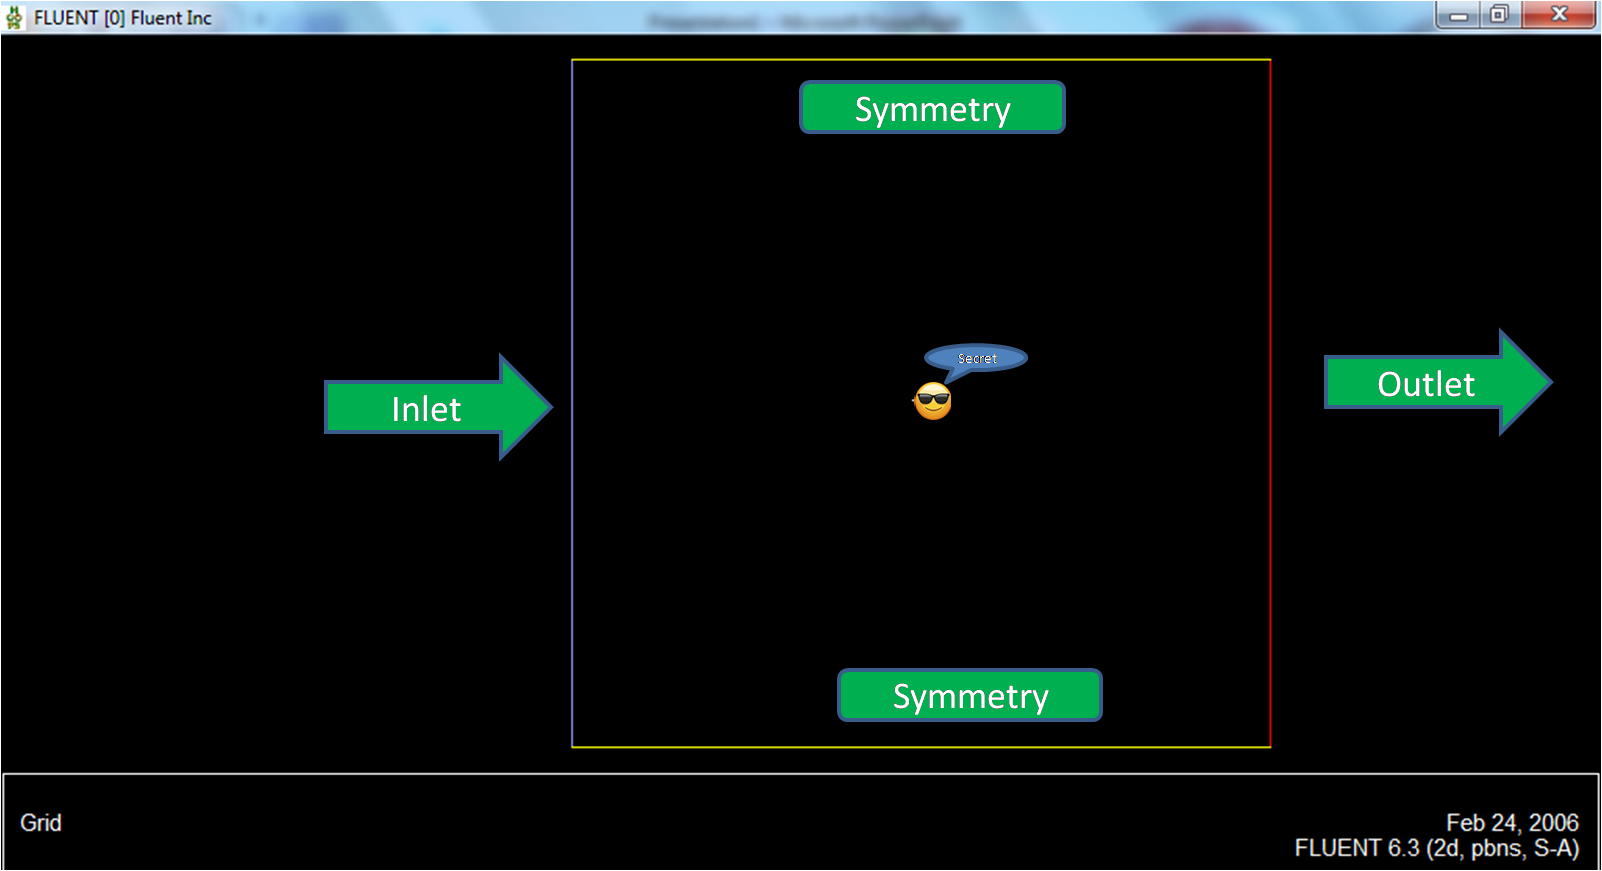
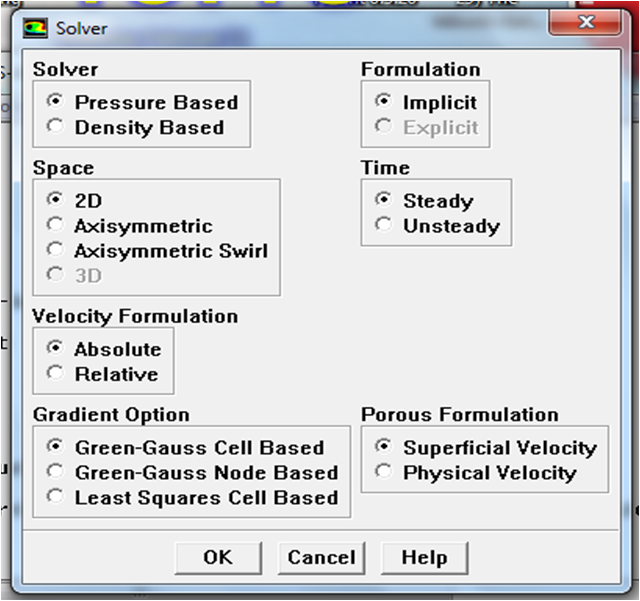
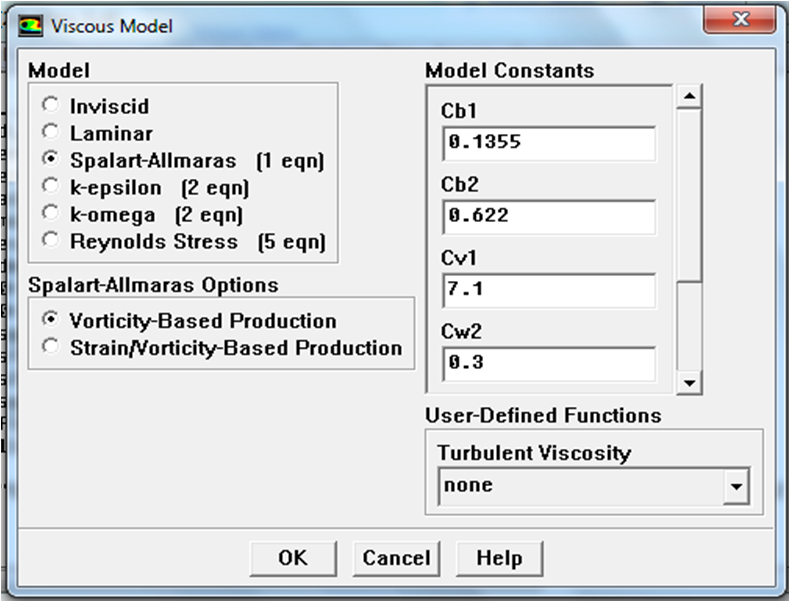
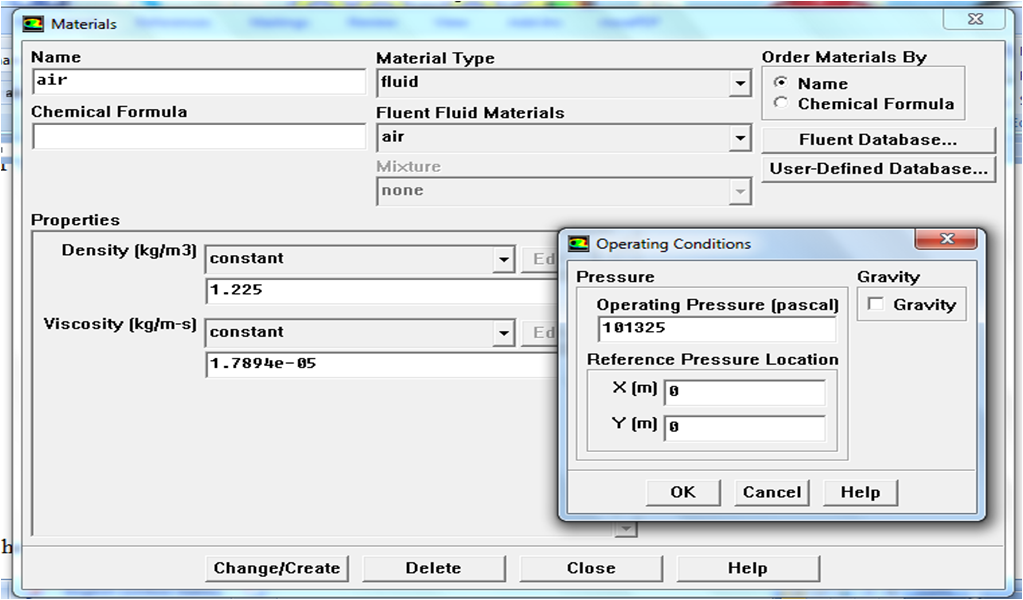
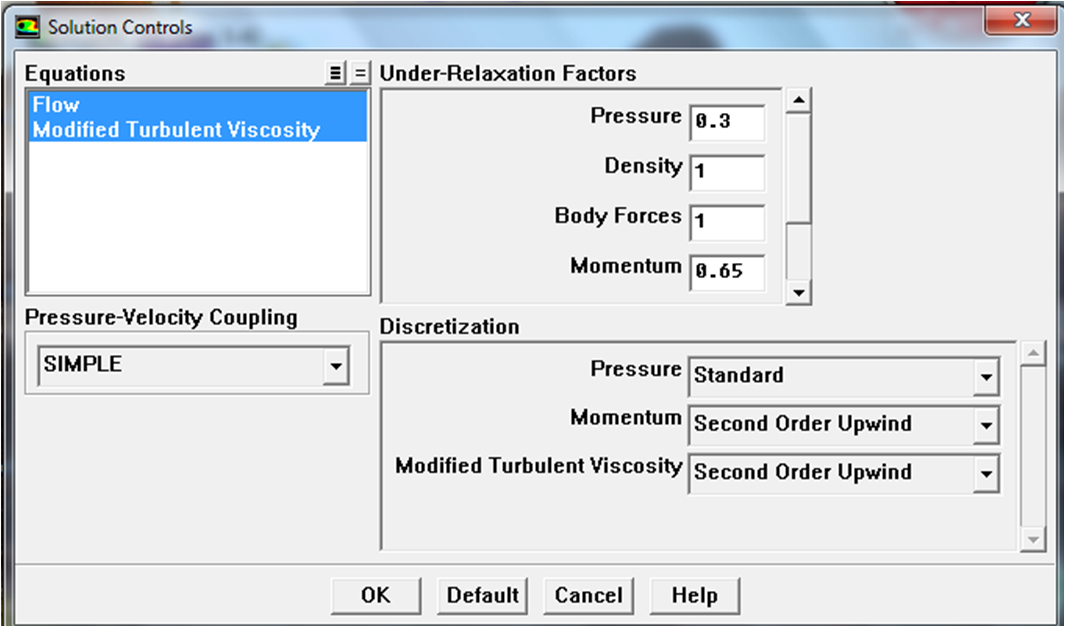

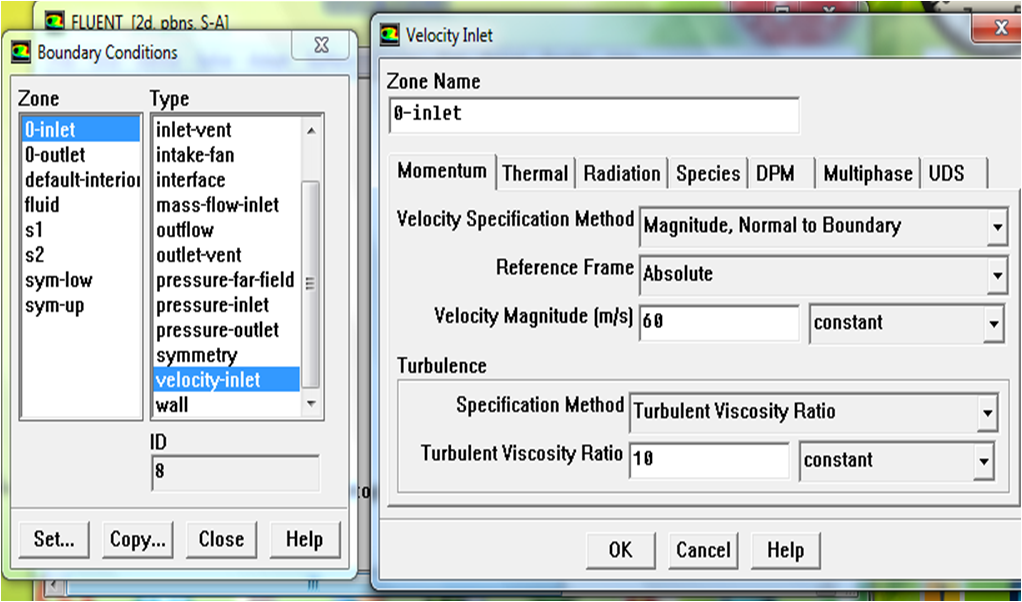
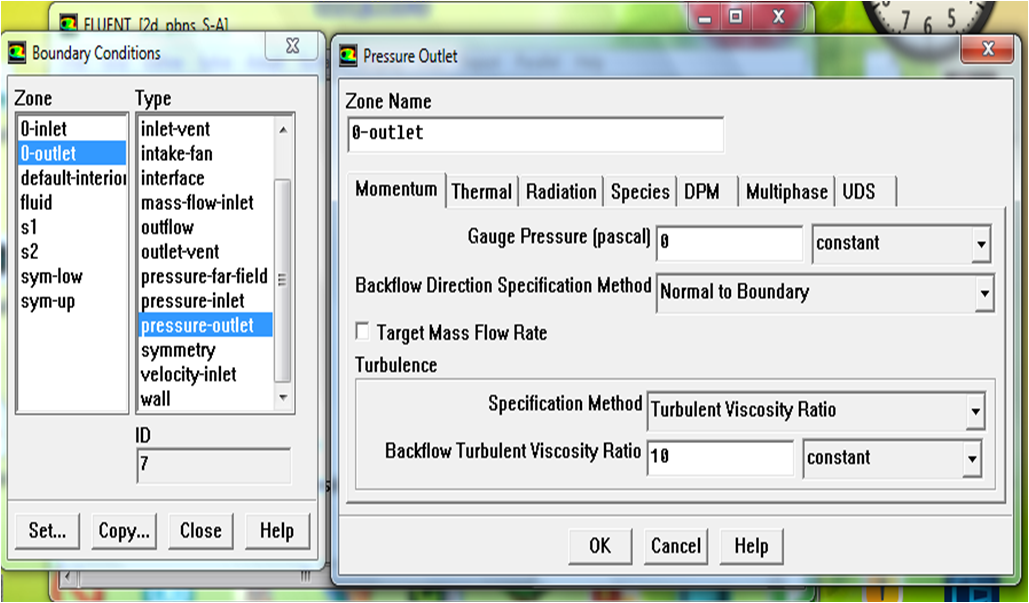
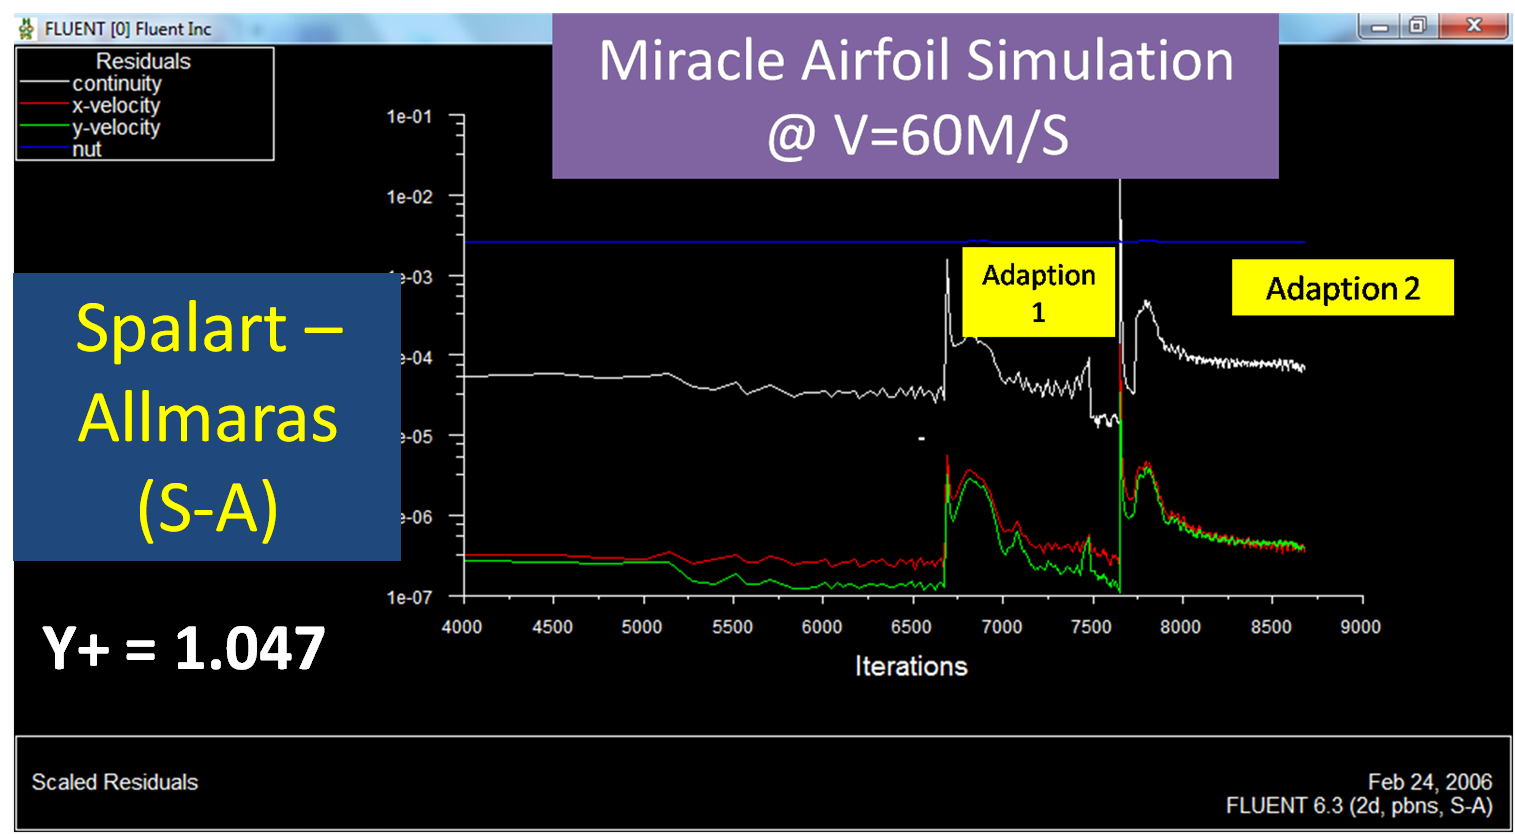
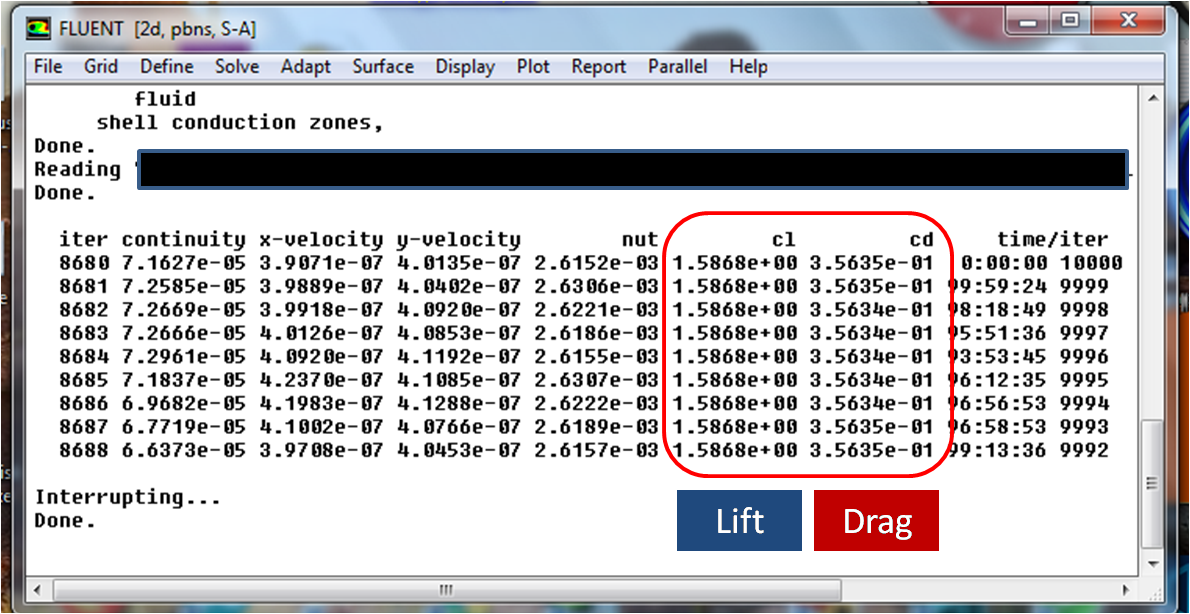

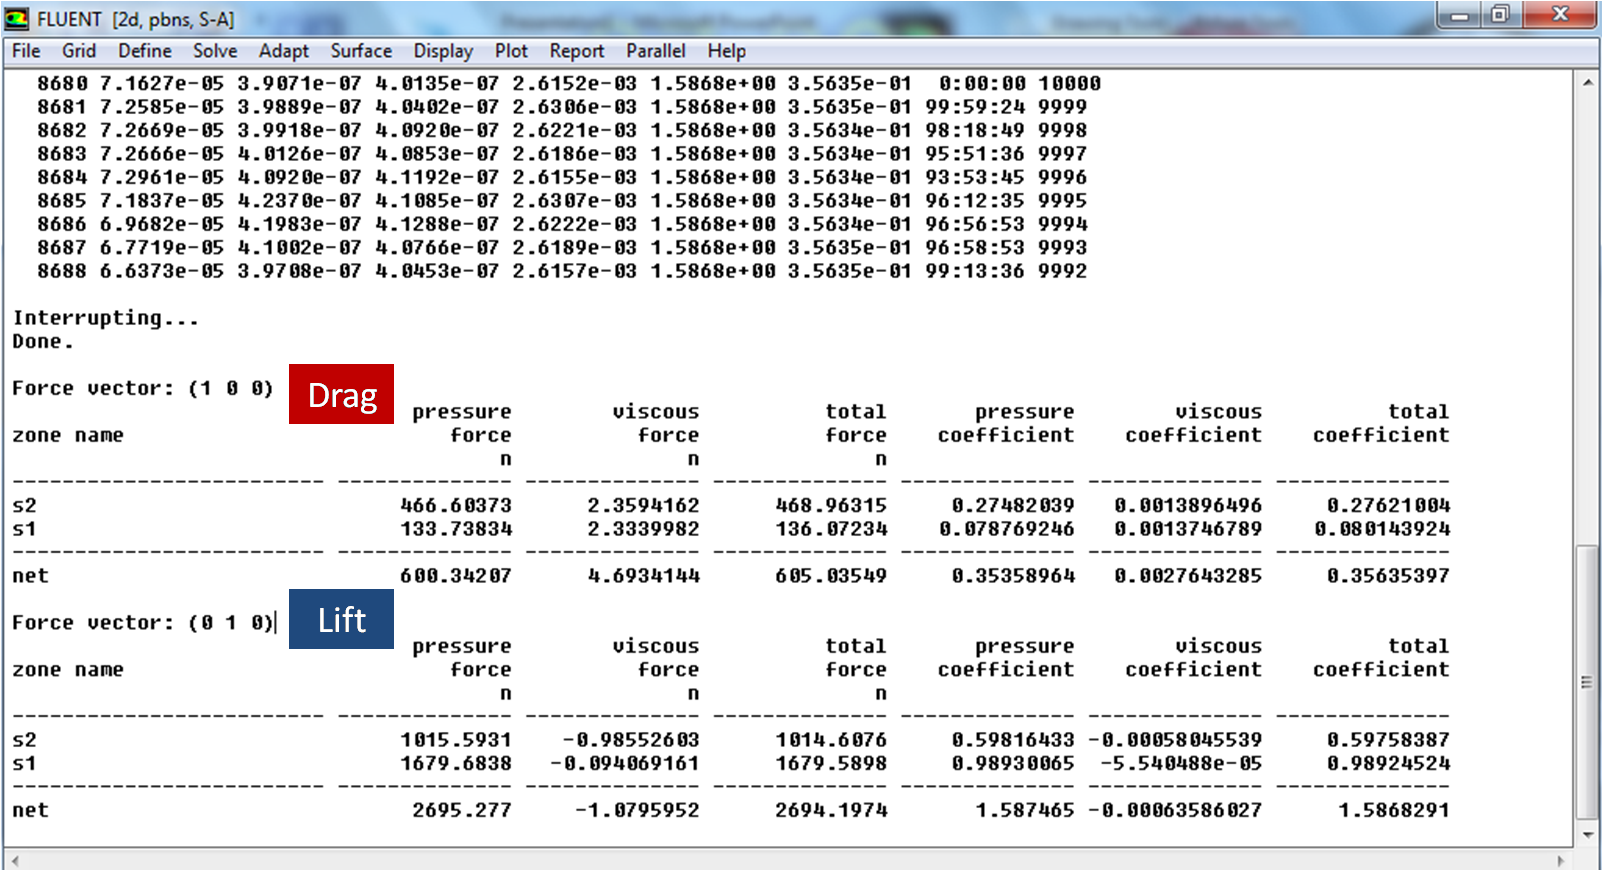
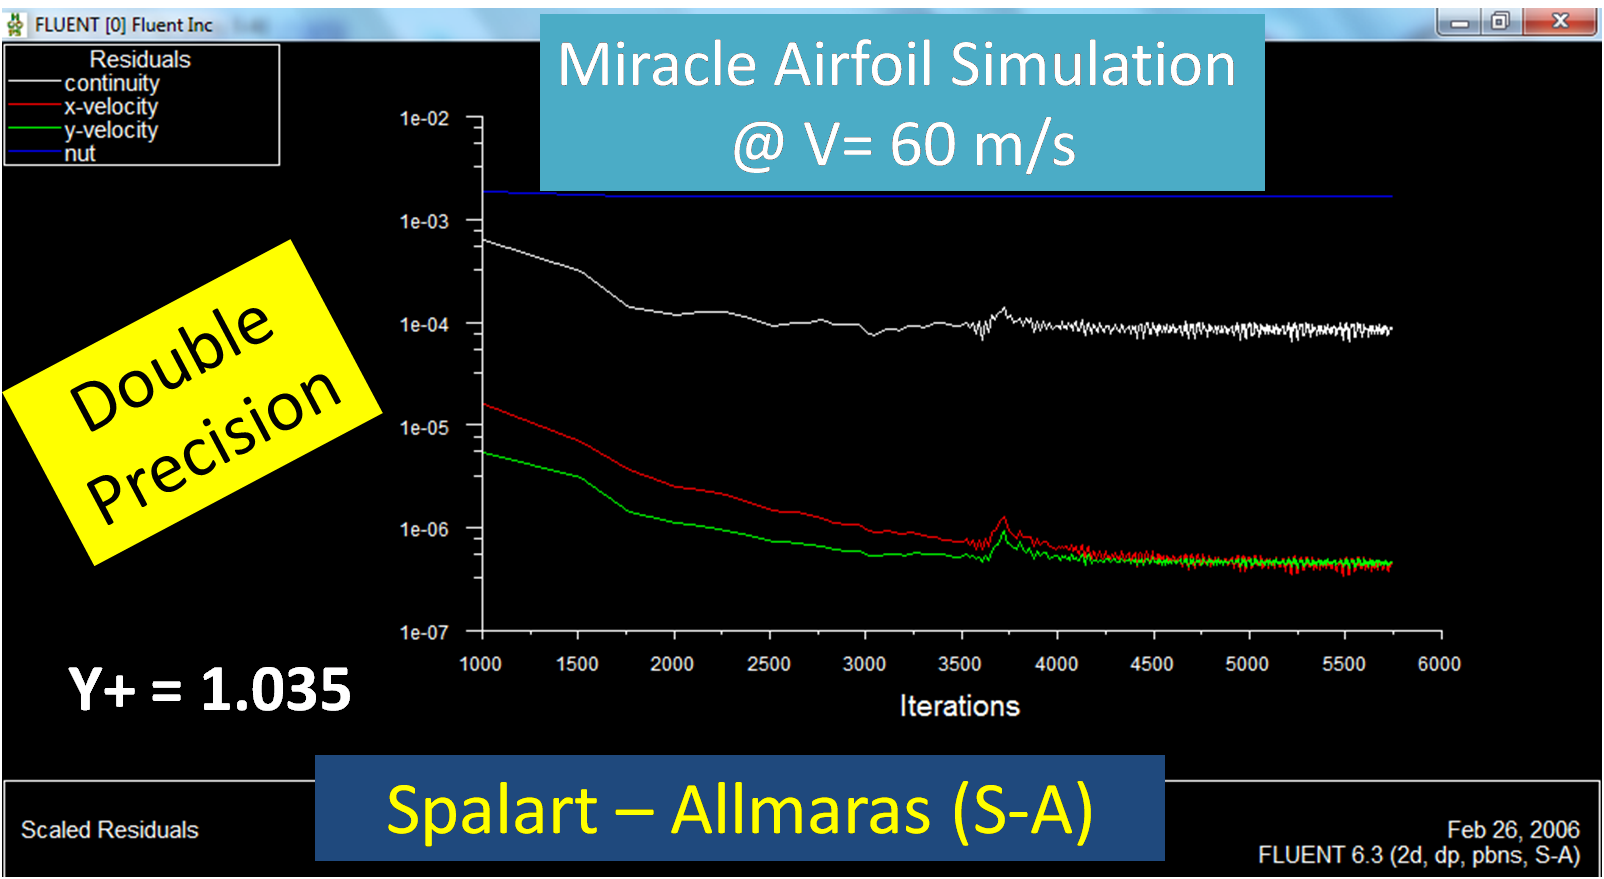

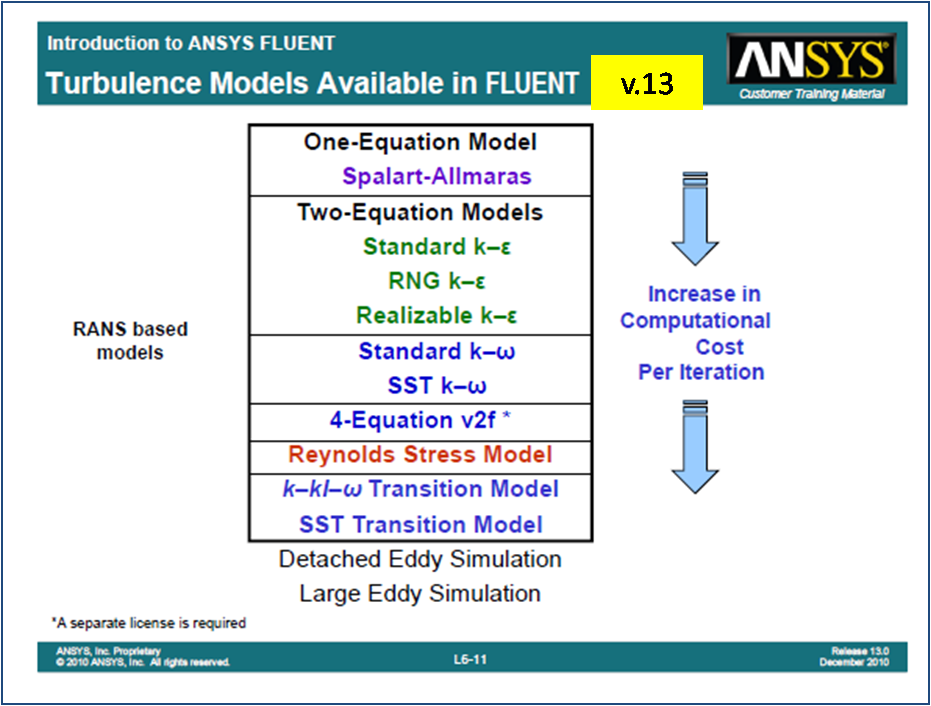
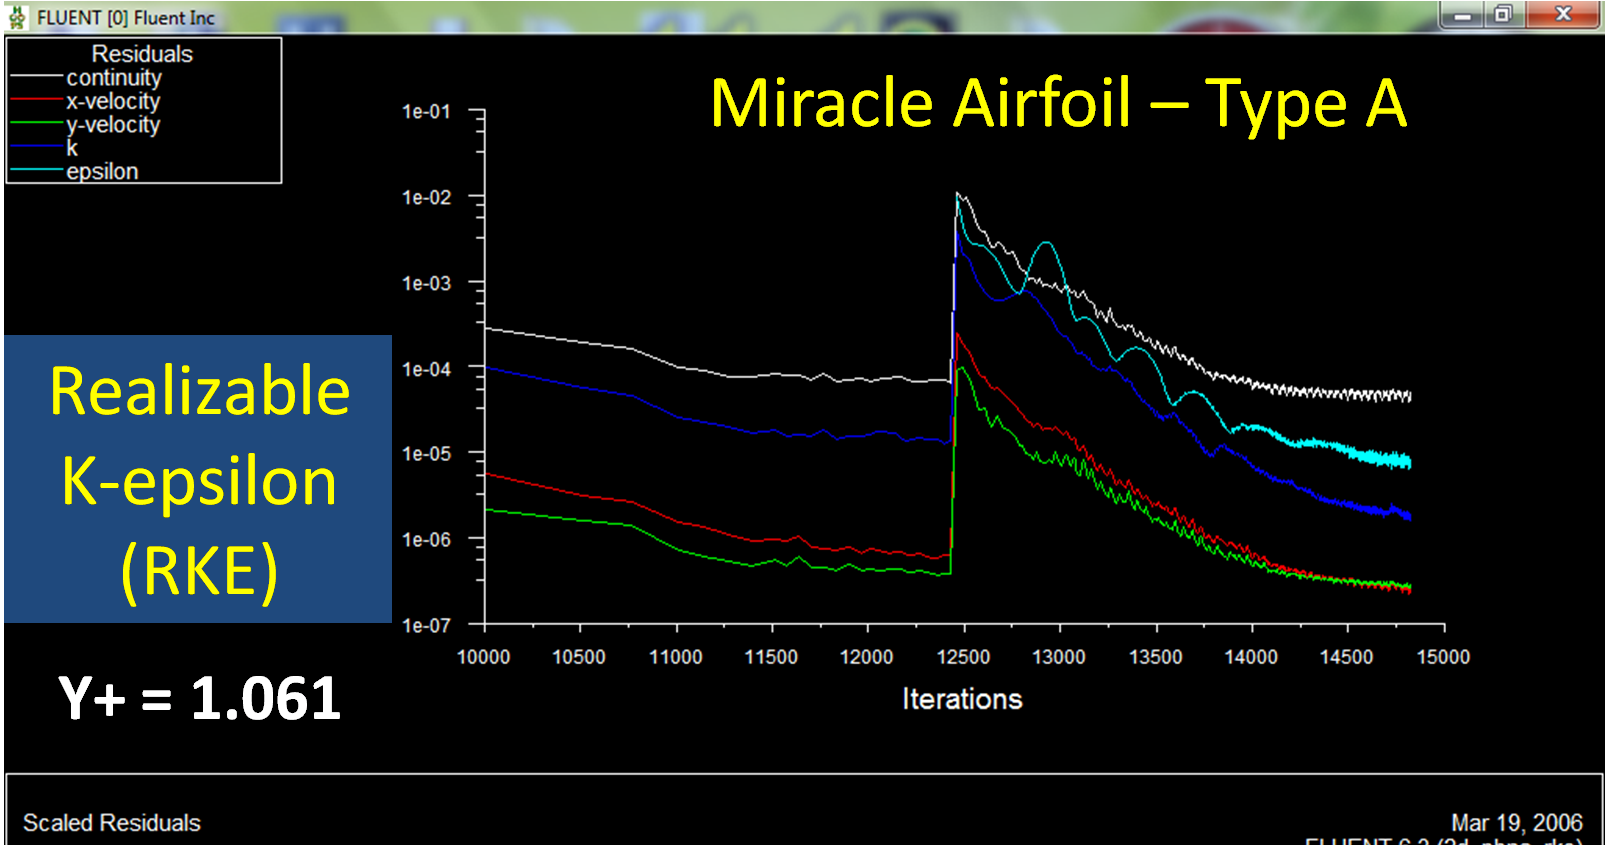
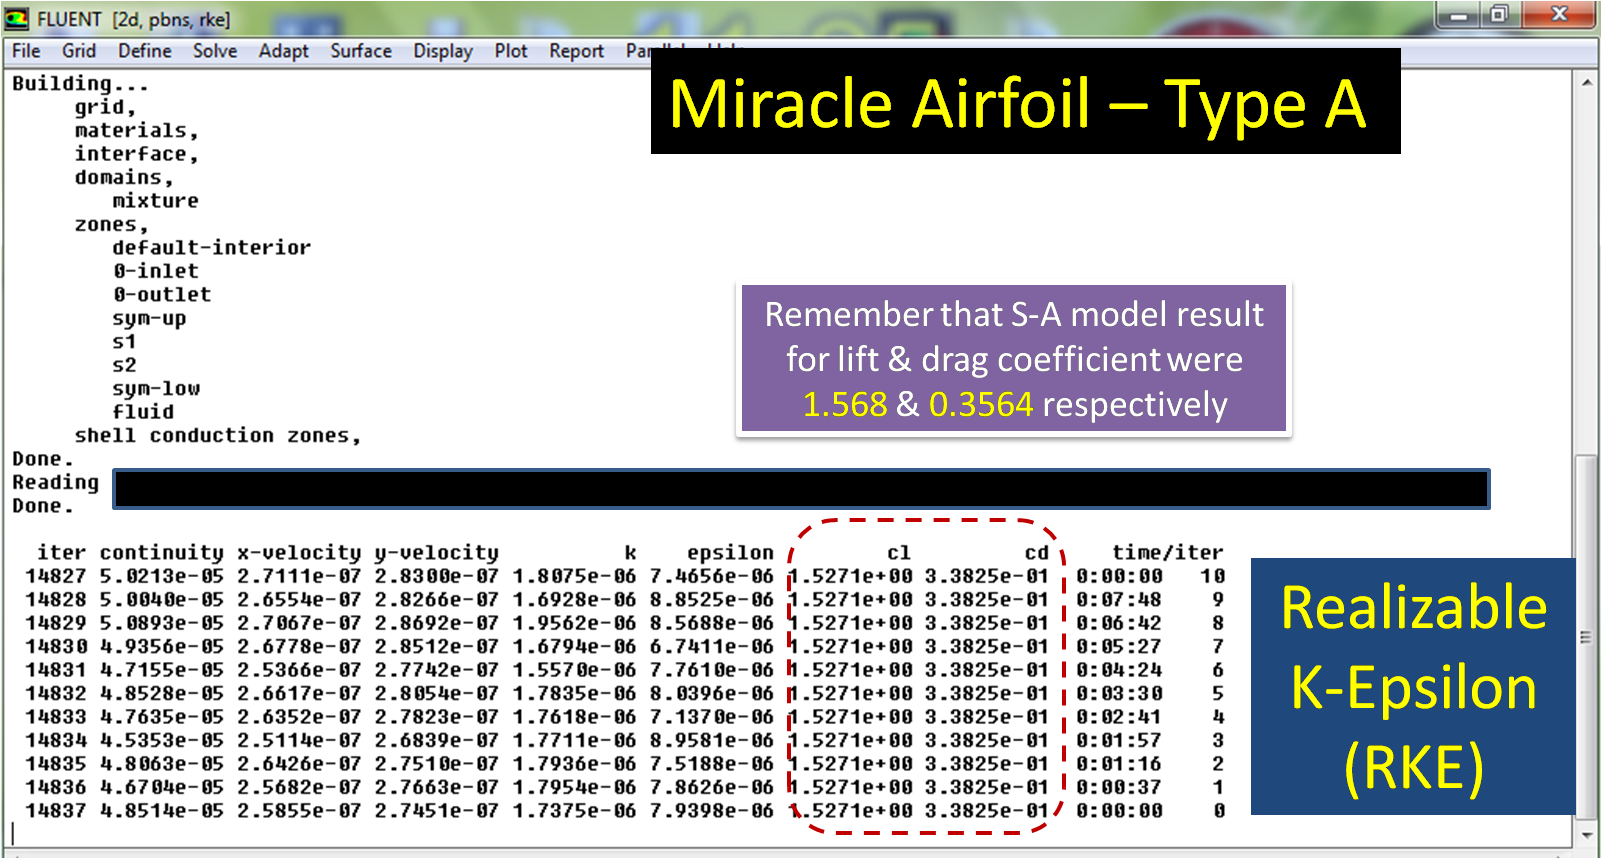
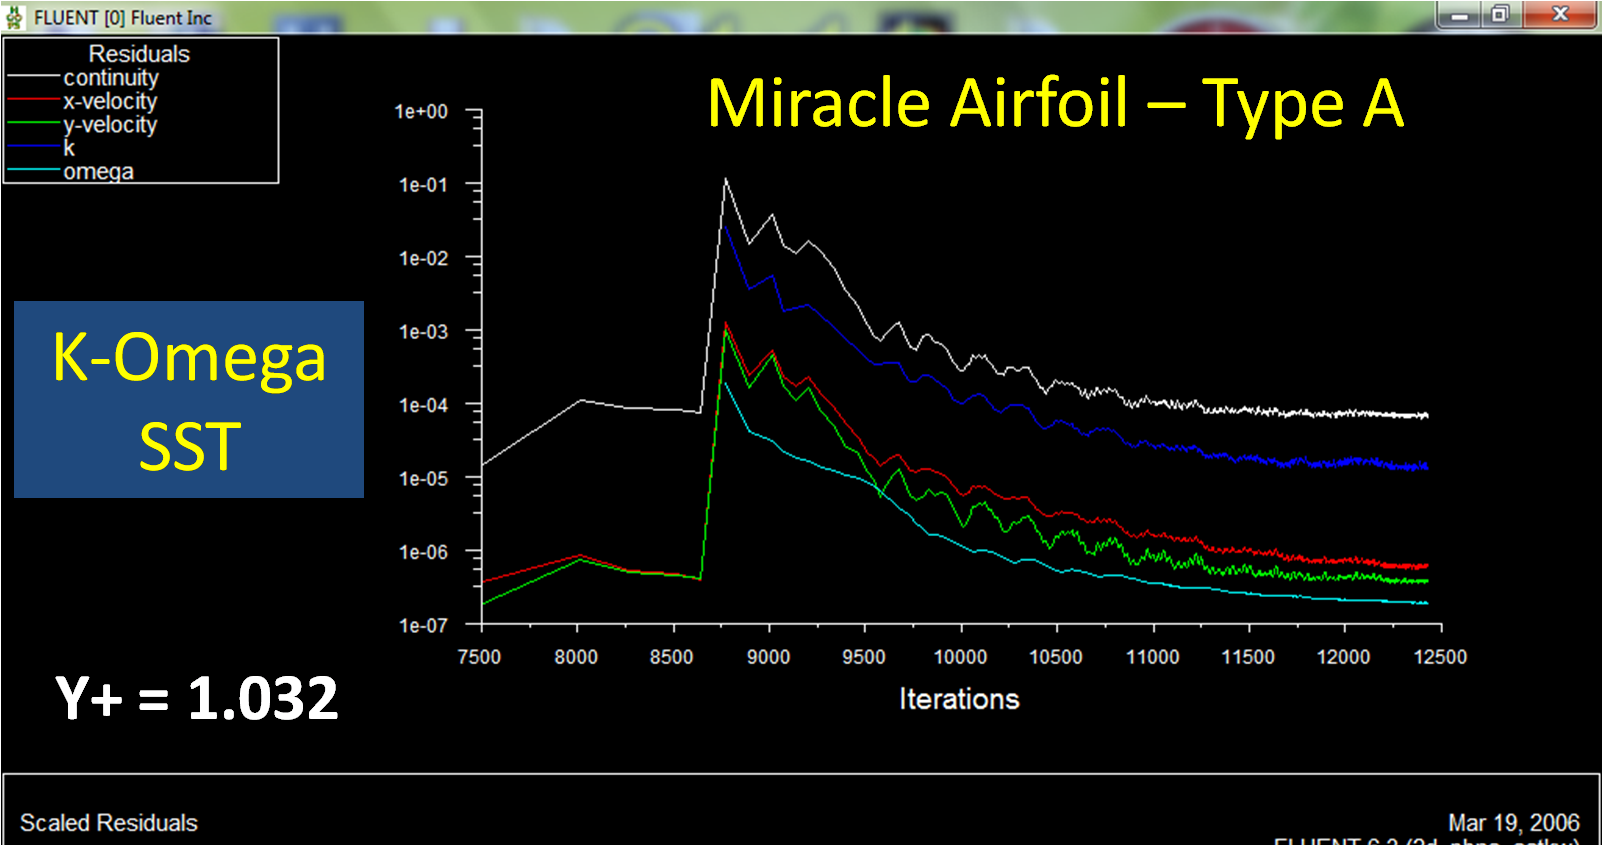
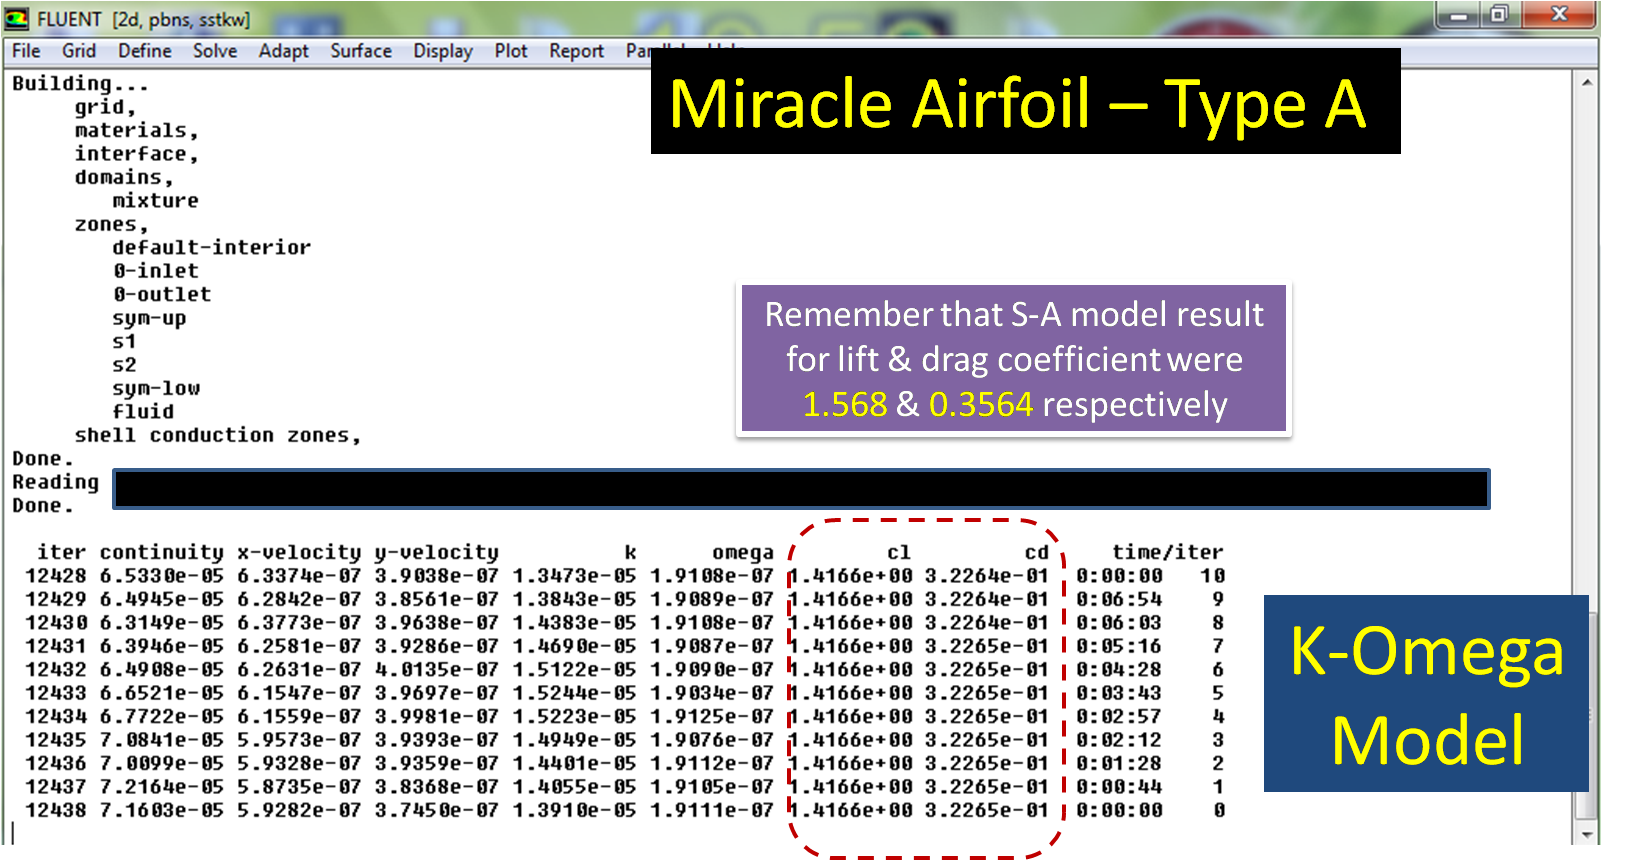
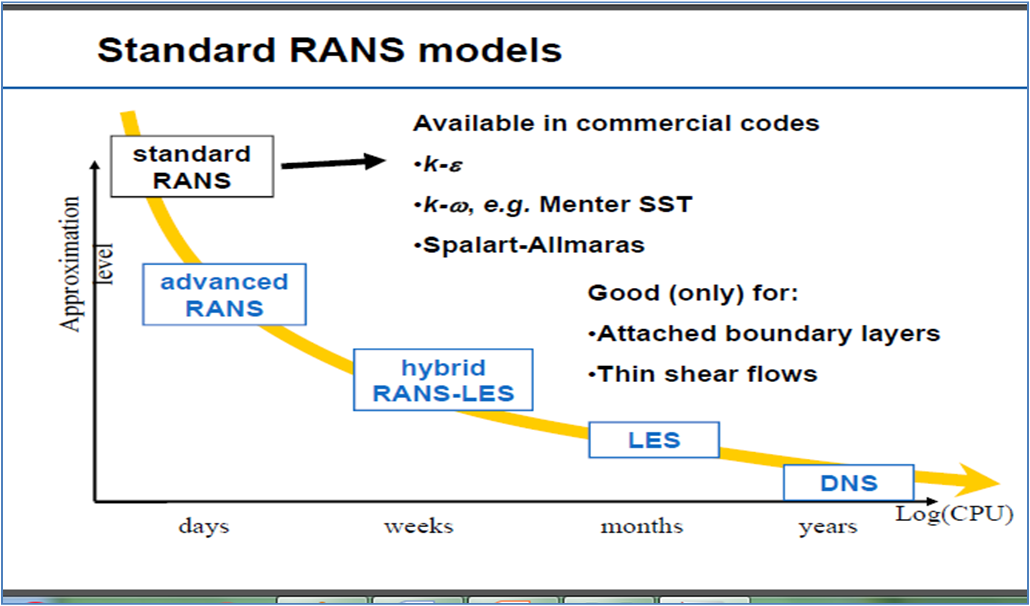
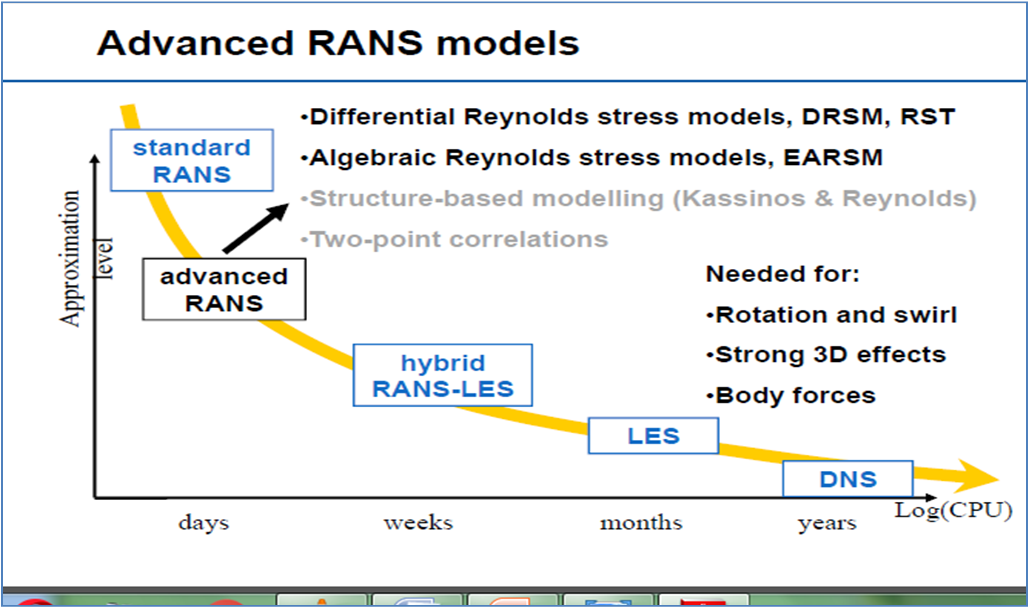
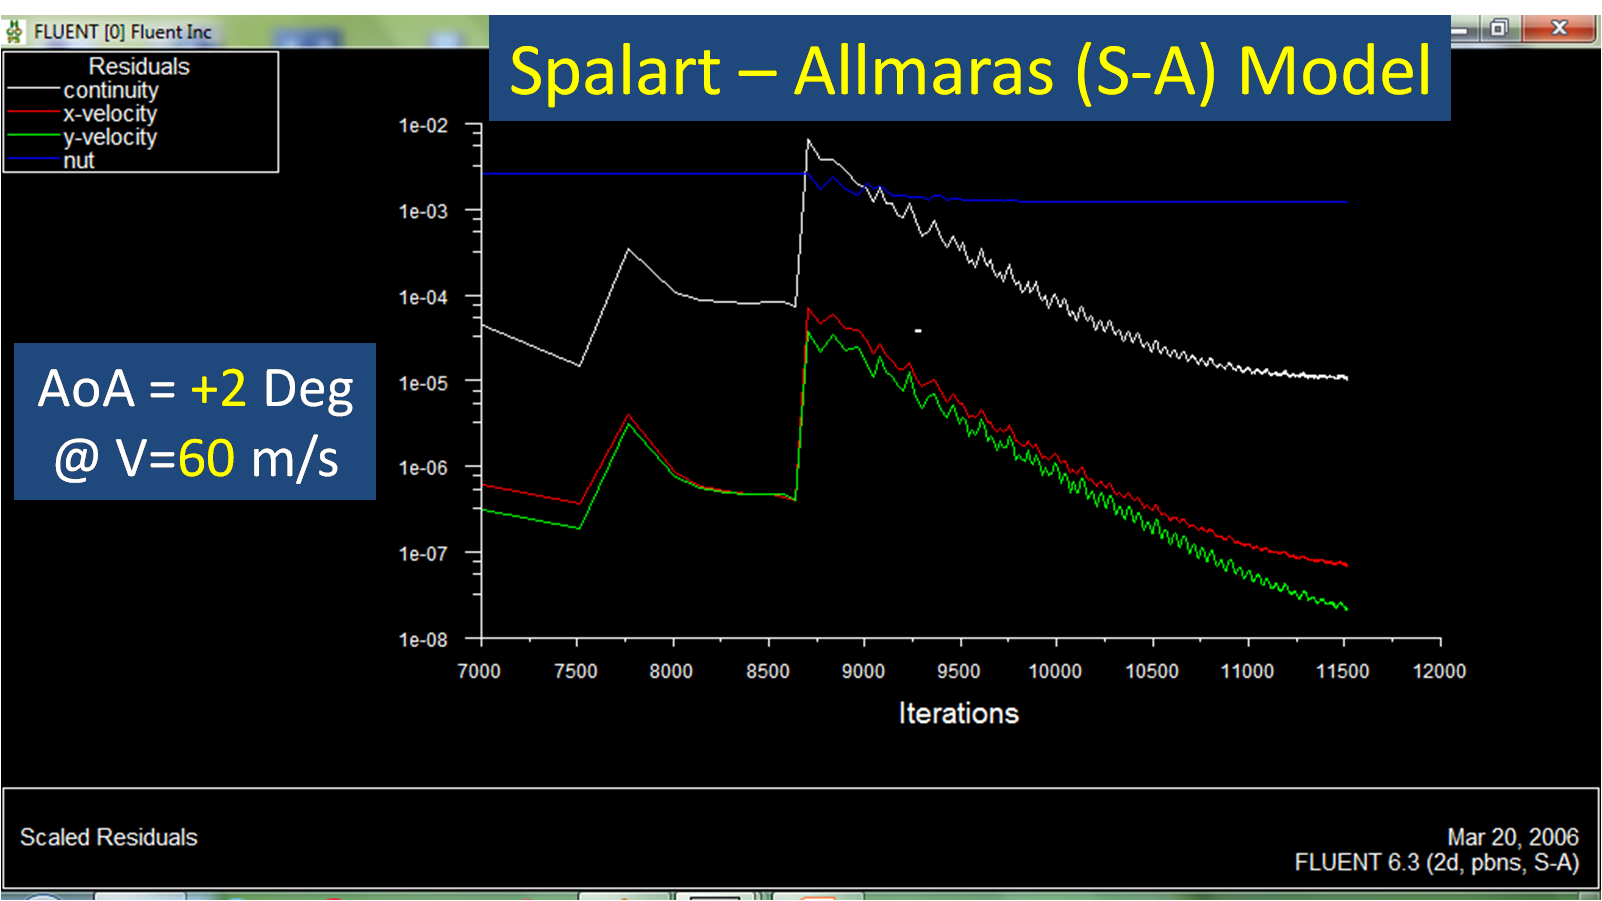

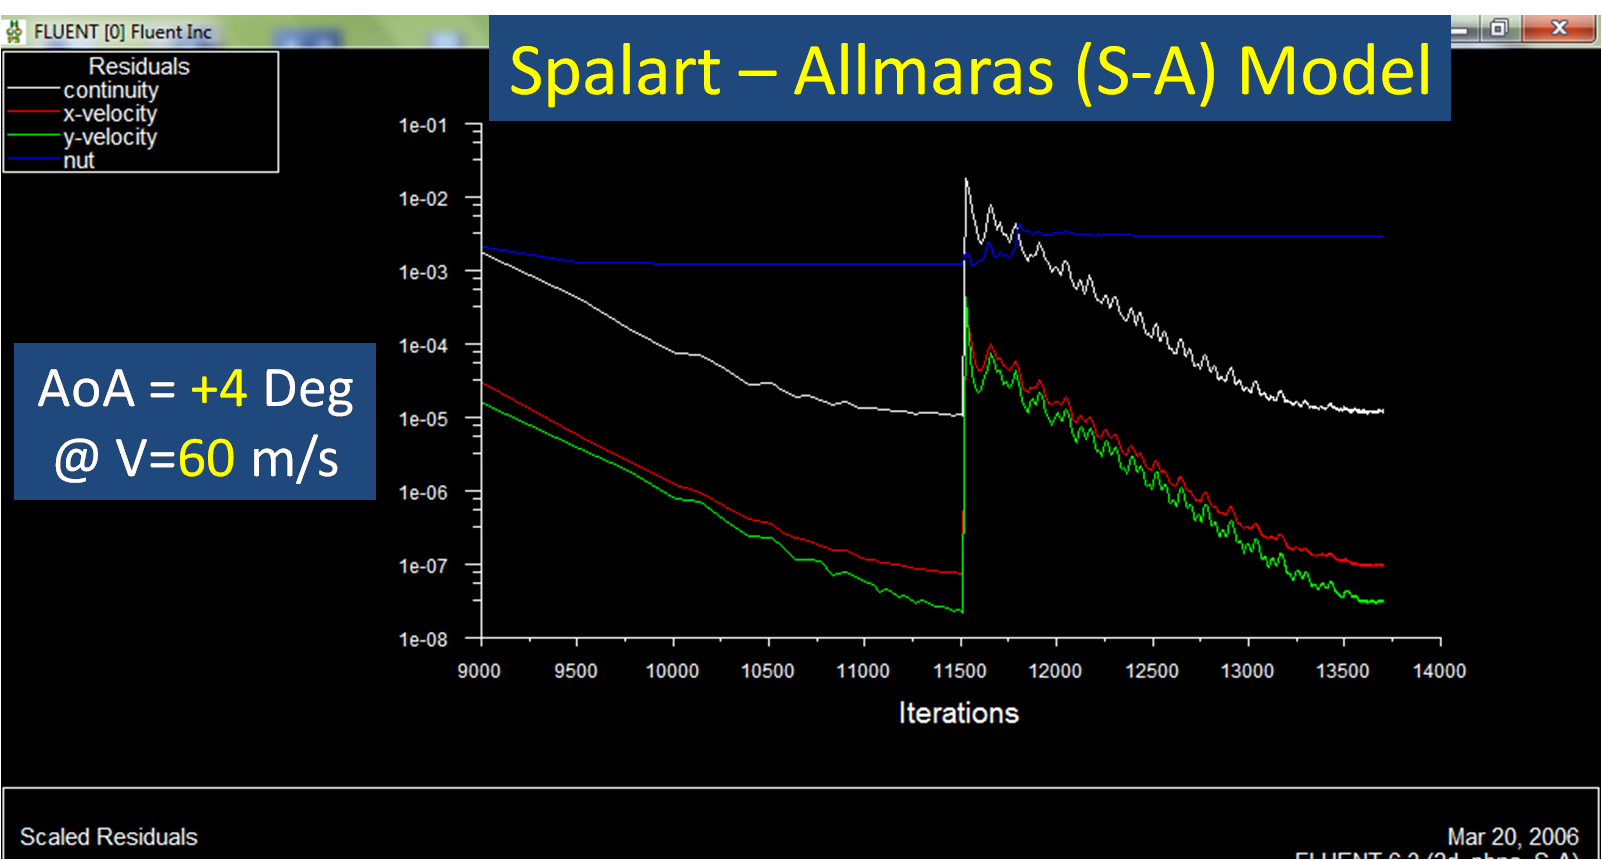
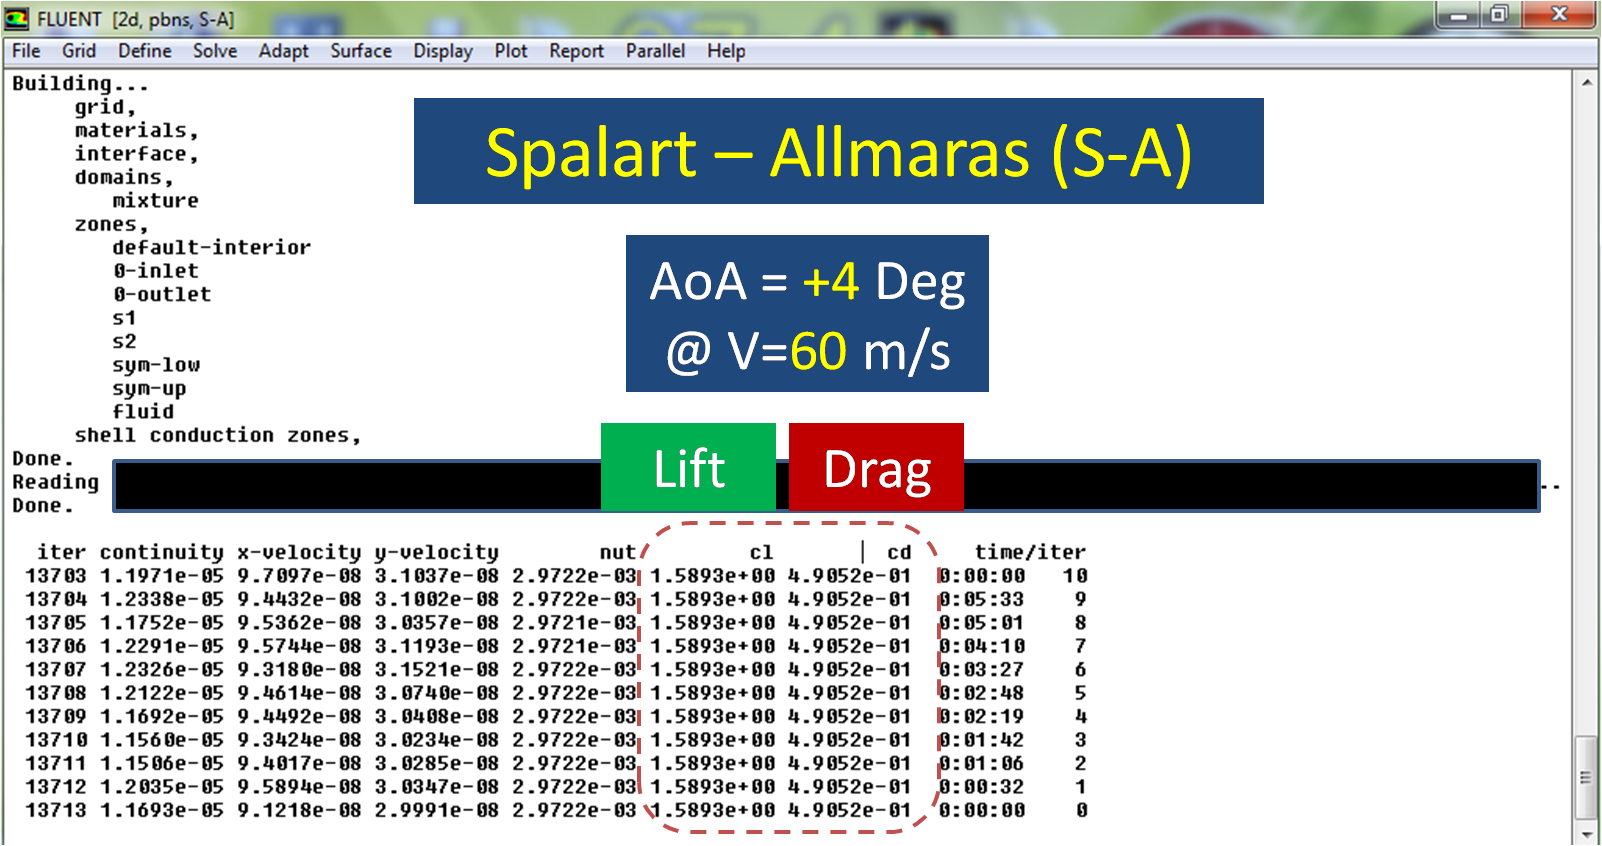
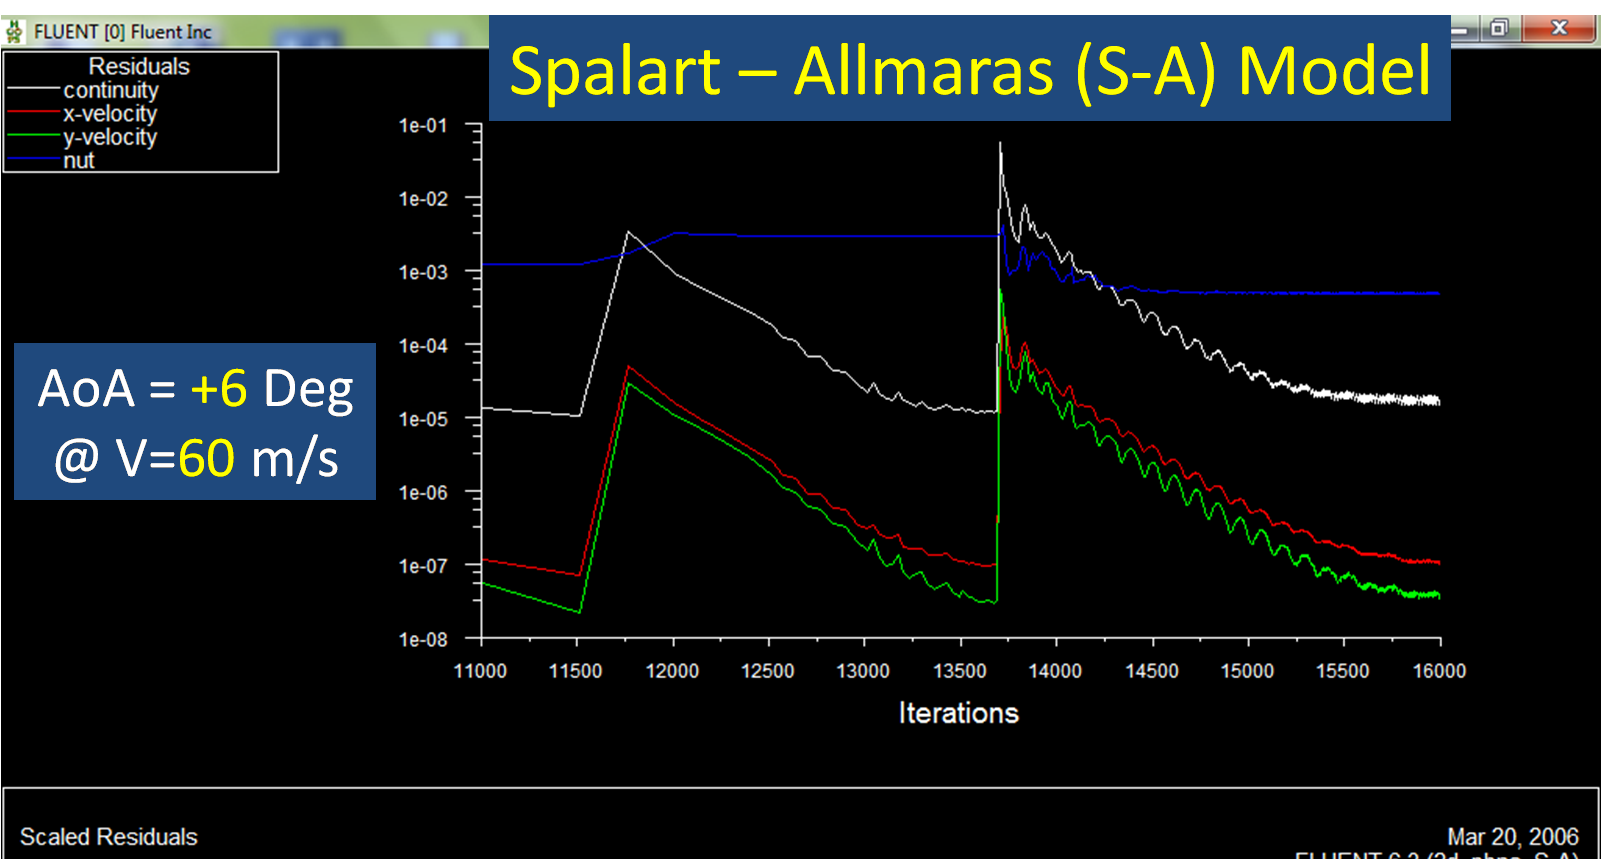

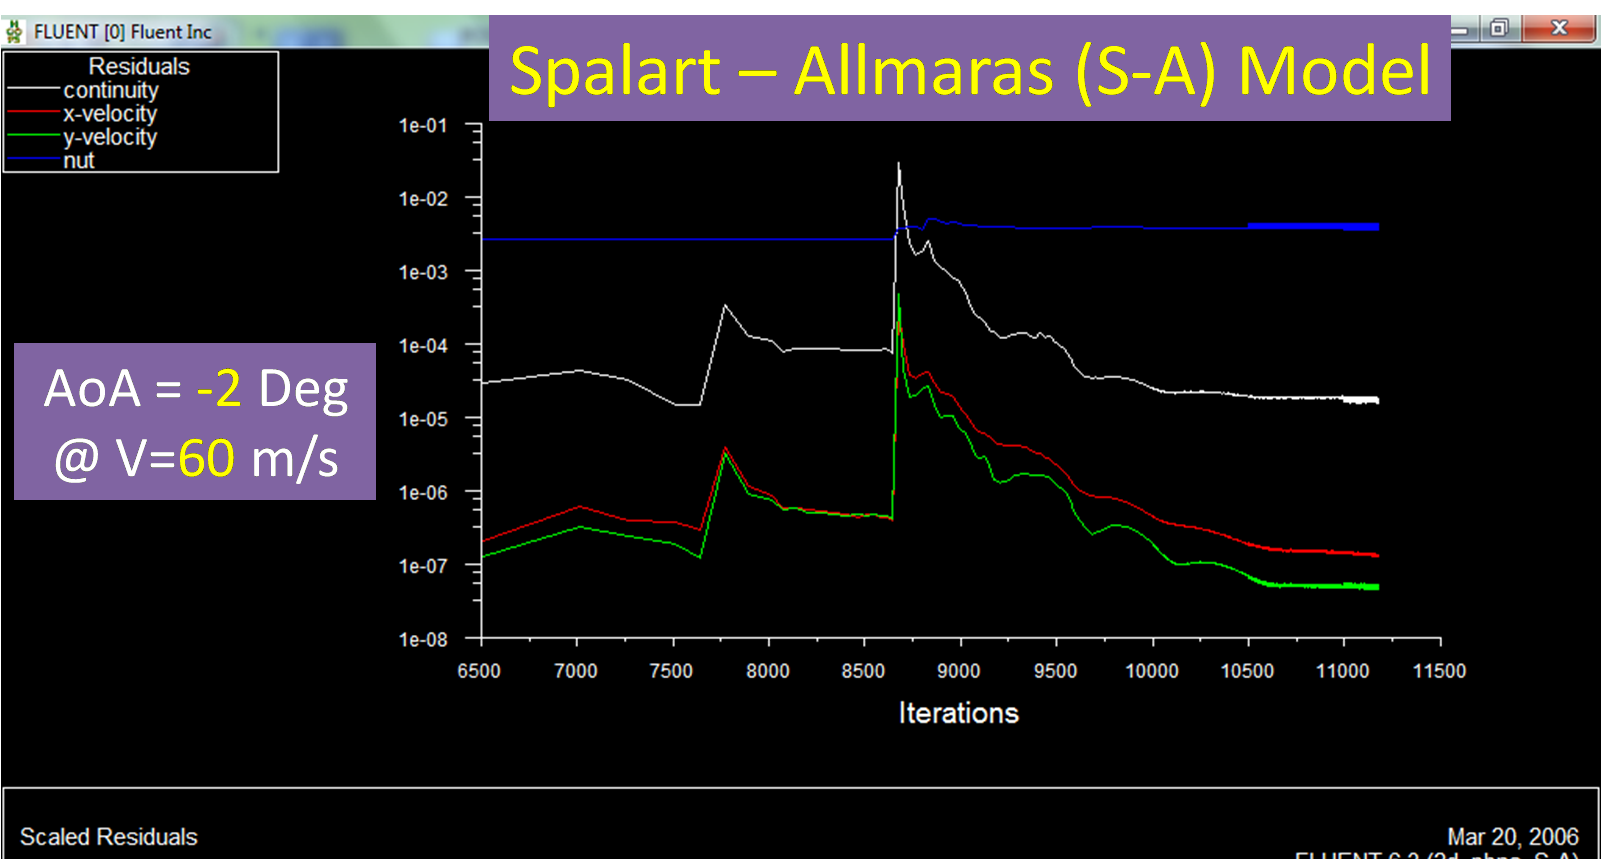

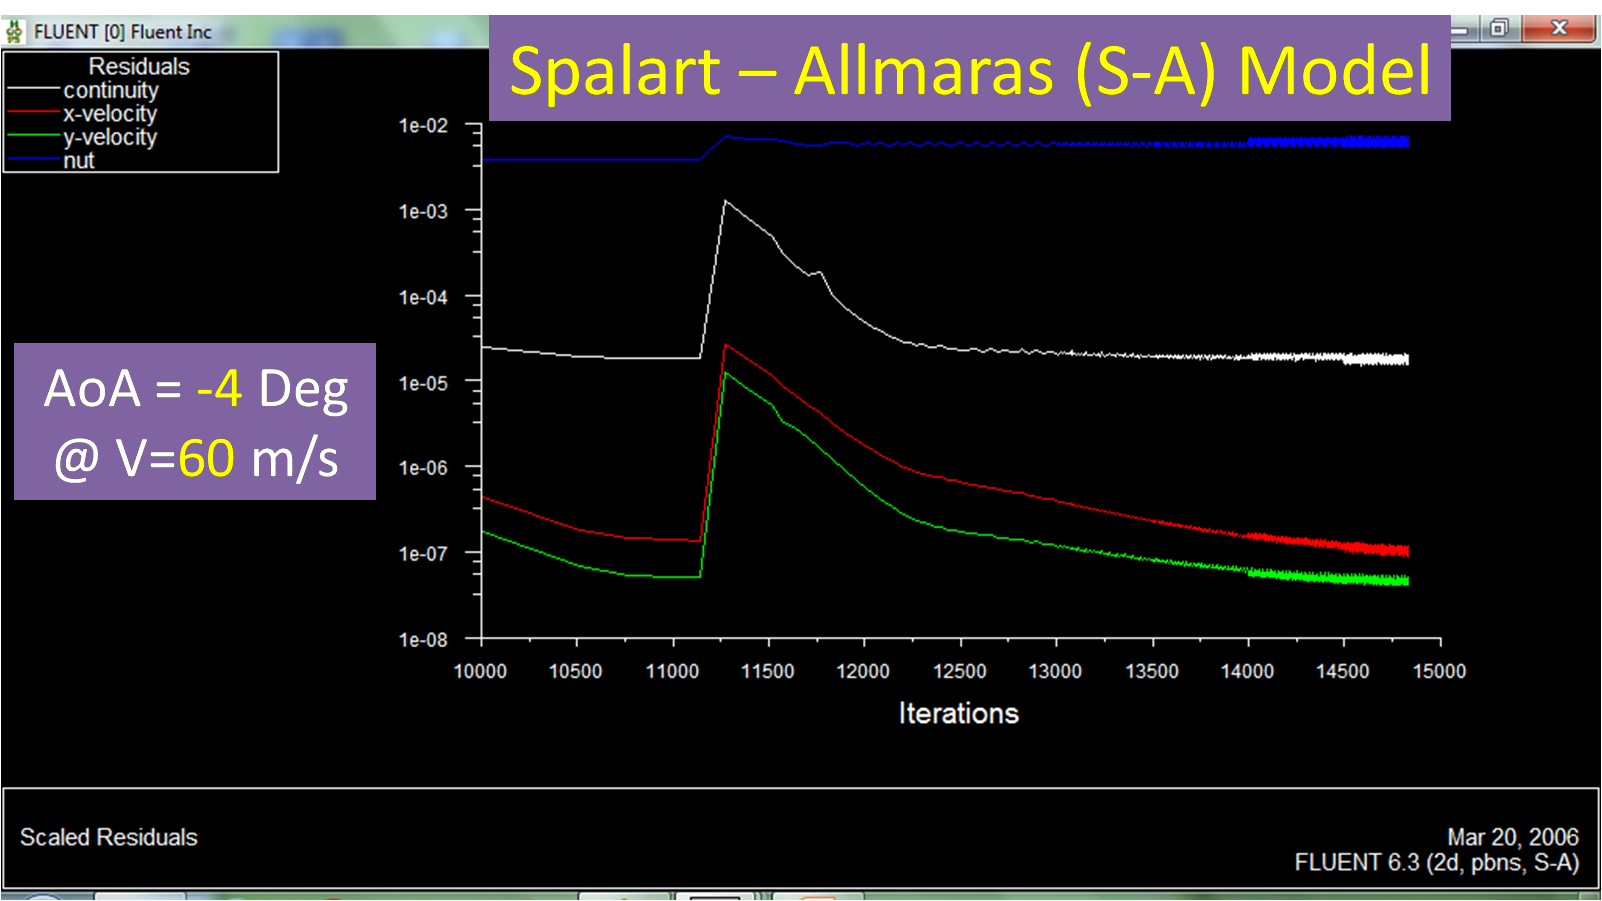

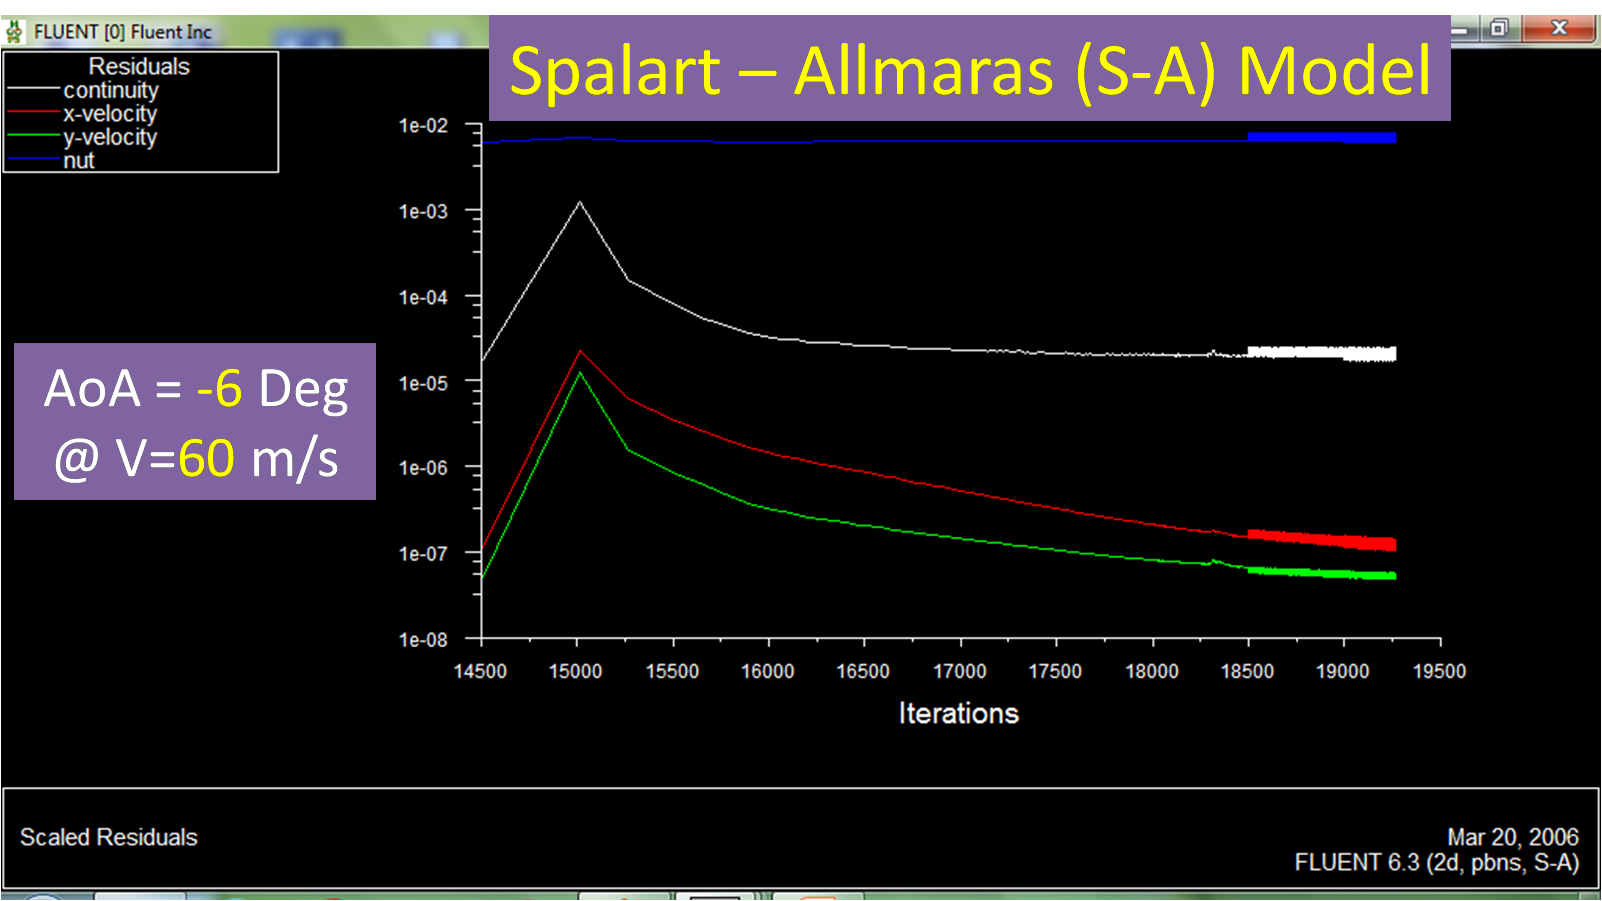
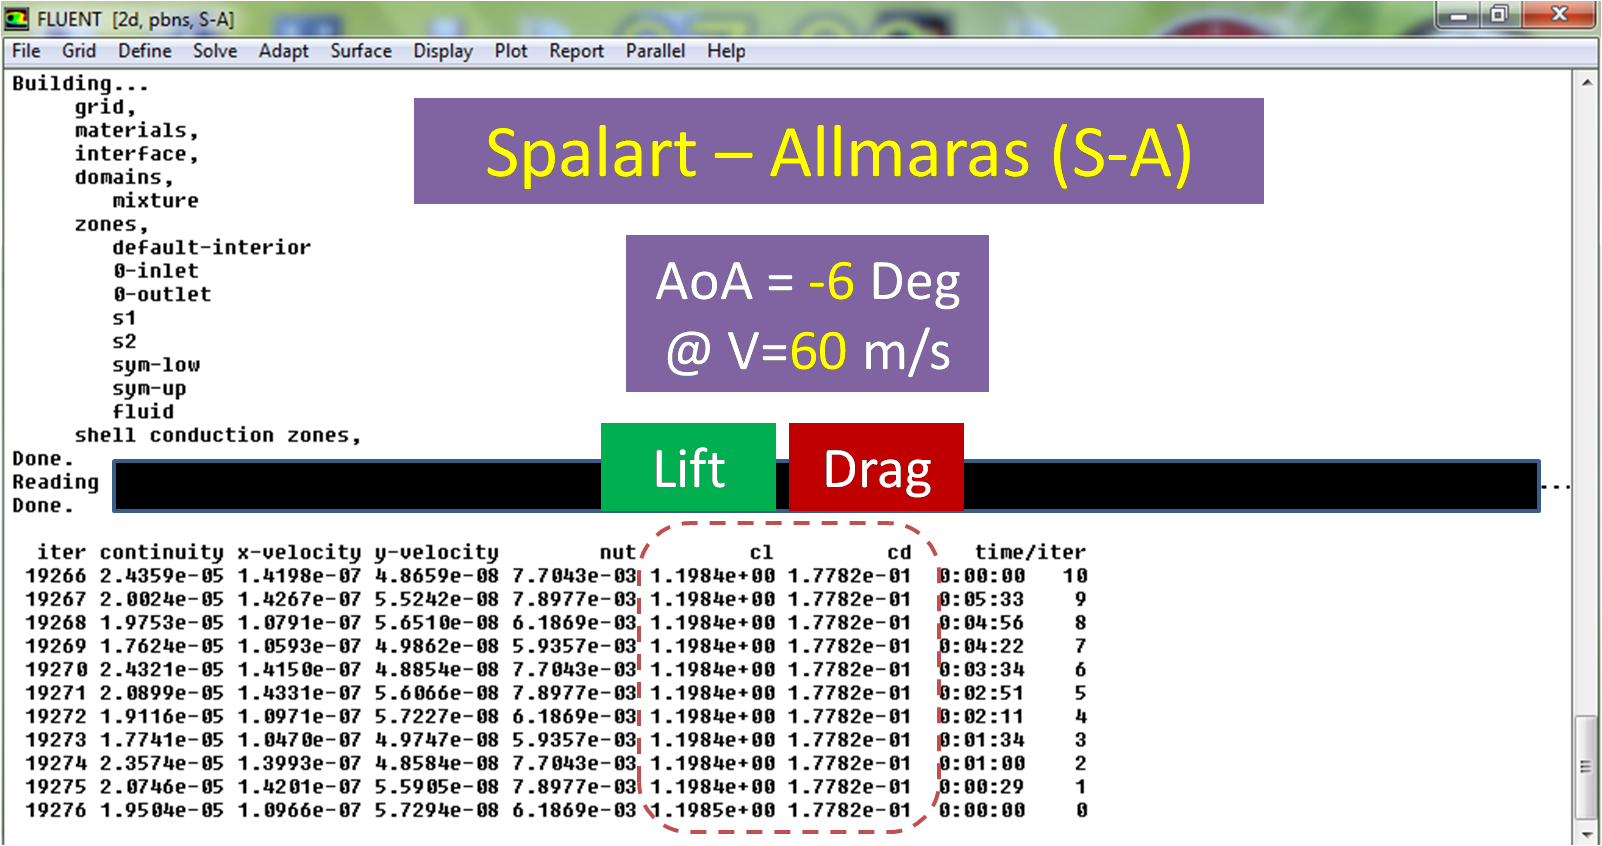
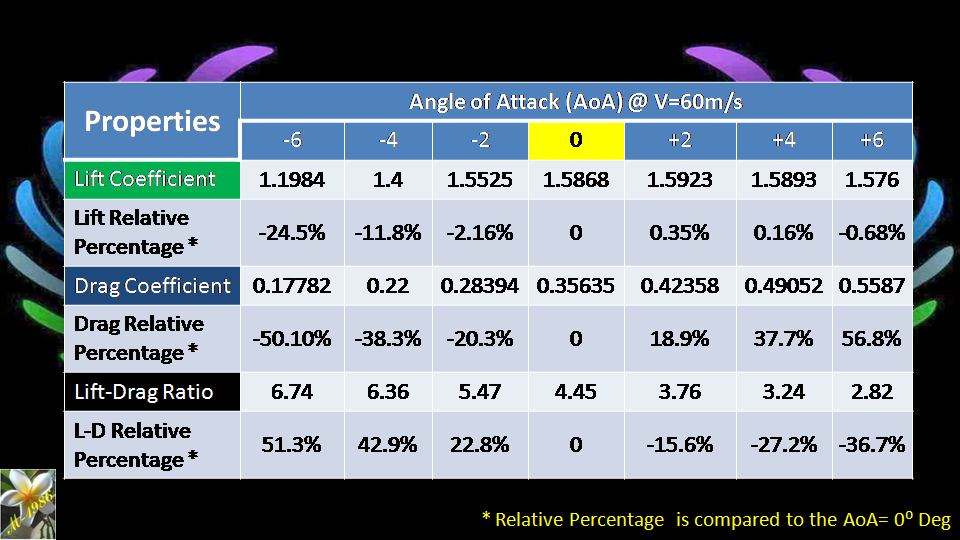
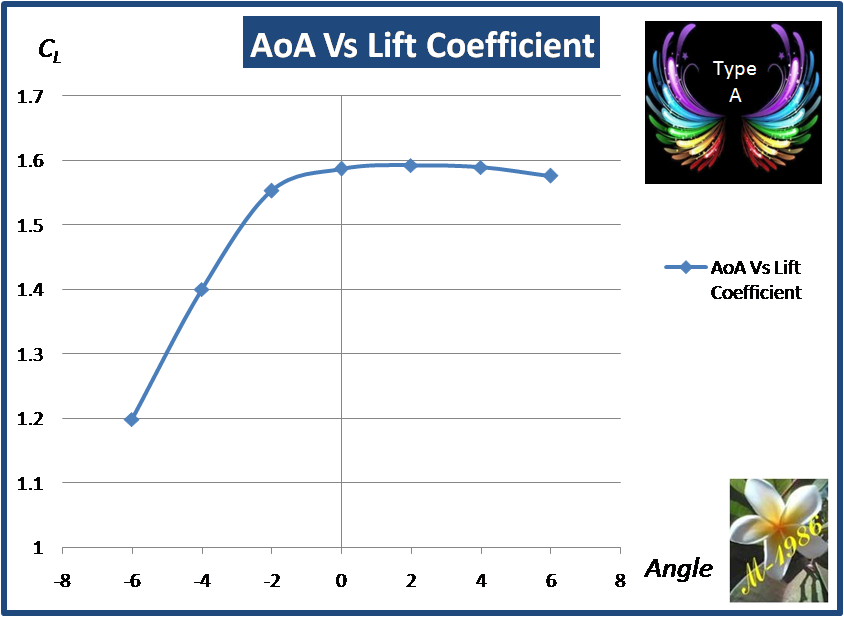
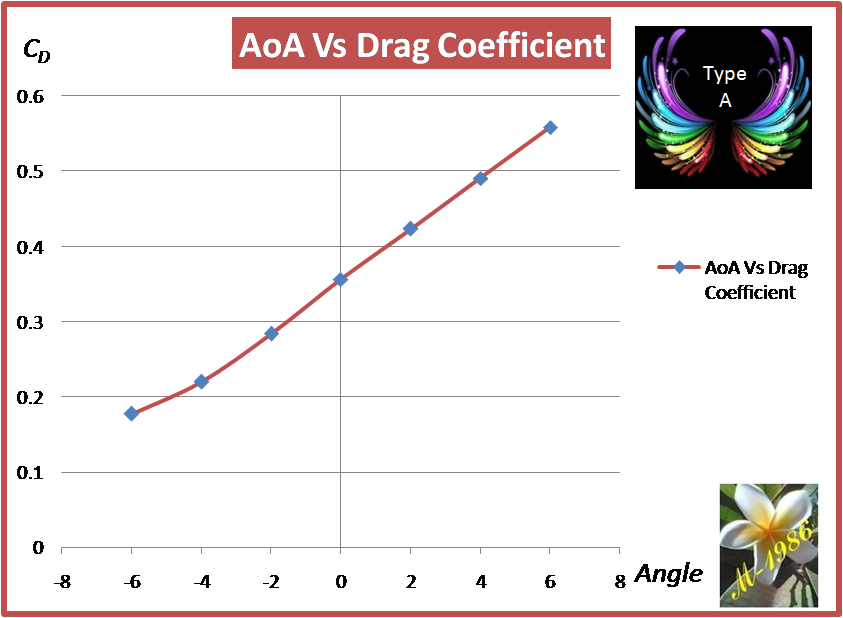
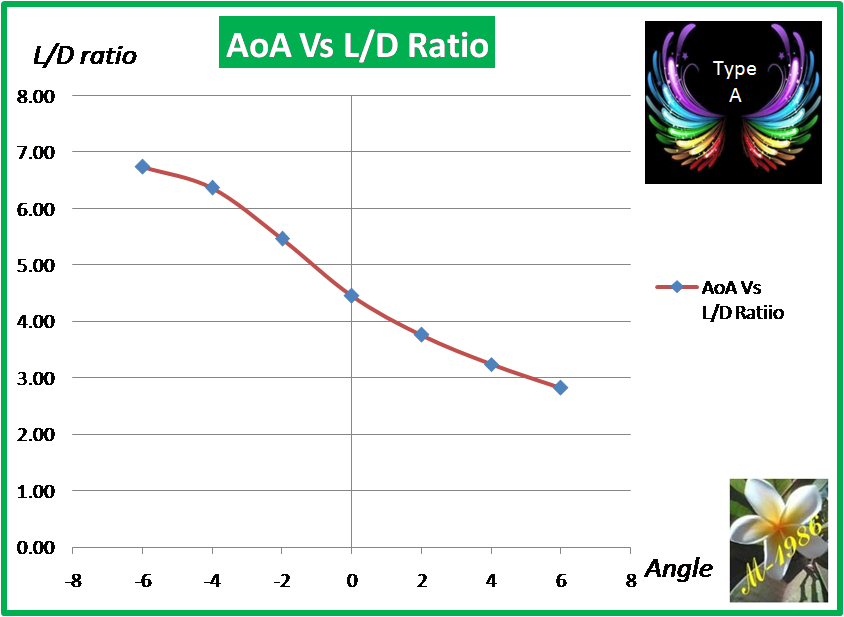
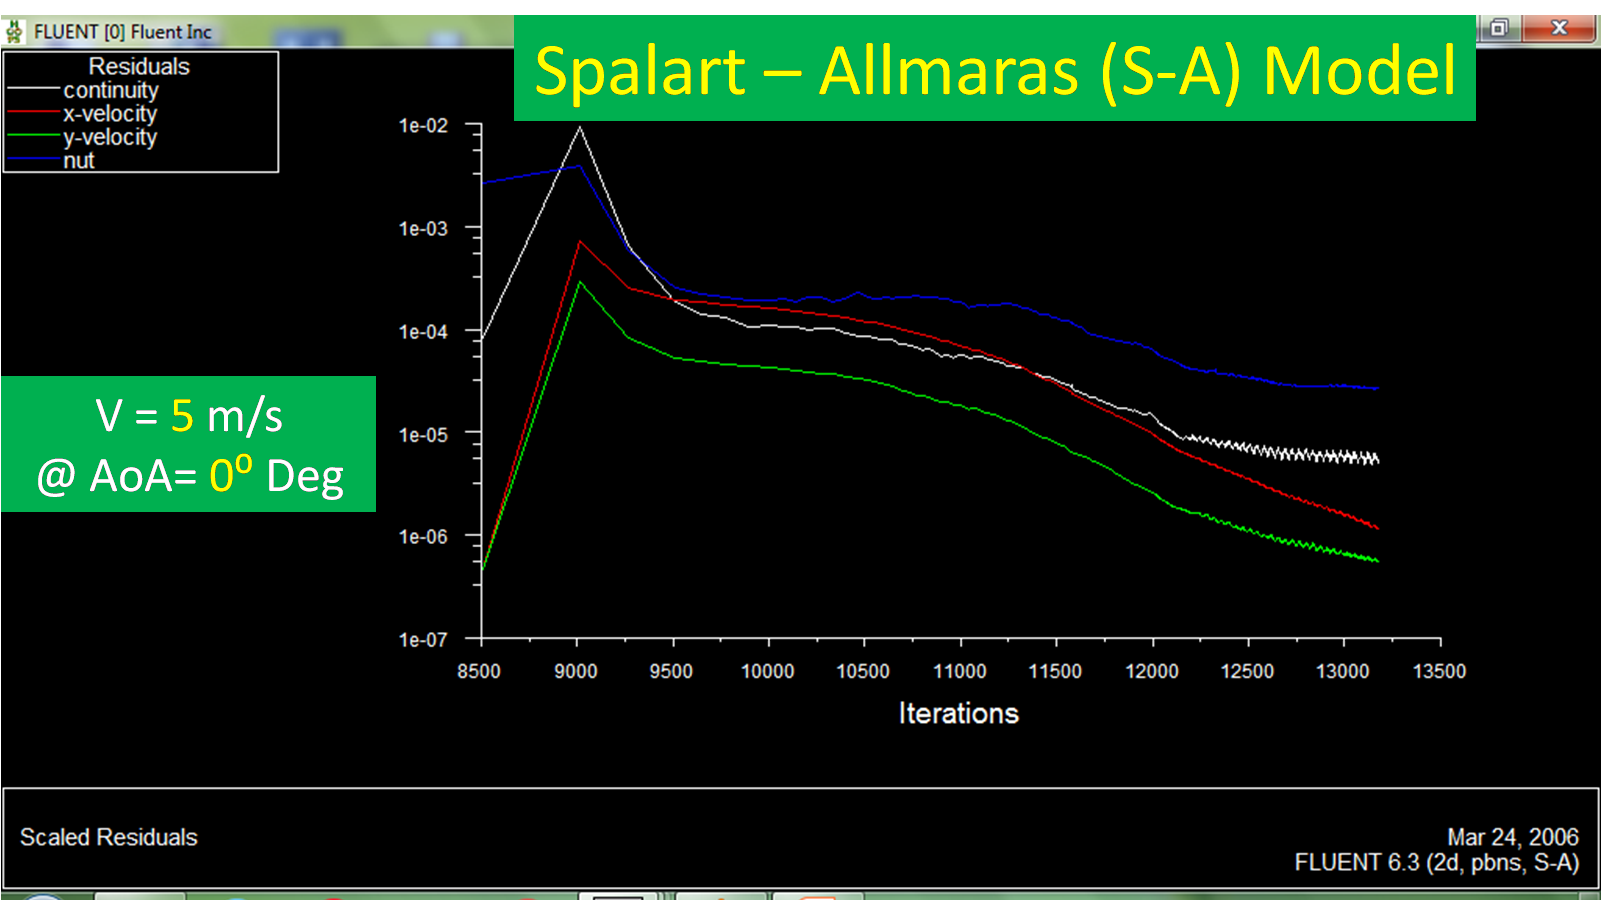
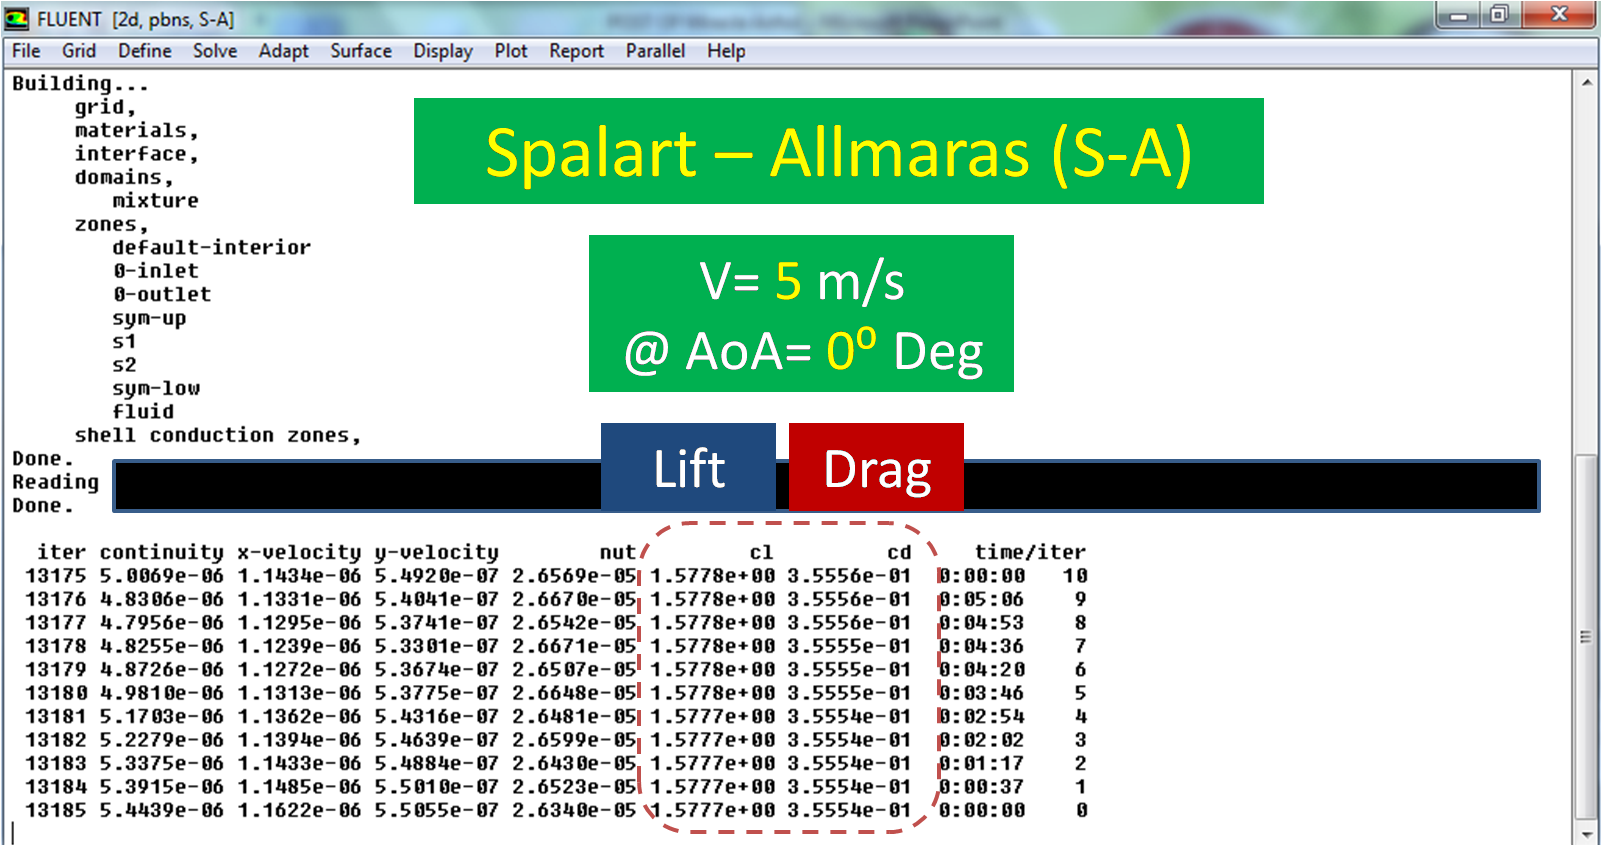
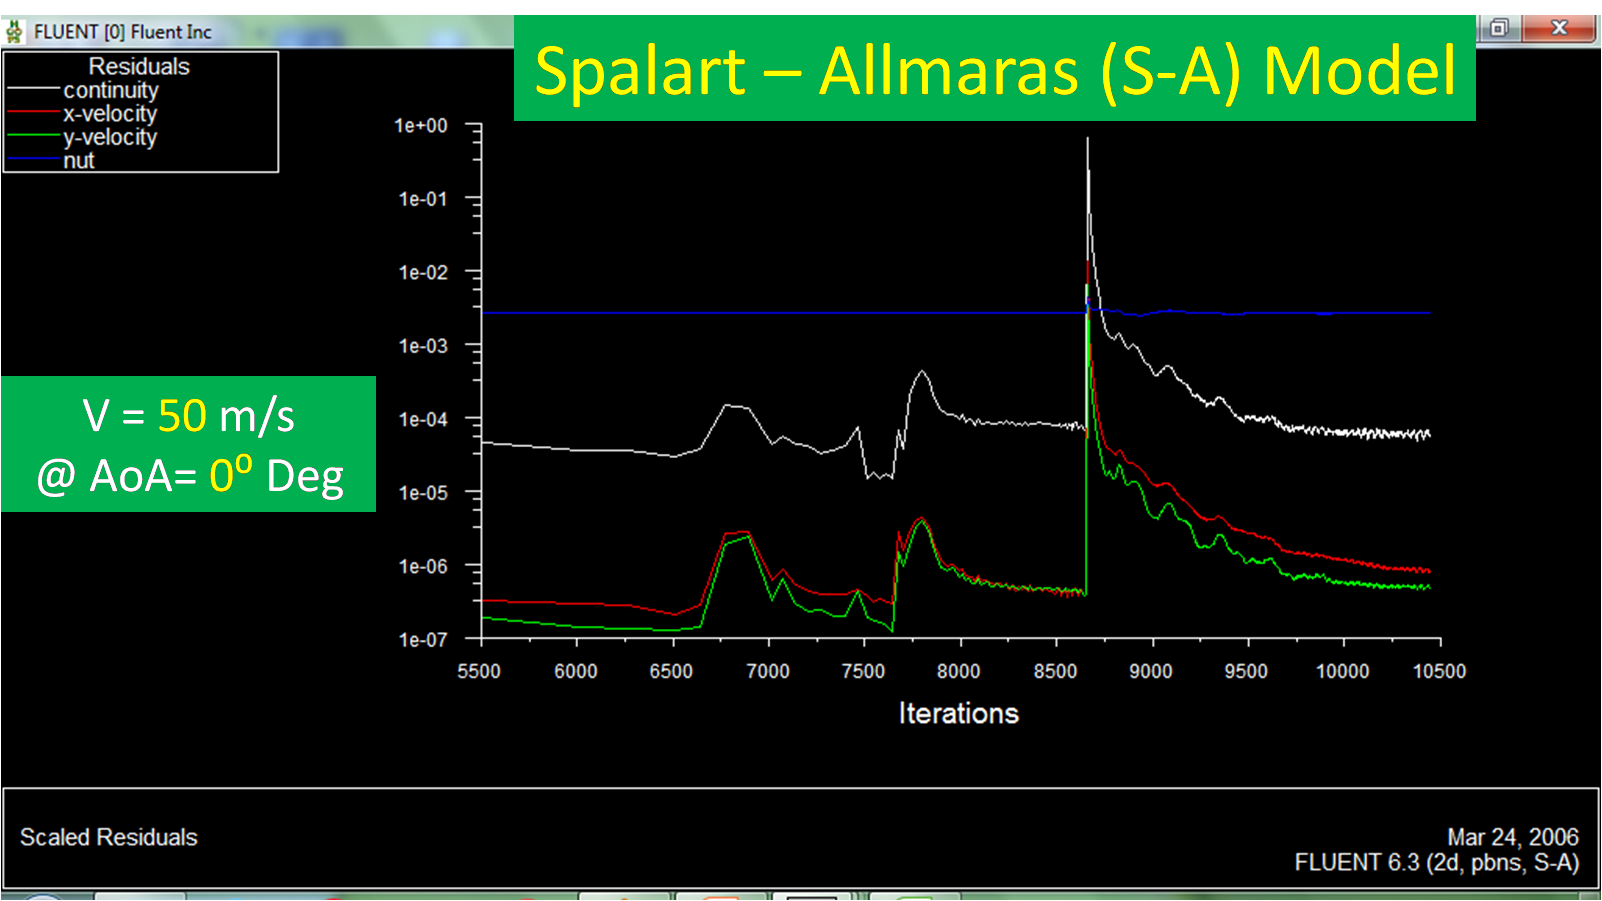

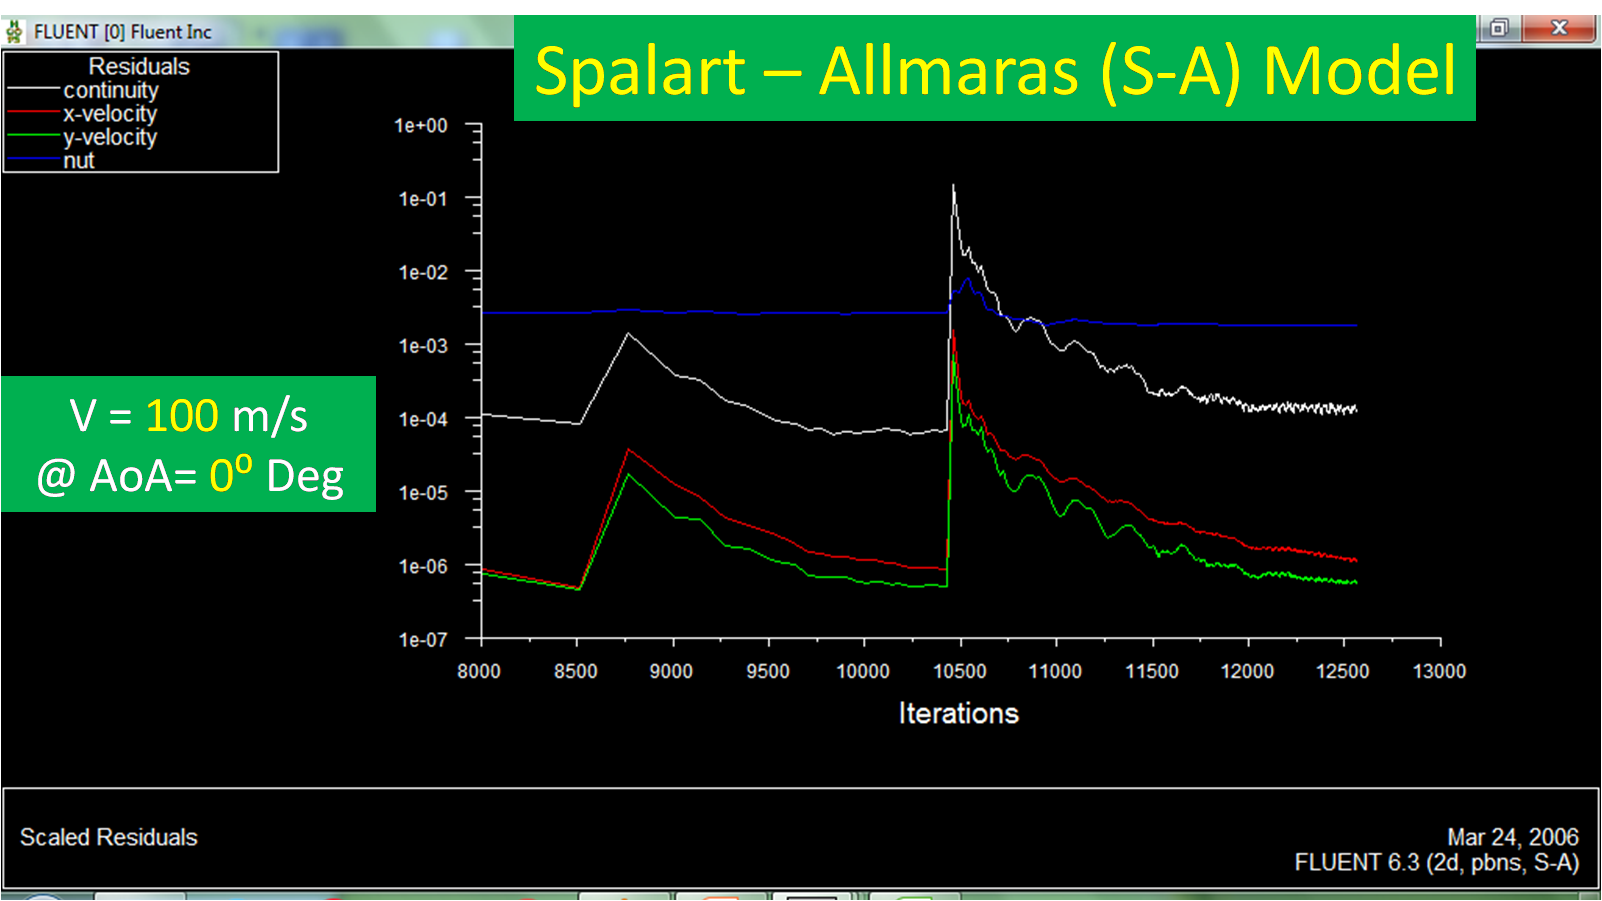
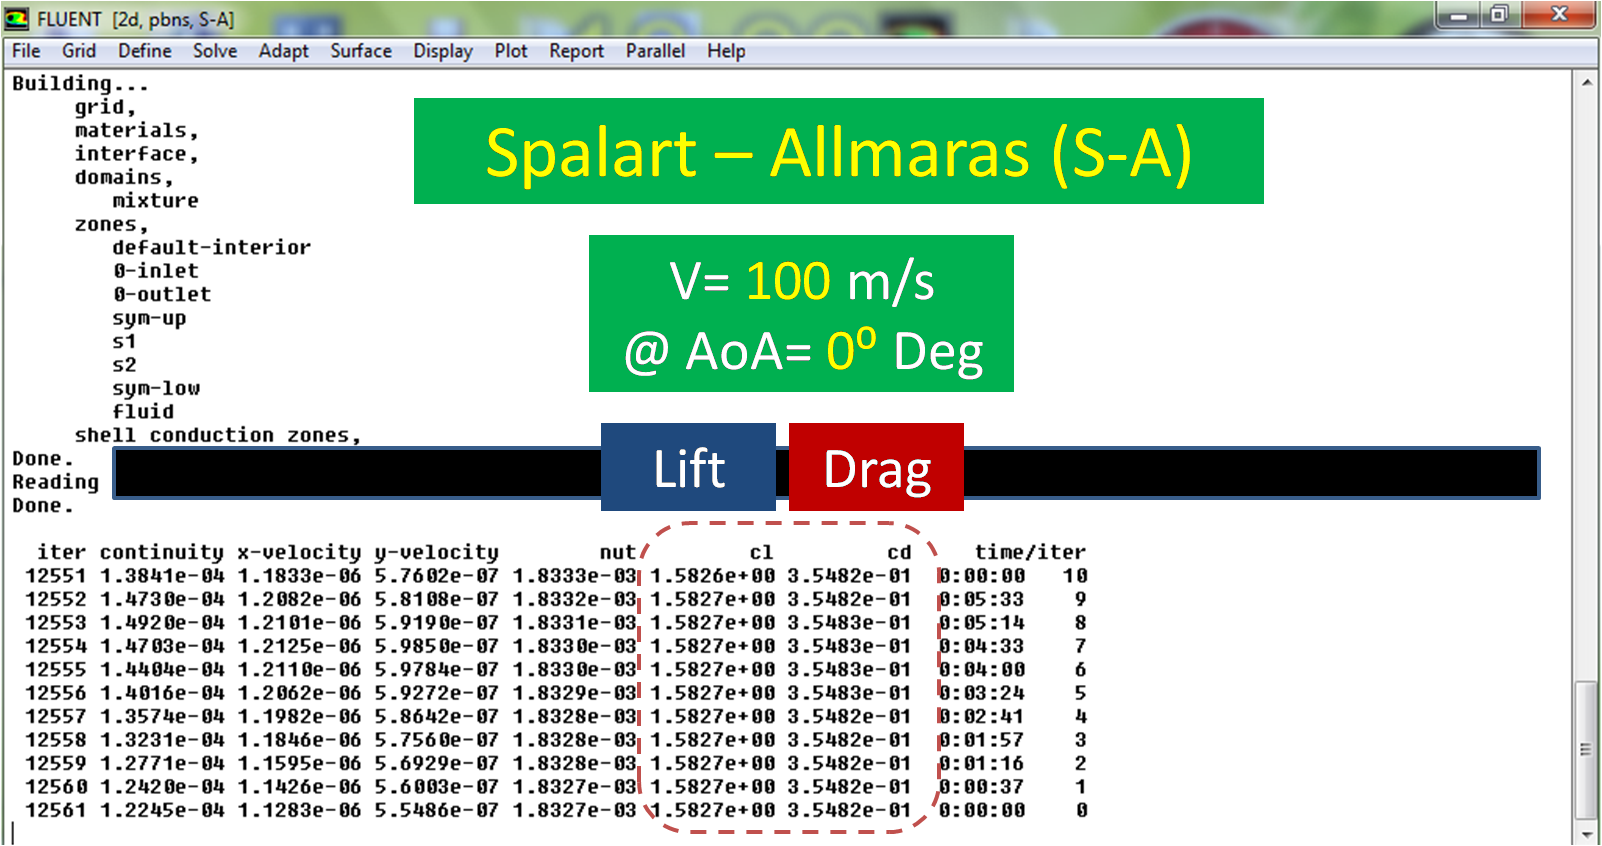
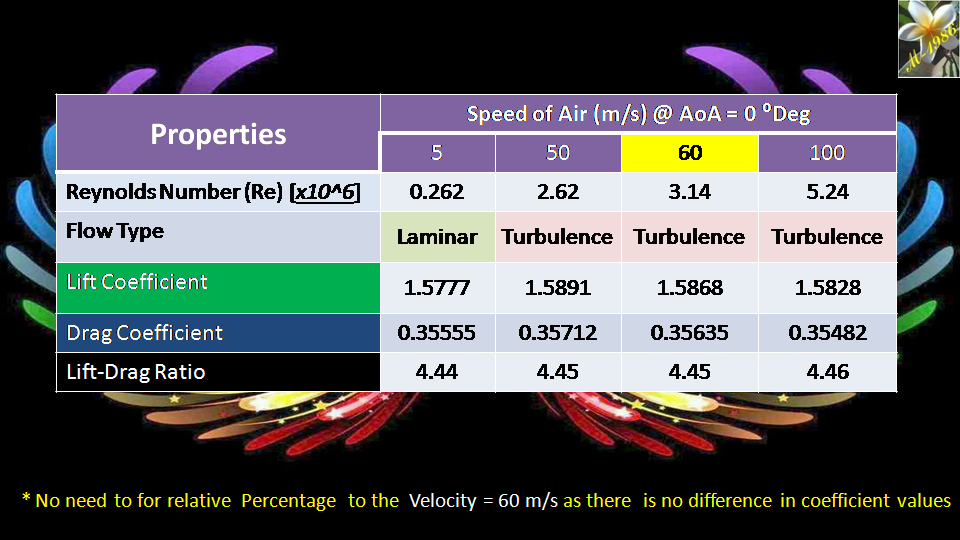
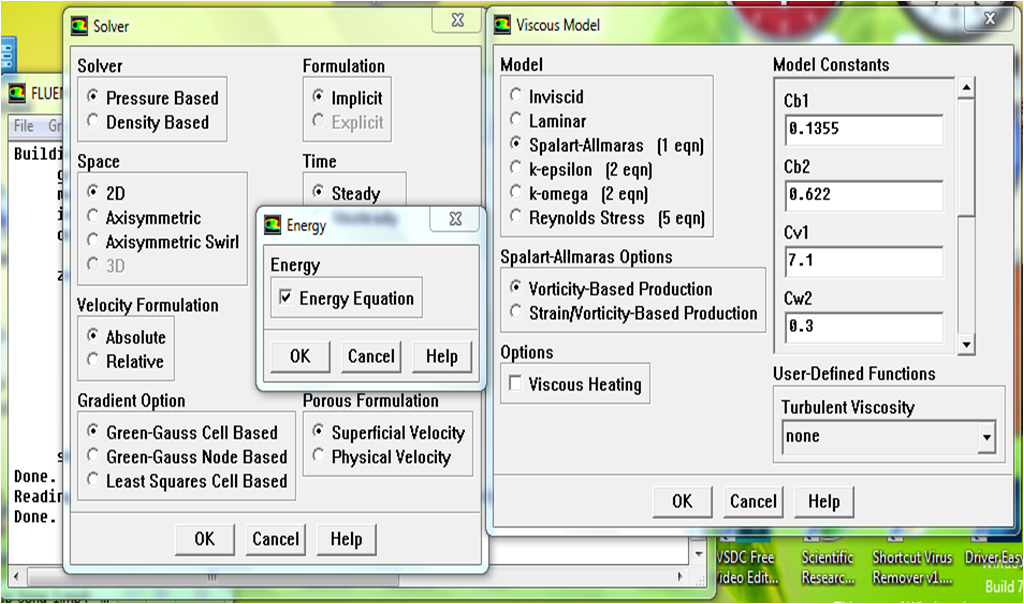
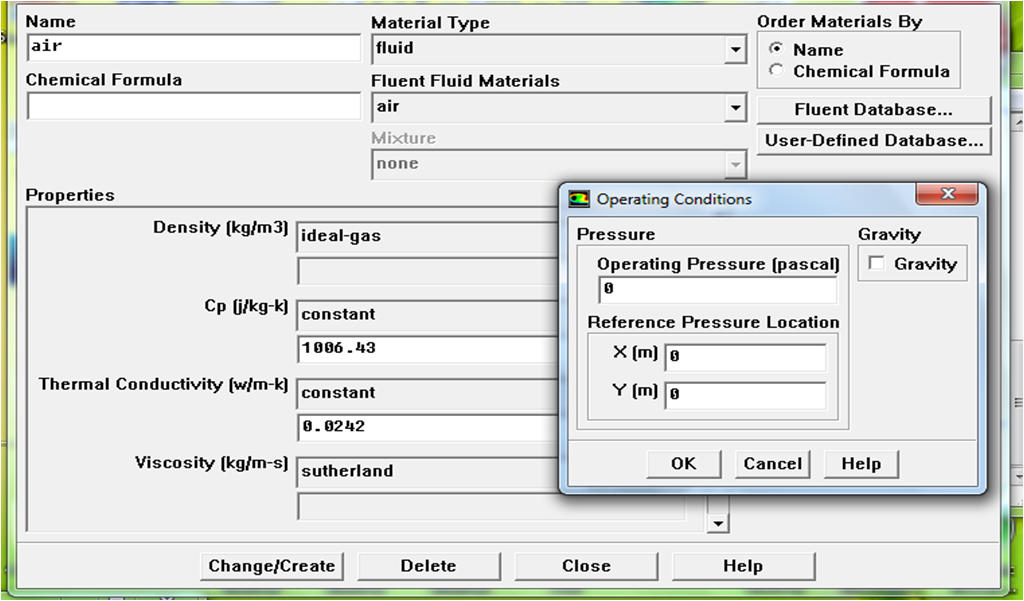
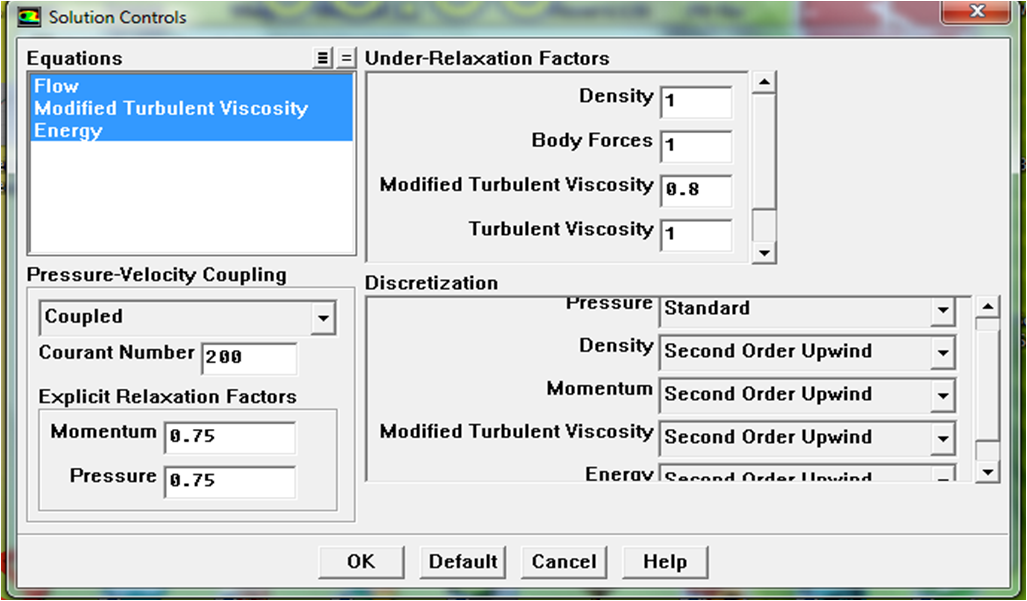
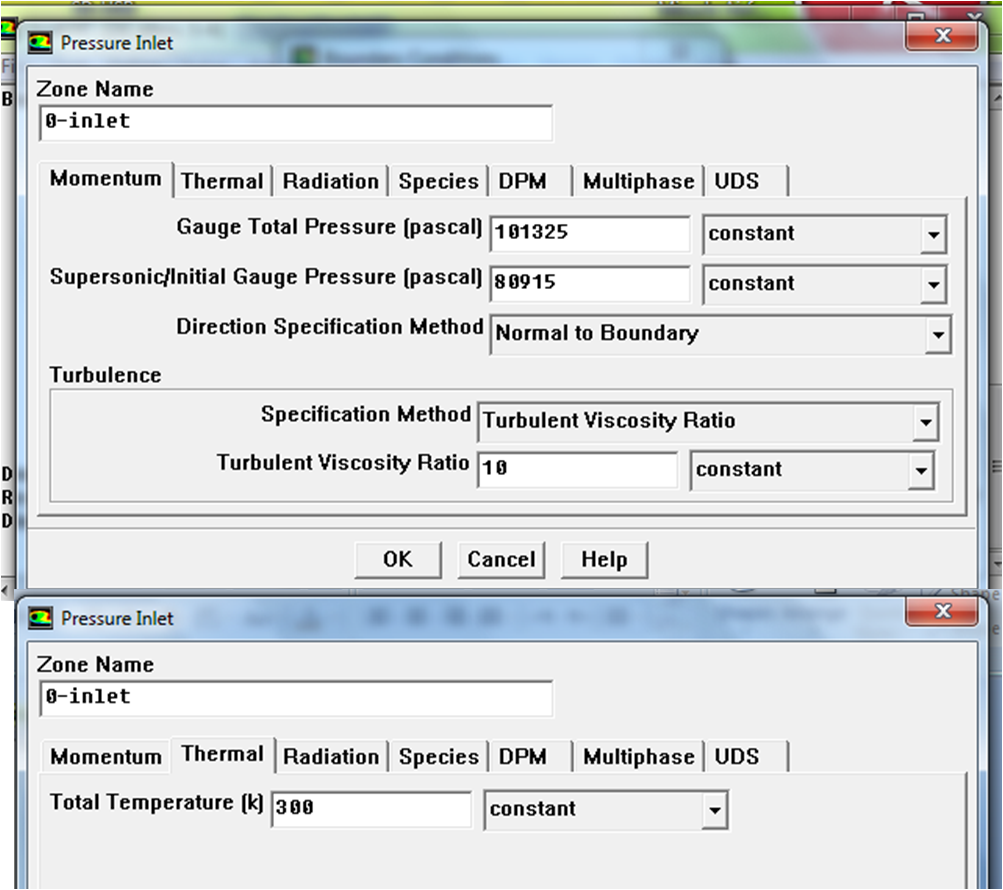

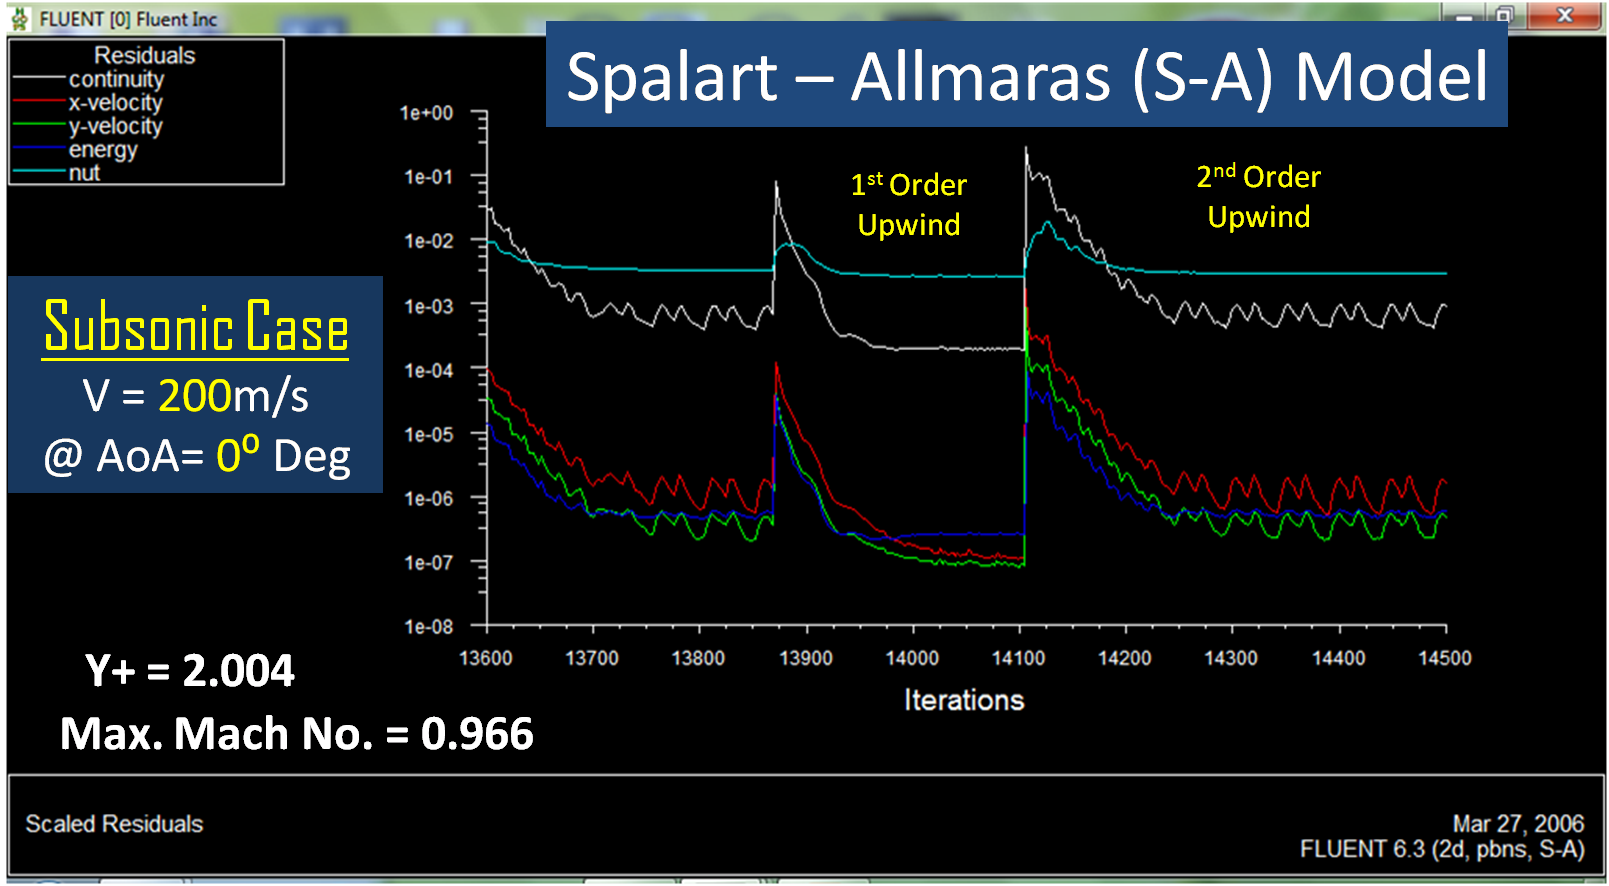
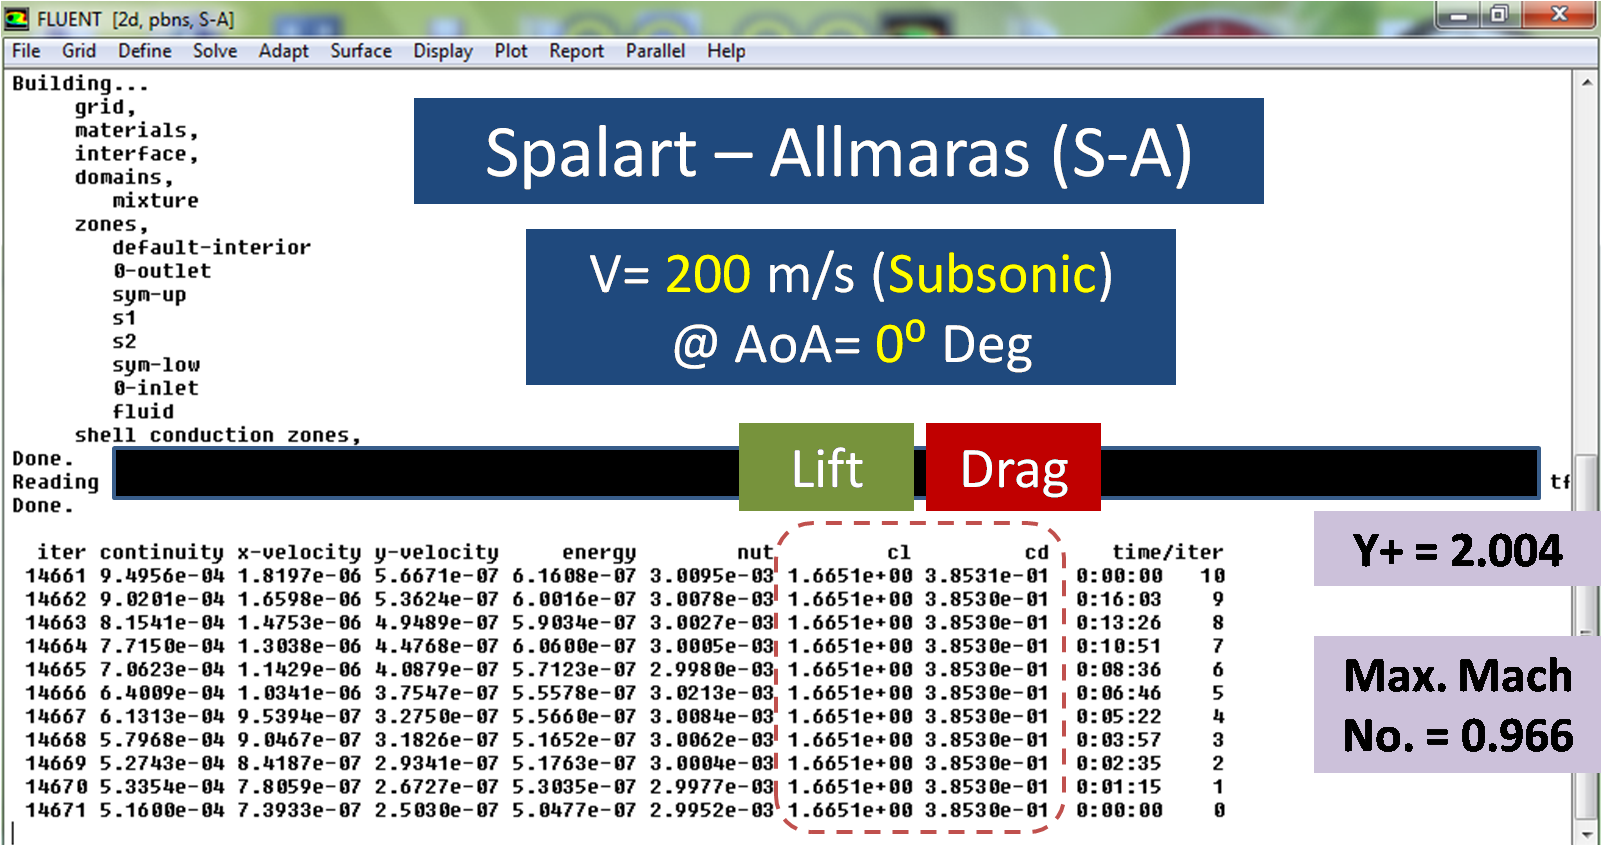
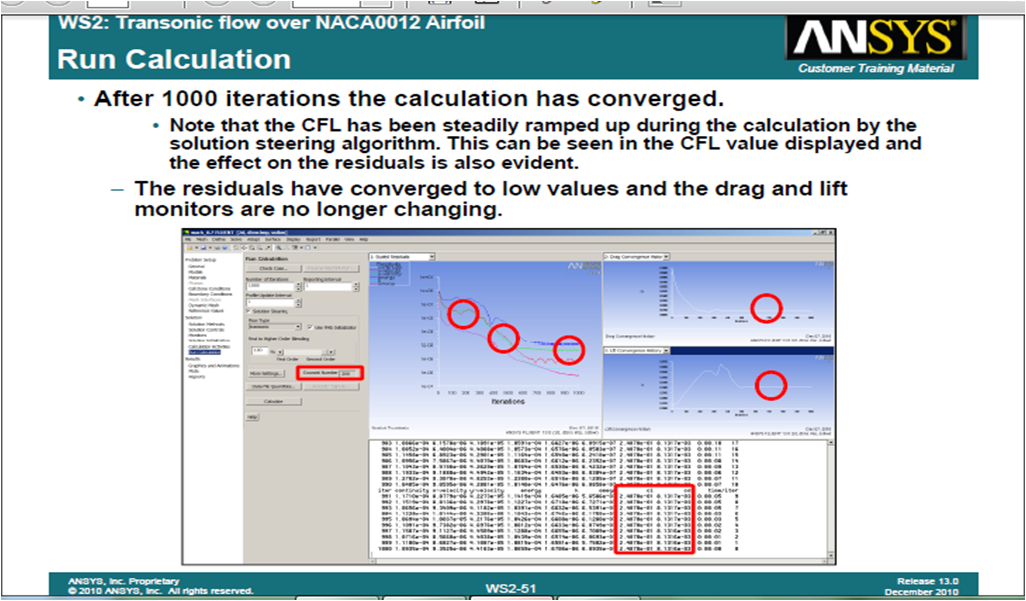
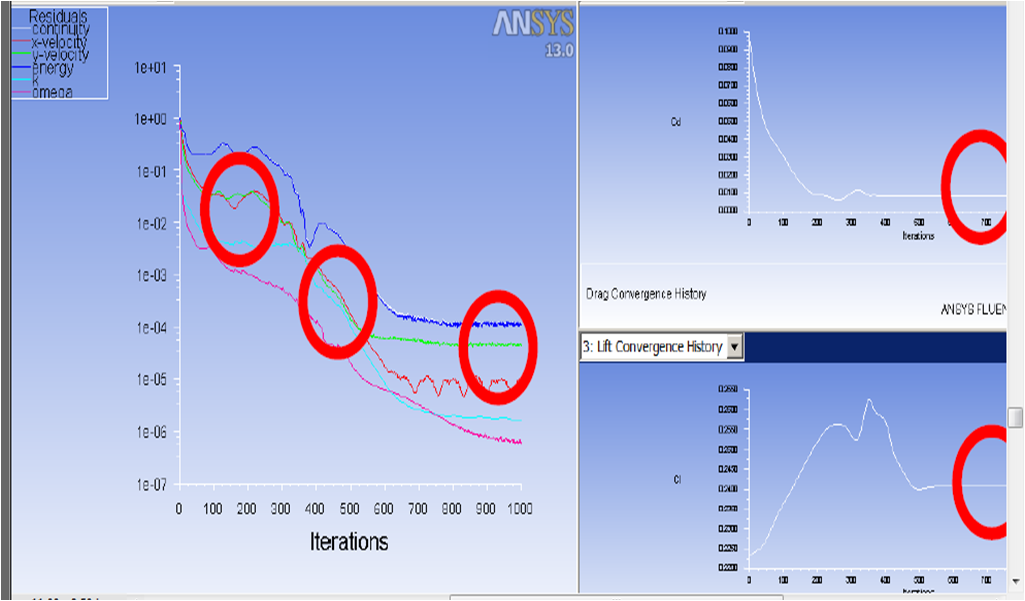
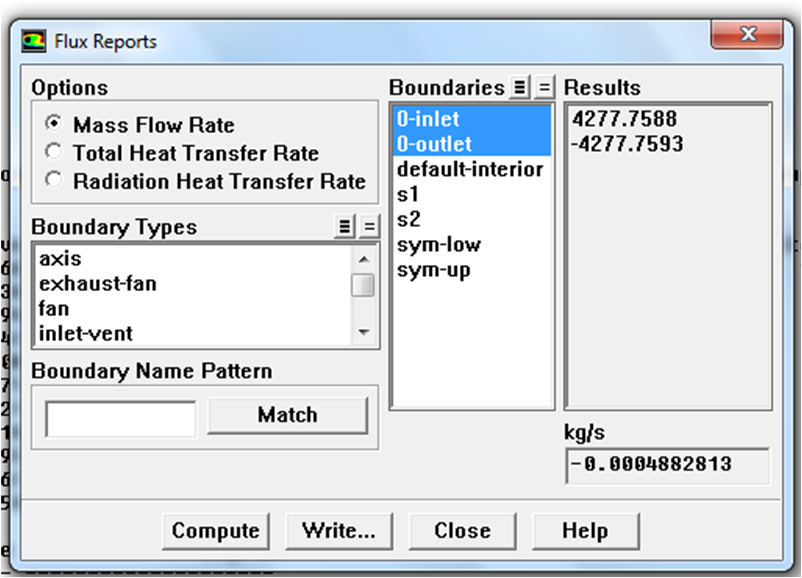
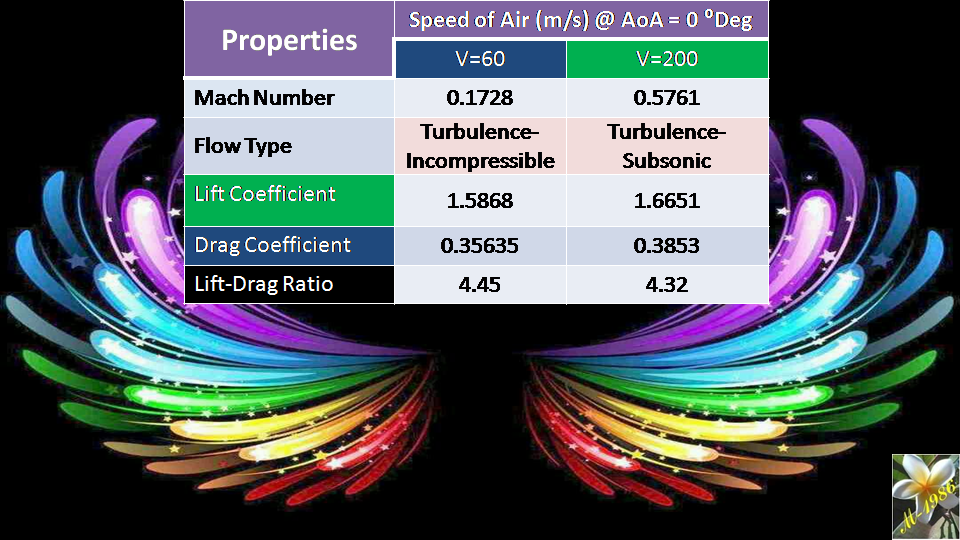
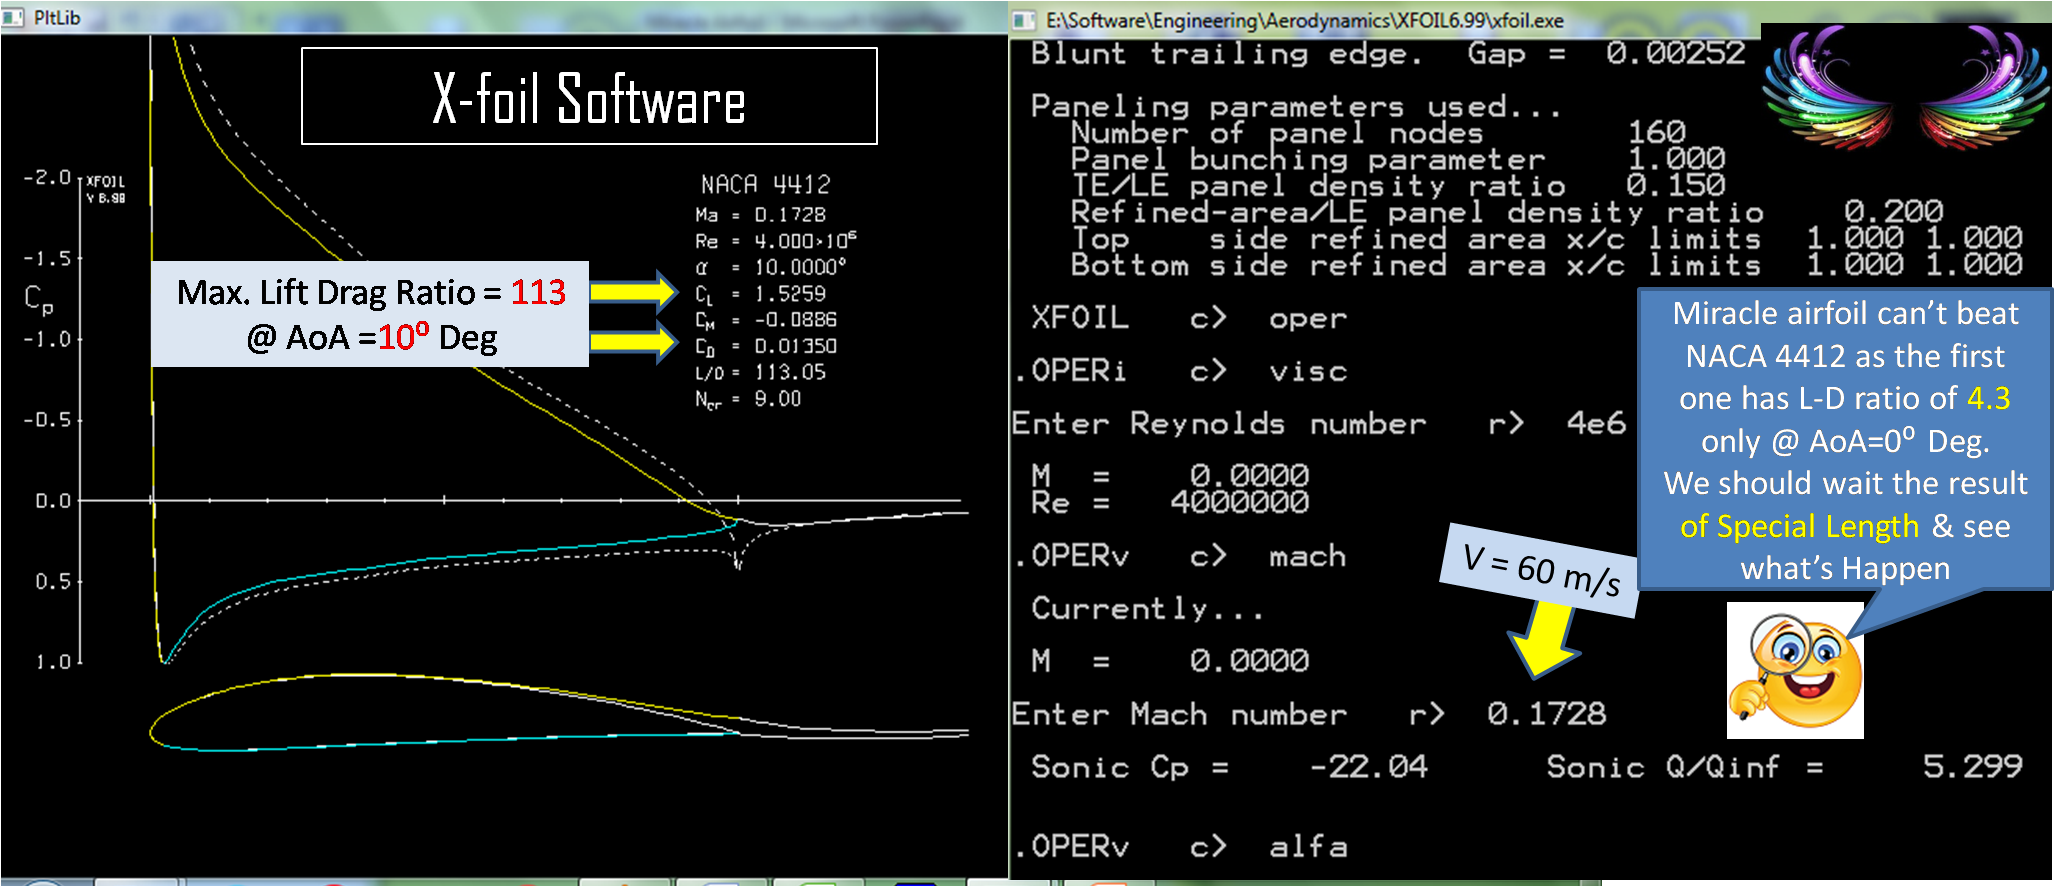
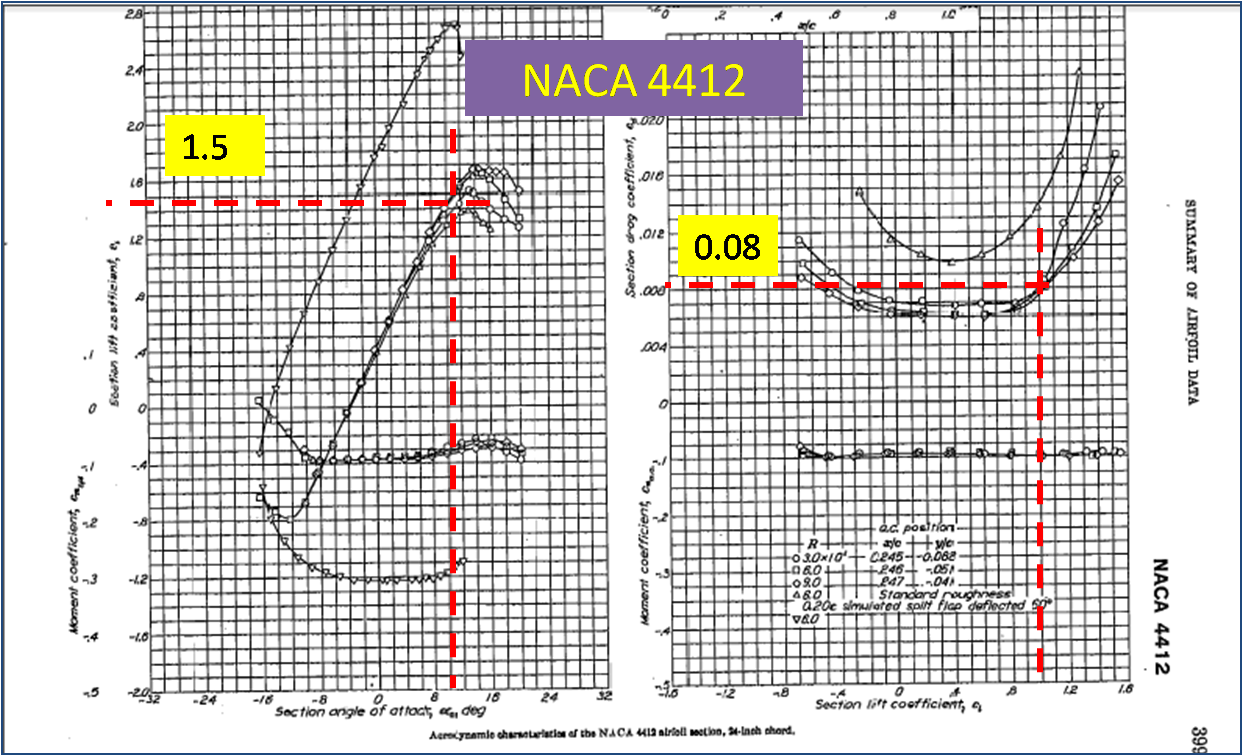

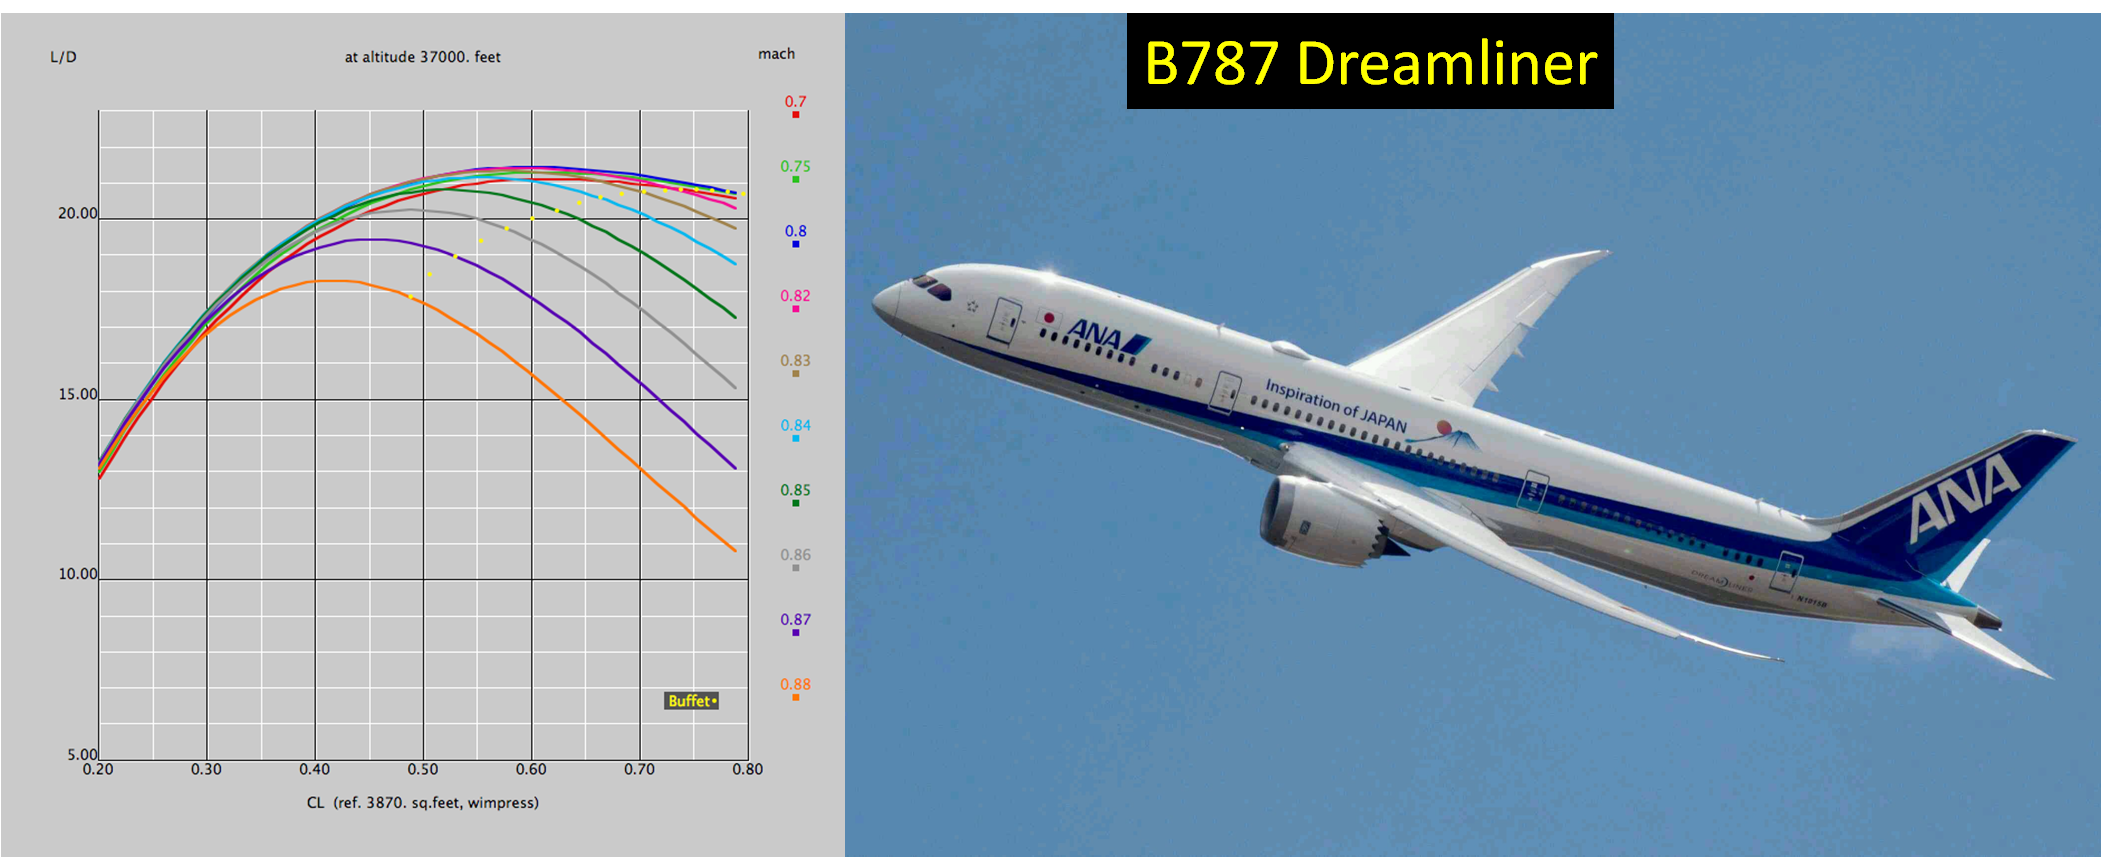

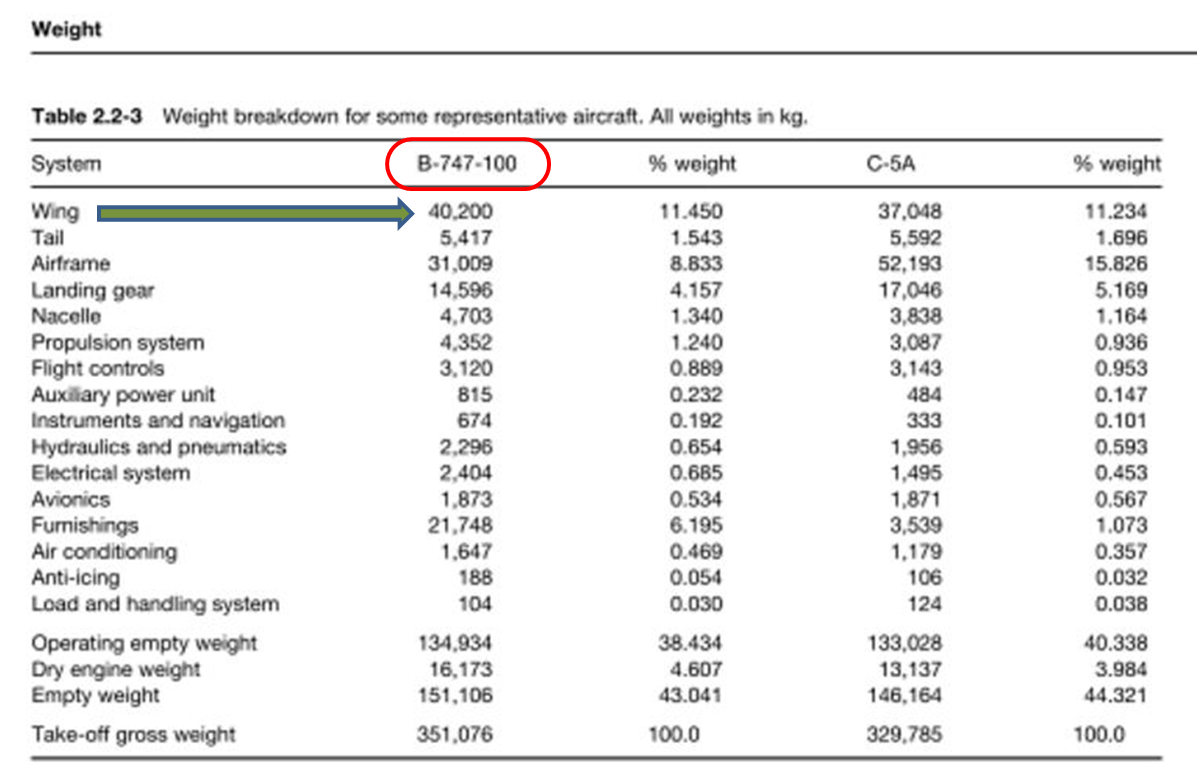
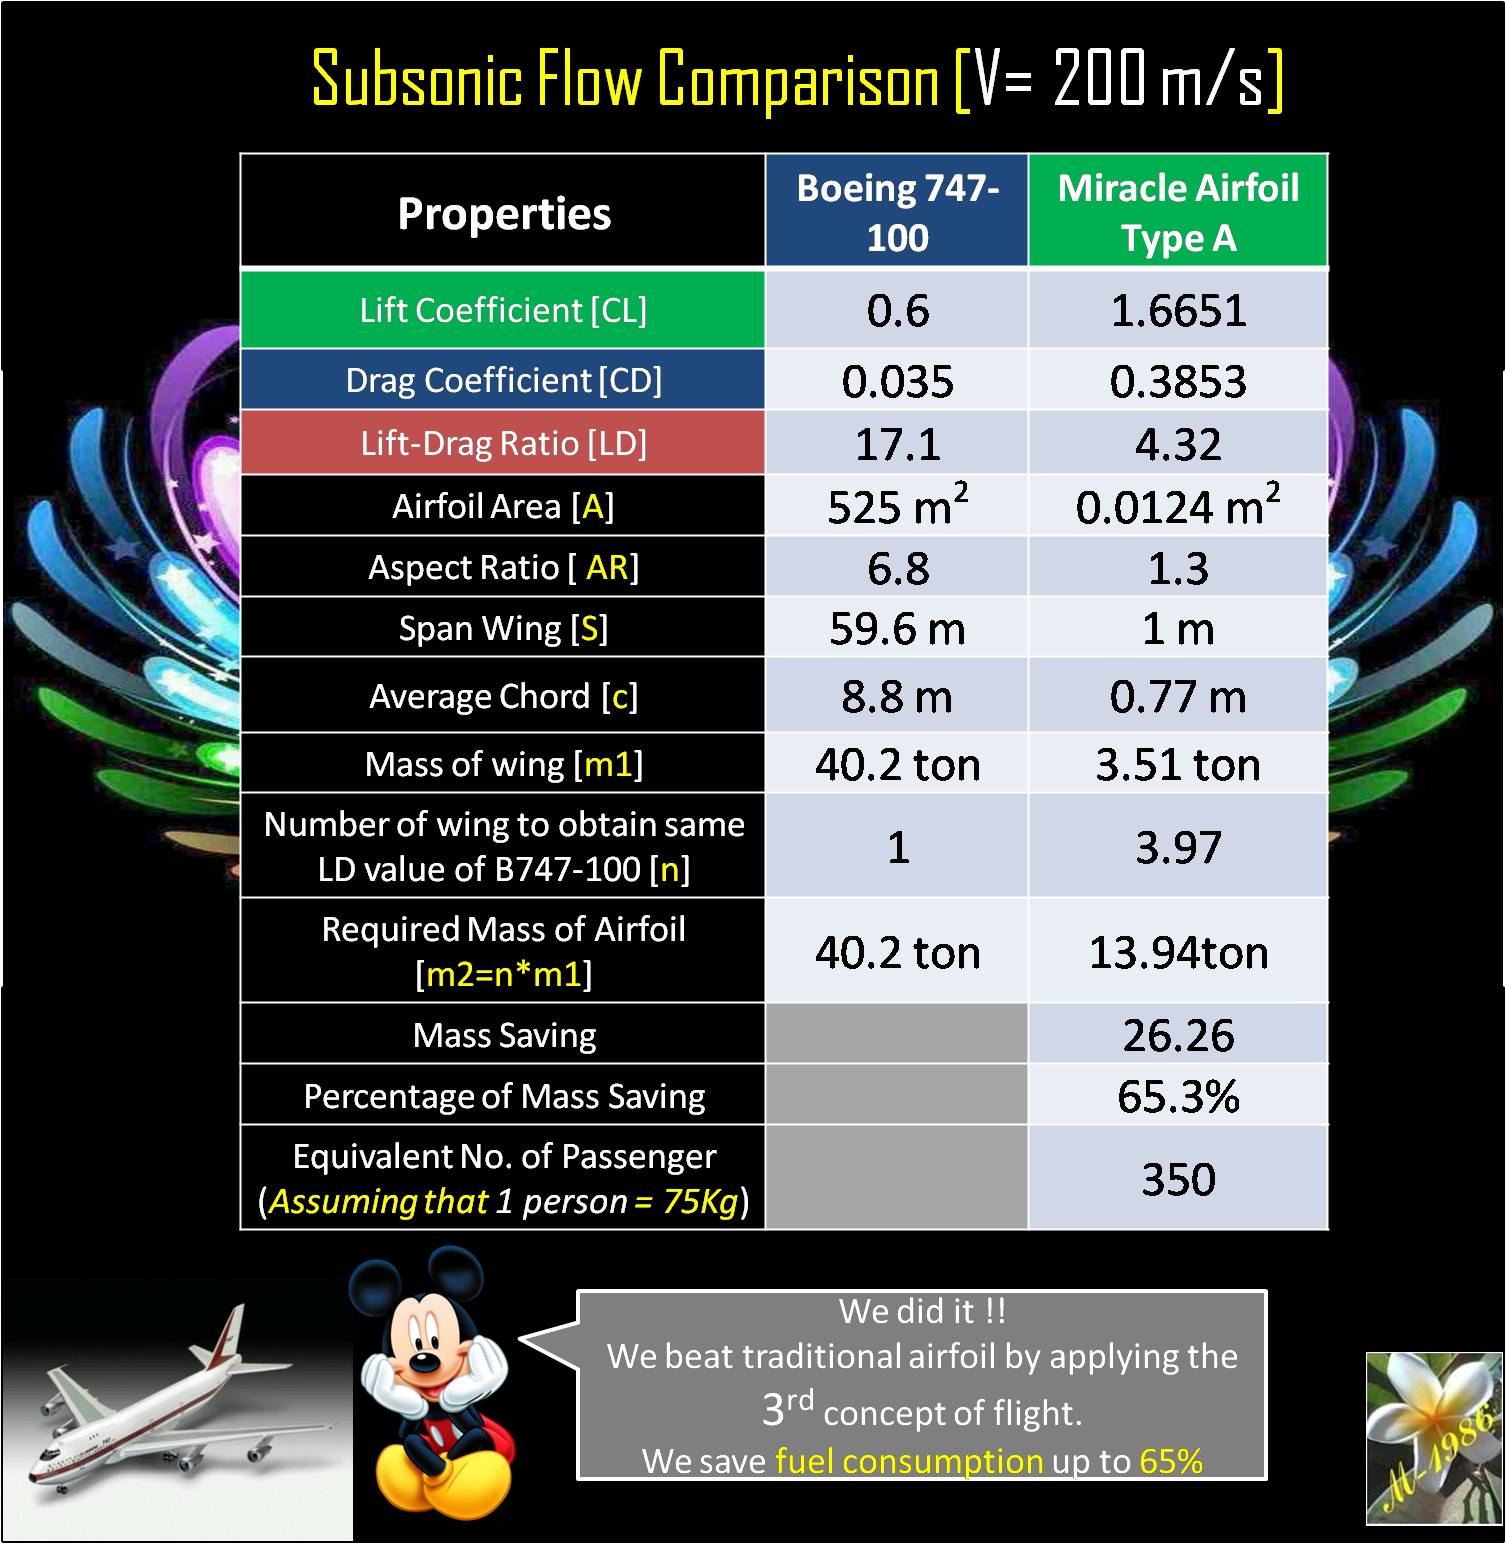

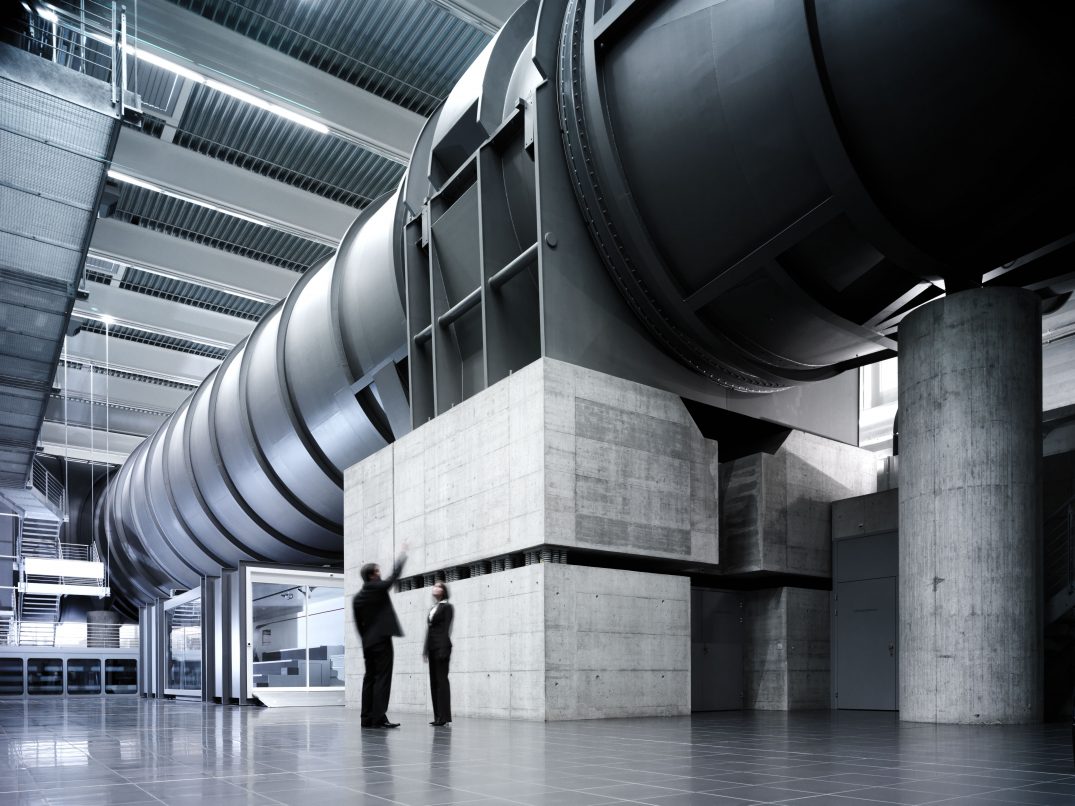
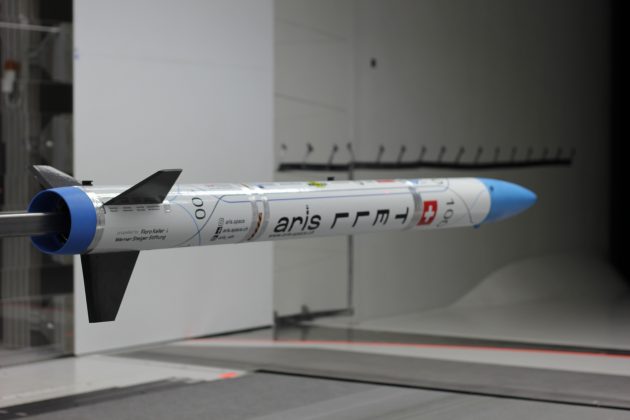
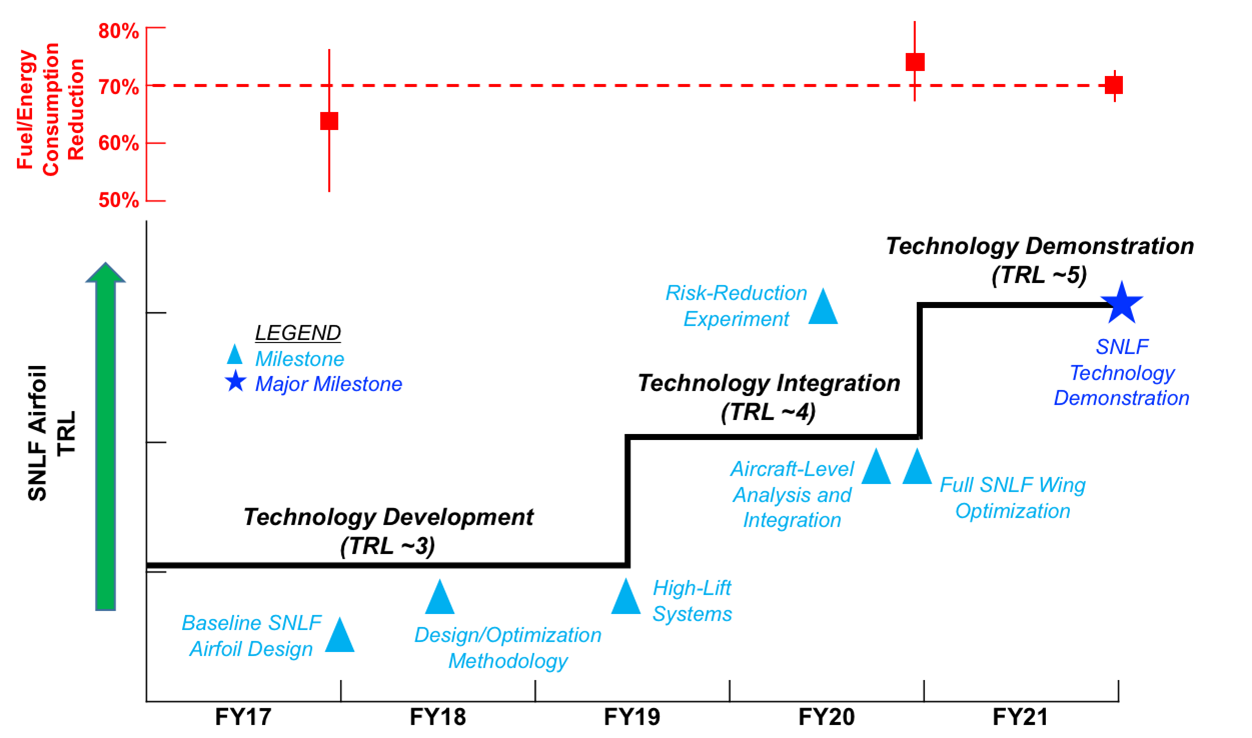


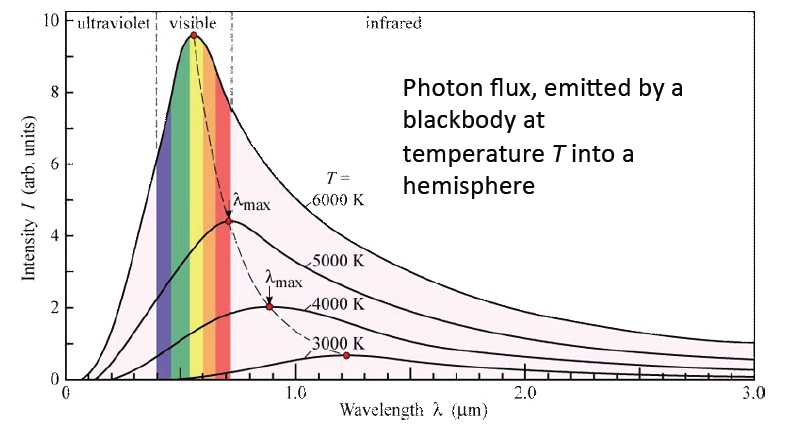
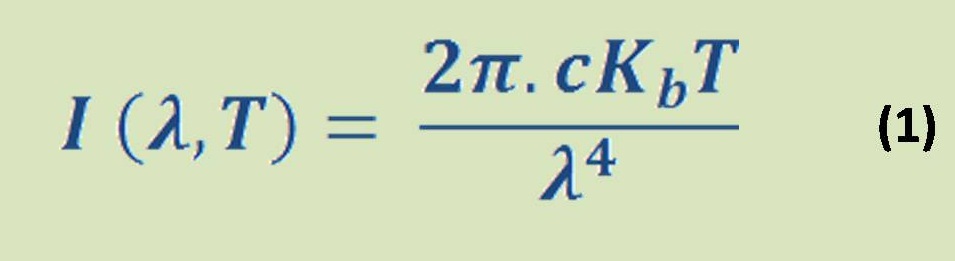
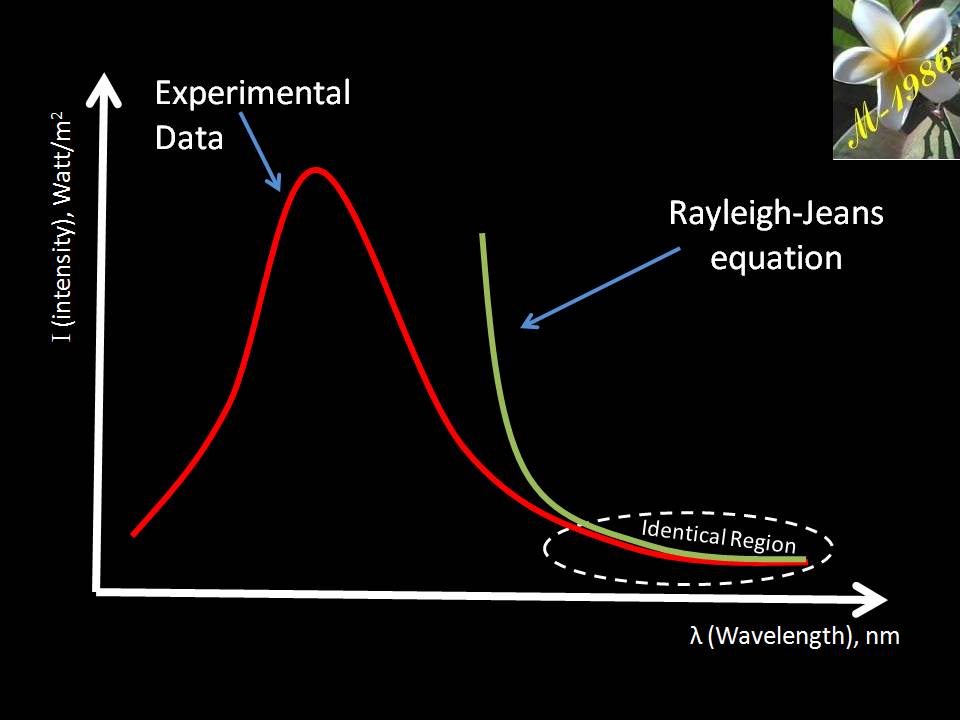


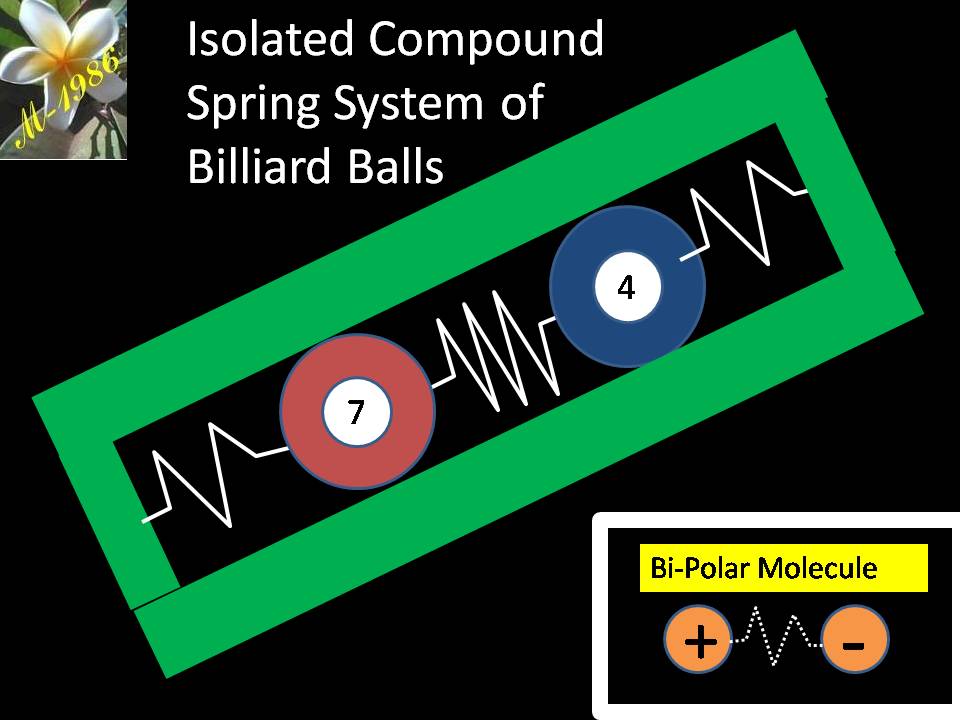
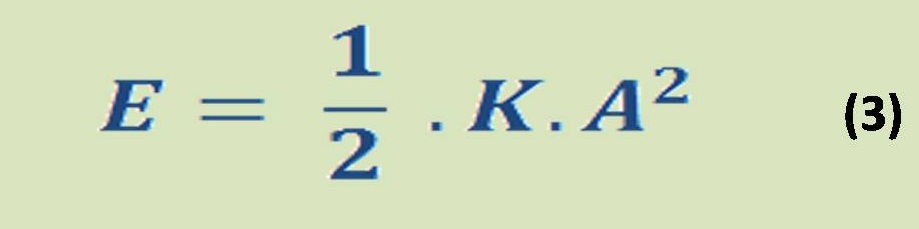

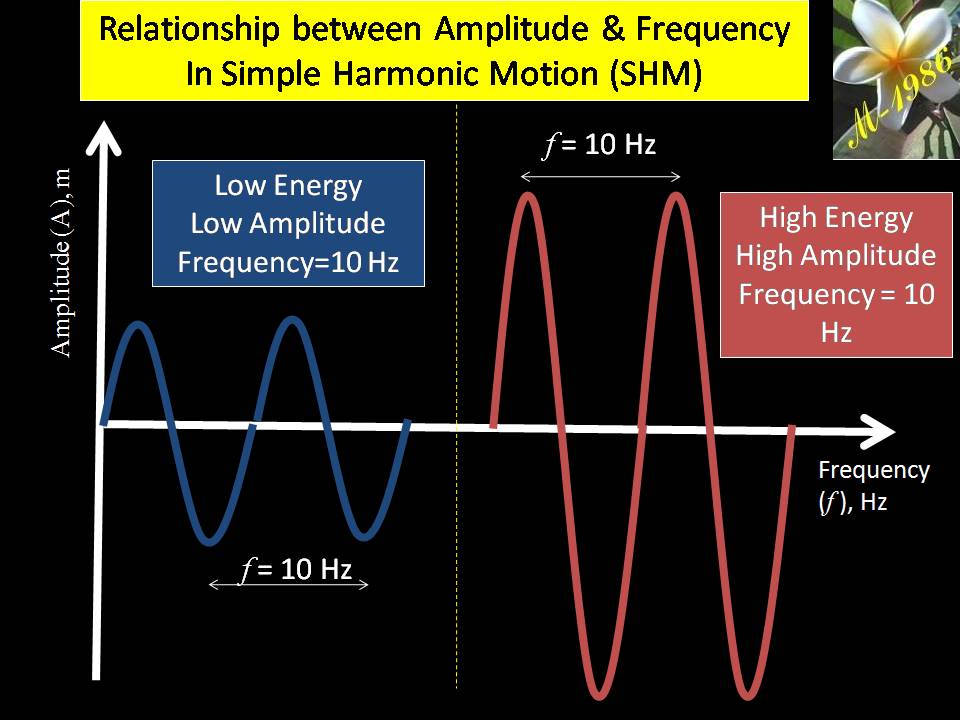 Figure (6) – Amplitude & frequency of Isolated system
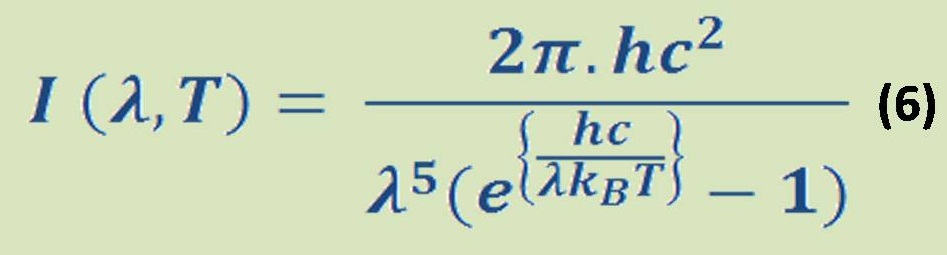
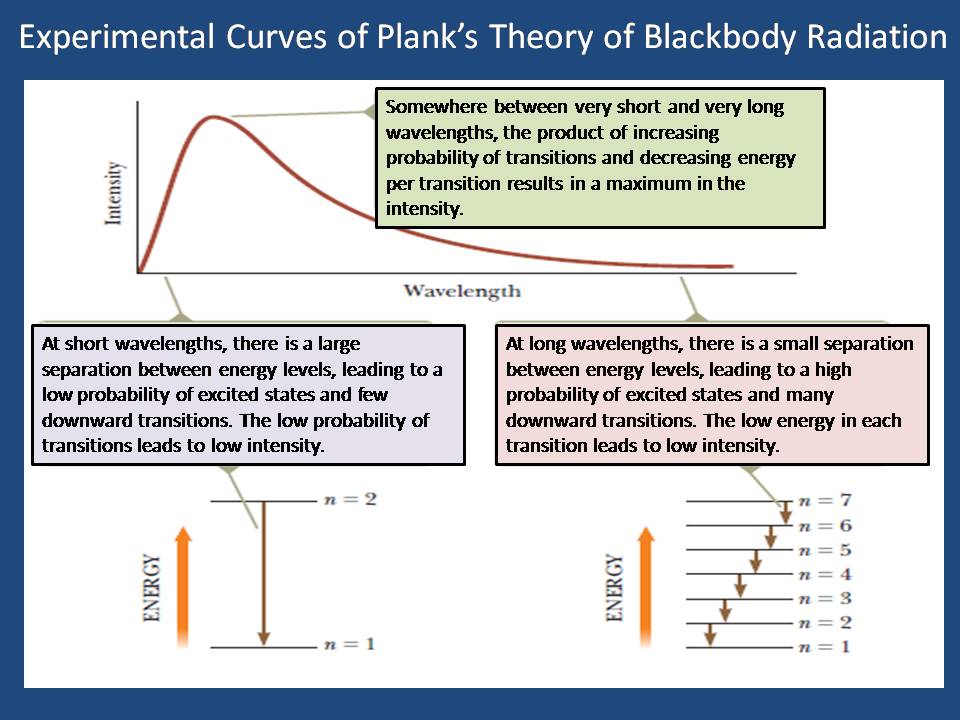
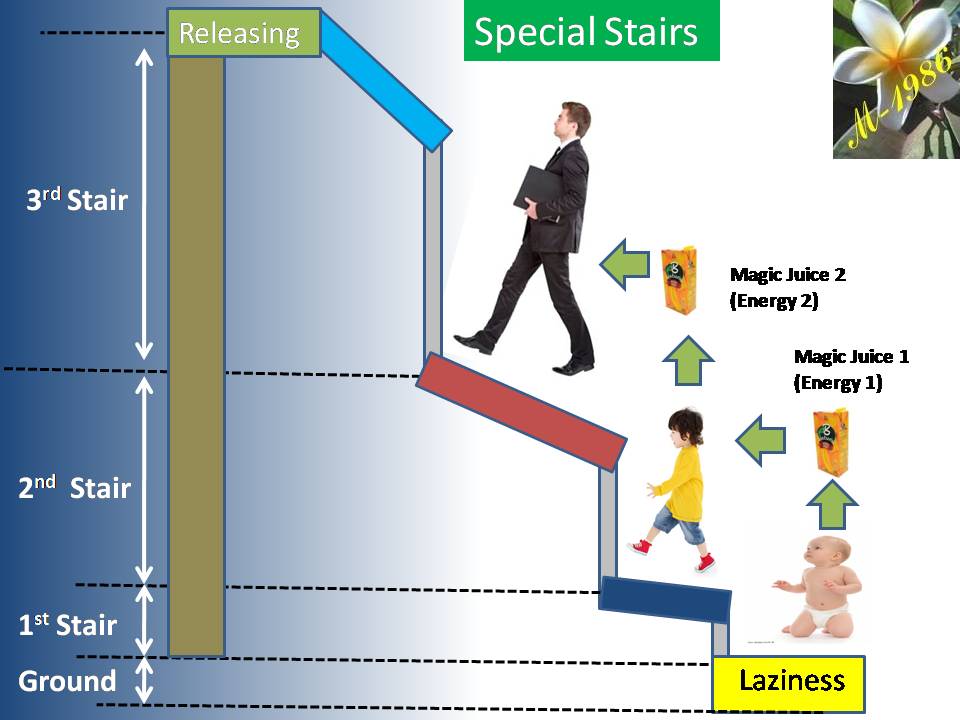
 Figure (9) – One of the Greatest Scientist of Humankind for 20th Century