These based-day notes has been published in my LinkedIn account under tag #I_got_hired_after_13_years_of_my_Graduation & I though it’s a good idea to collect them in one article. It will be updated periodically.
*******
Part 1
The Opportunity
Date: 17 Mar 2023
In my village @ #Sudan. there was a green houses project (a structure with walls and roof made chiefly of transparent material, such as glass, in which plants requiring regulated climatic conditions are grown) operated for years by Sudanese investor which have many administrative & technical issues which lead to low in production of one type of plant (i.e. cucumber). There were 3 out of 24 green house operated with troubles.
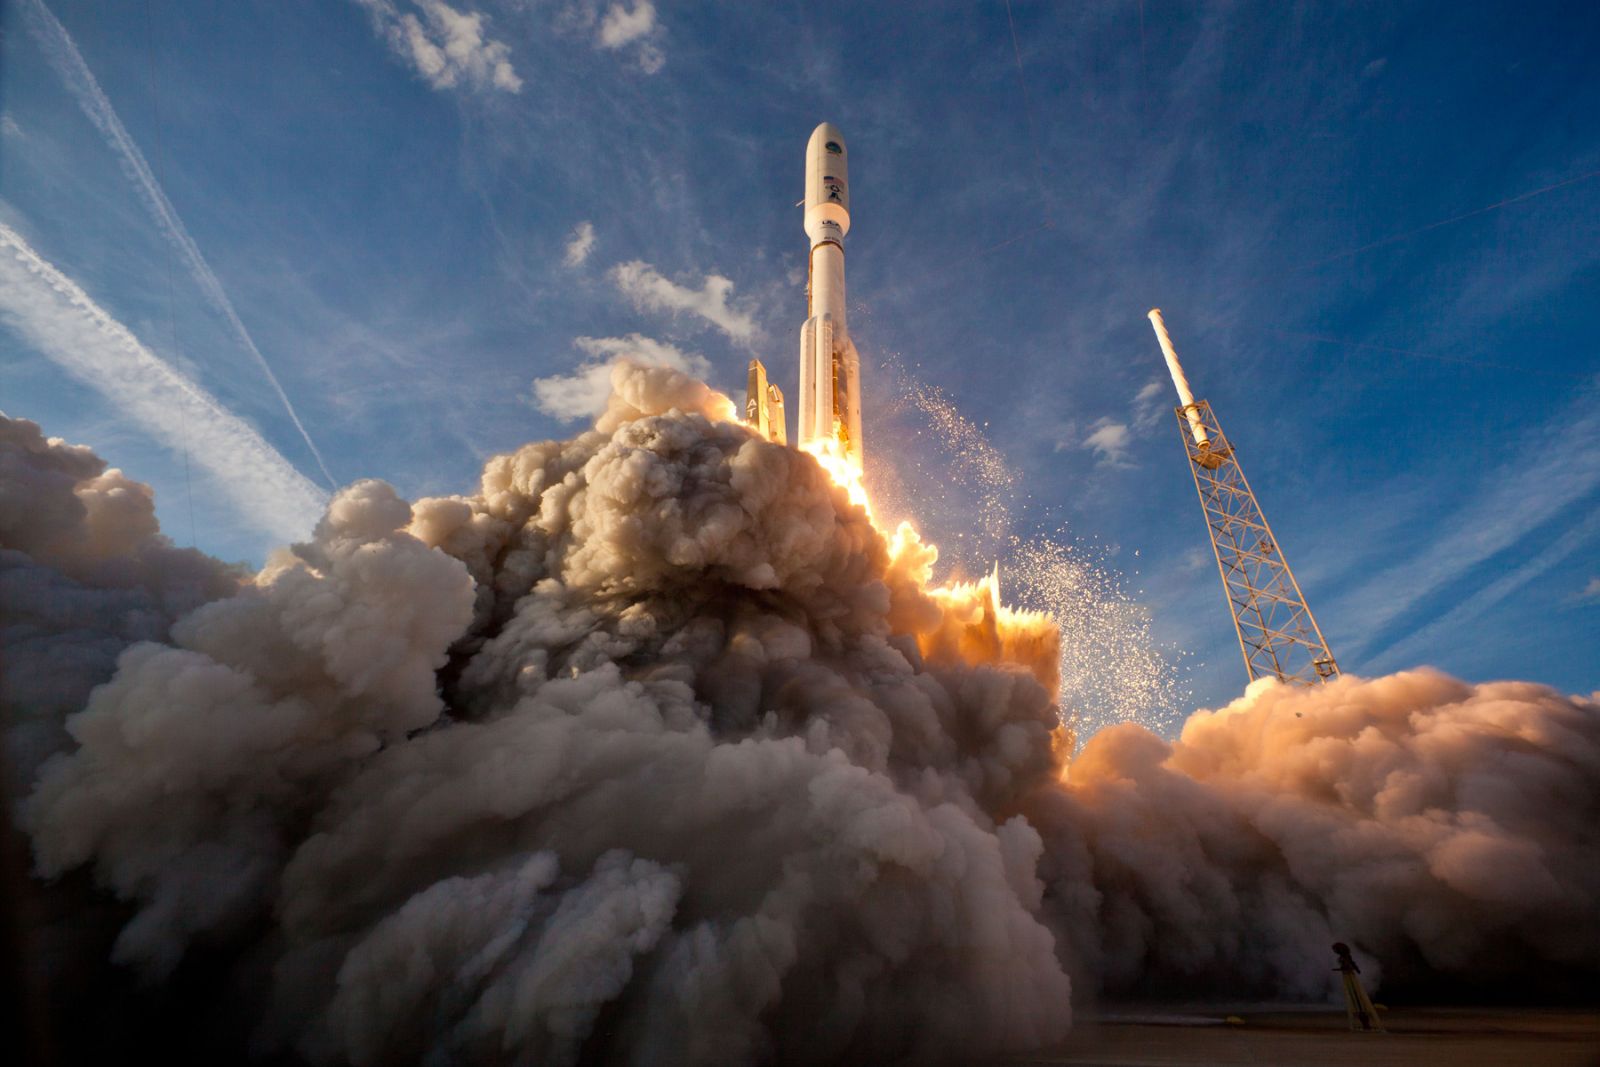
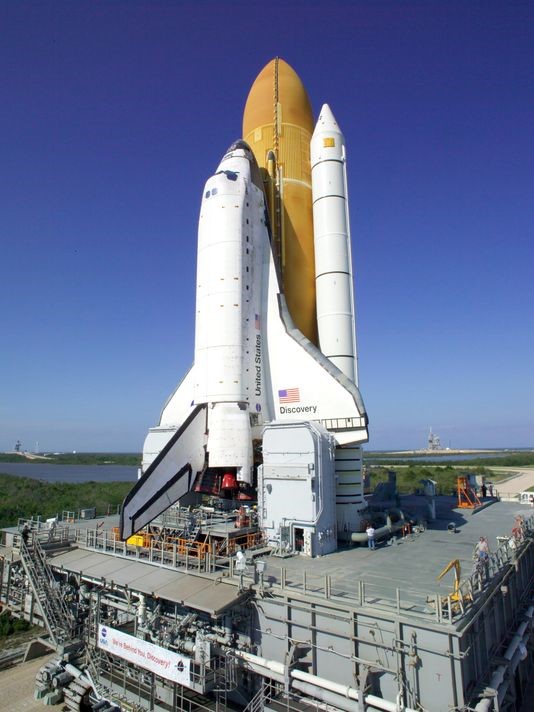
Figure (1) - Green House project in different country
Few months ago, Turkish investor has decided to rent the project & intends to improve the quality of operation & diversifies the production sources (e.g. pepper, tomato & strawberry).
Figure (2) - Types of Plants grown on Green House
In addition, he wants to use renewable energy (PV Solar system) for entire project (24 houses) & they need approximately 450 KW of electrical power. This is really another big project for Turkish investor. He is true dreamer & optimistic for making our life greener to use renewable energy rather than fossil fuel.
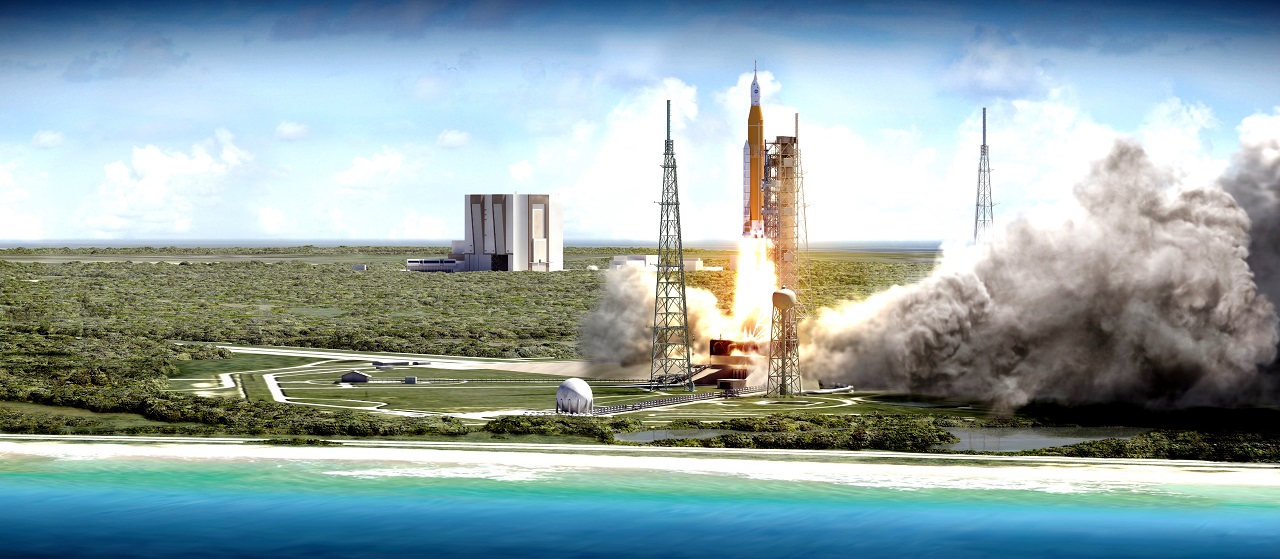
Figure (3) - Solar PV Farm
Last 2 week, my mother told me that Turkish company opening positions. I called a friend of mine who works in another company about them & told me according to his information, that they need only daily workers.
I was upset & I asked my-self why they don’t need an engineer for cooling pads systems, it doesn’t make any sense?!
I encouraged my-self to meet them personally to explain how importance of engineer in project.
On Tuesday 28 Feb 2023, I met the CEO. A*** **** who is a Turkish national. Very humble & nice manager that you ever seen in your life.
He was impressed about my C.V related to scientific articles that I published all those years & he was wondering why I didn’t get hired either in local or foreign companies/universities. He also admired me that I didn’t give-up my scientific passion after all these years of jobless status.
He let me to come by the project as volunteer to see how thing works as they need now workers to build other remaining green houses & I can’t afford it for physical health issues. I couldn’t miss this opportunity to apply what I learned in university.
While I was in volunteering period, I realized how many technical issues that affect negatively in the project & wrote reports to CEO directly which he was happy for it.
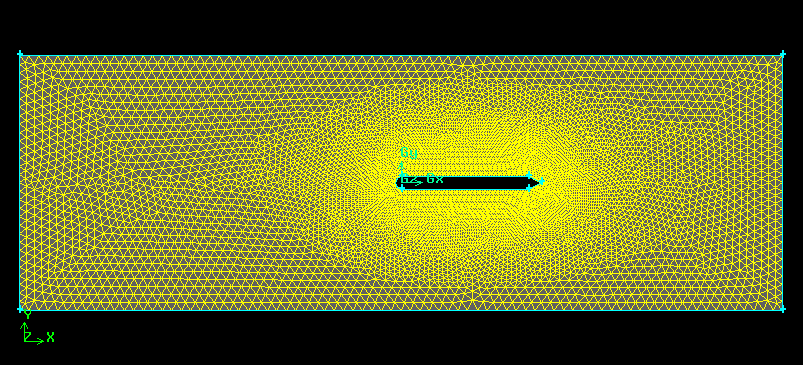
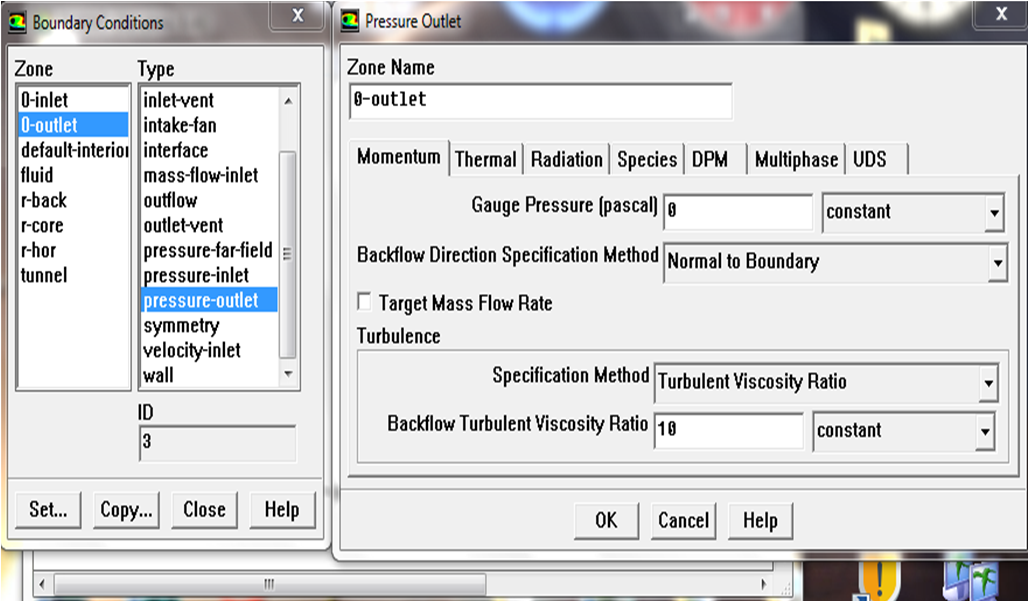
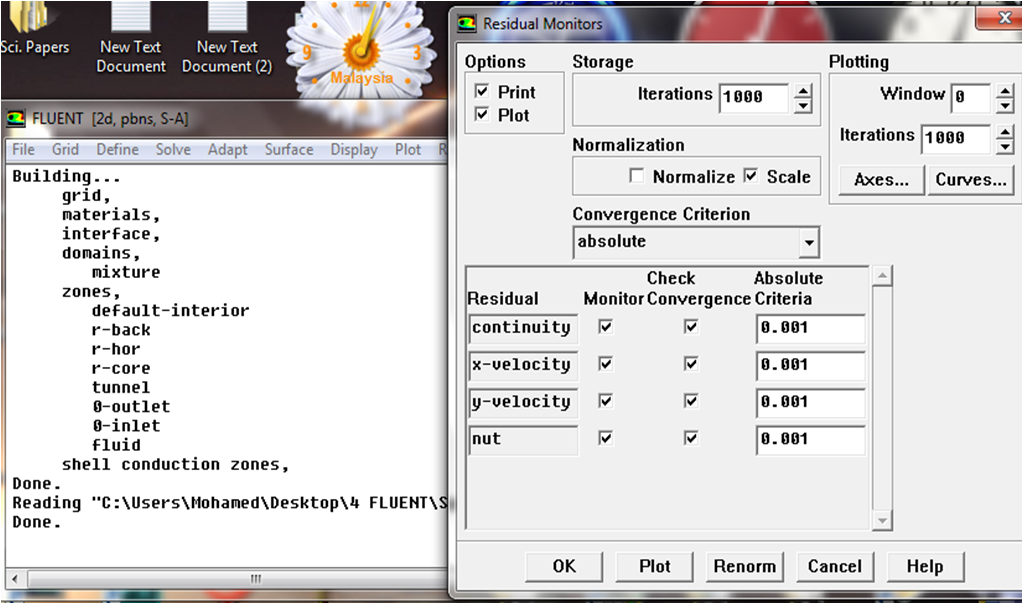
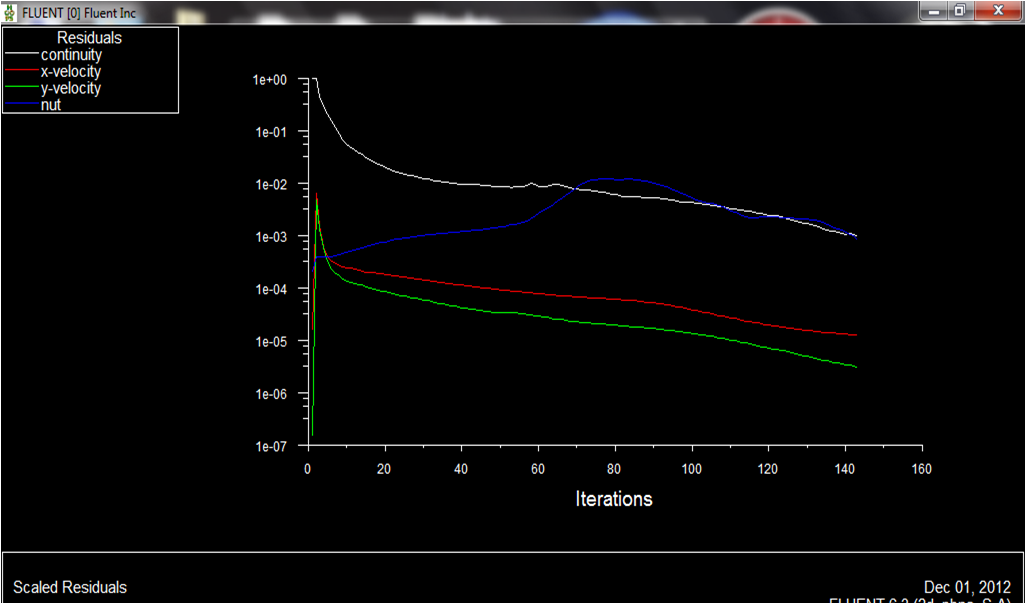
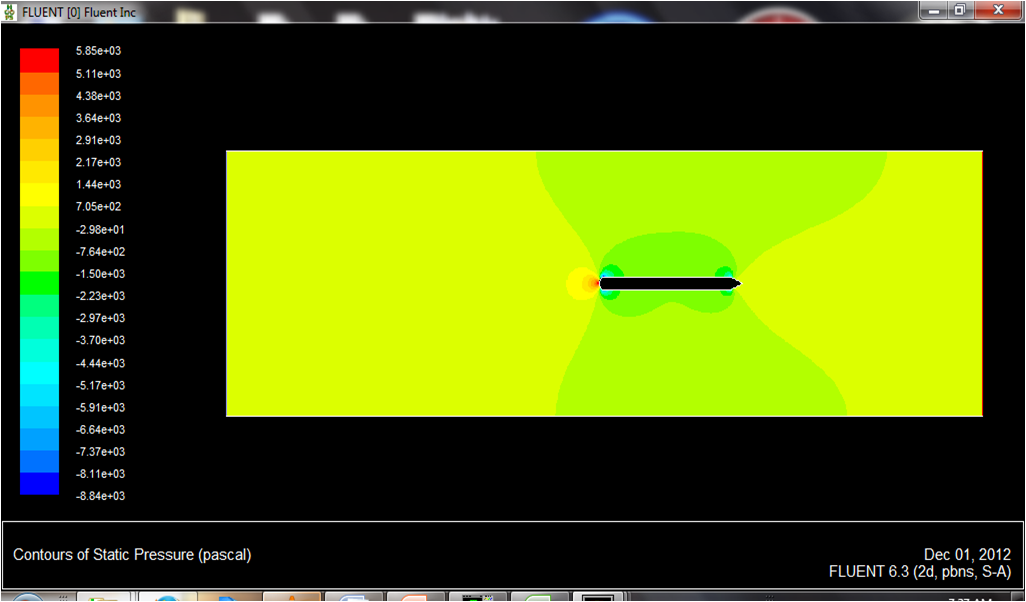
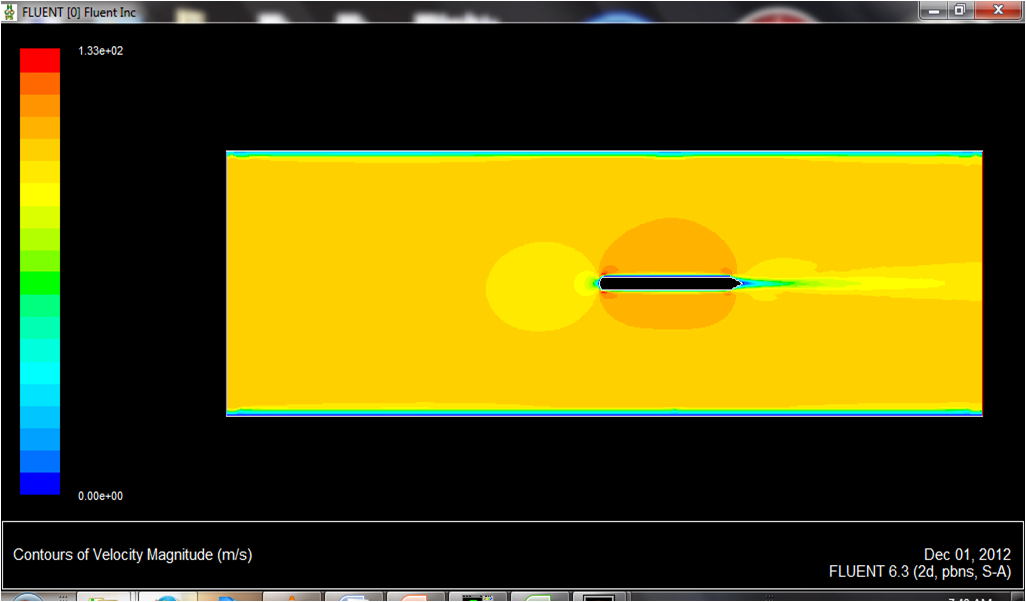
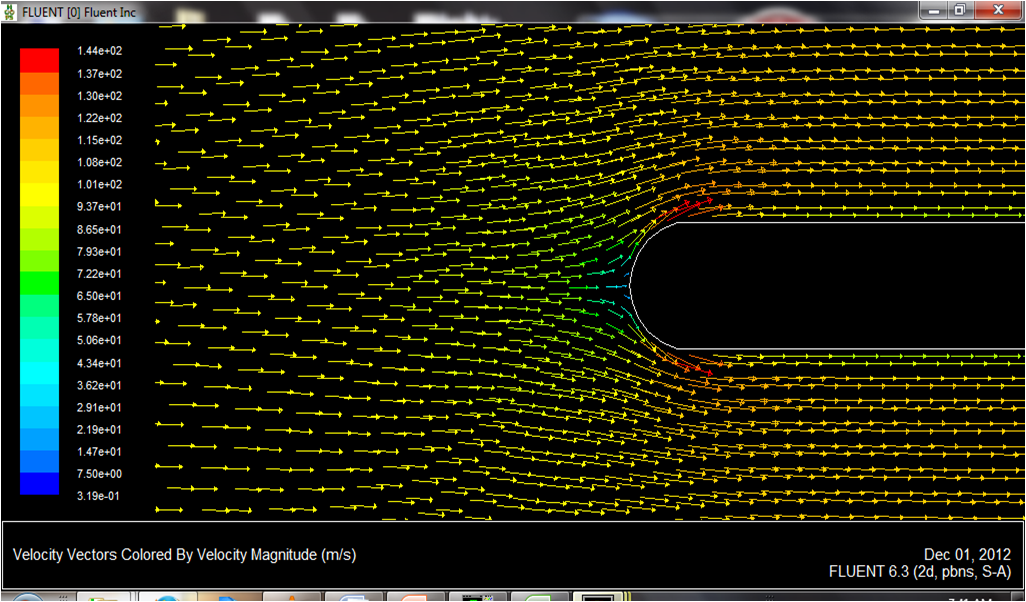
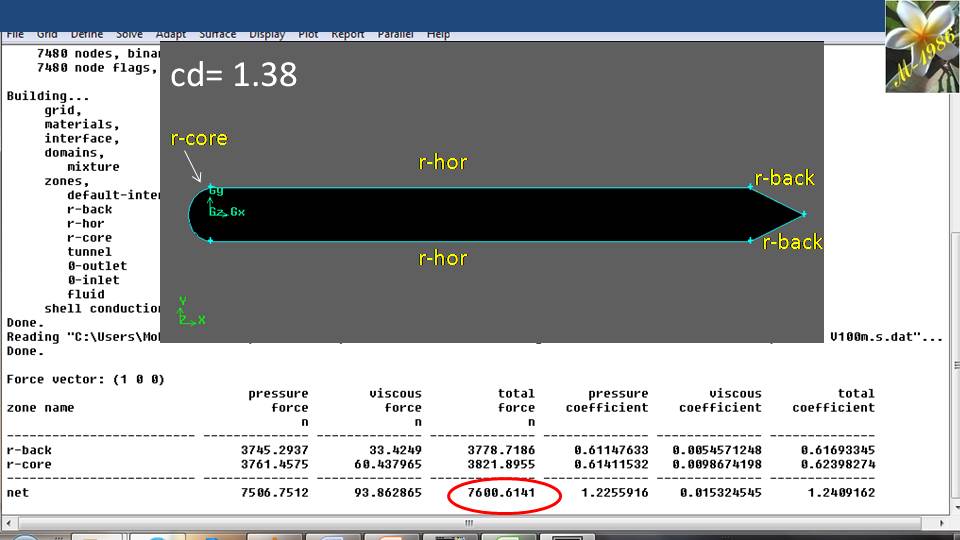
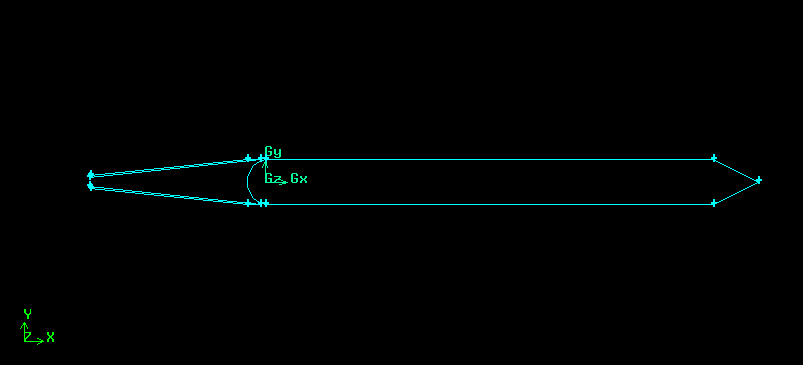
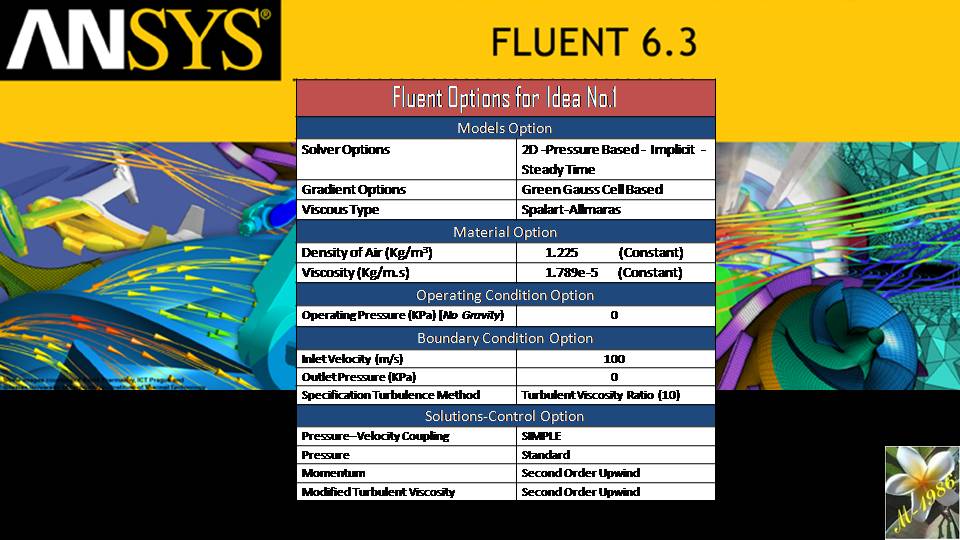
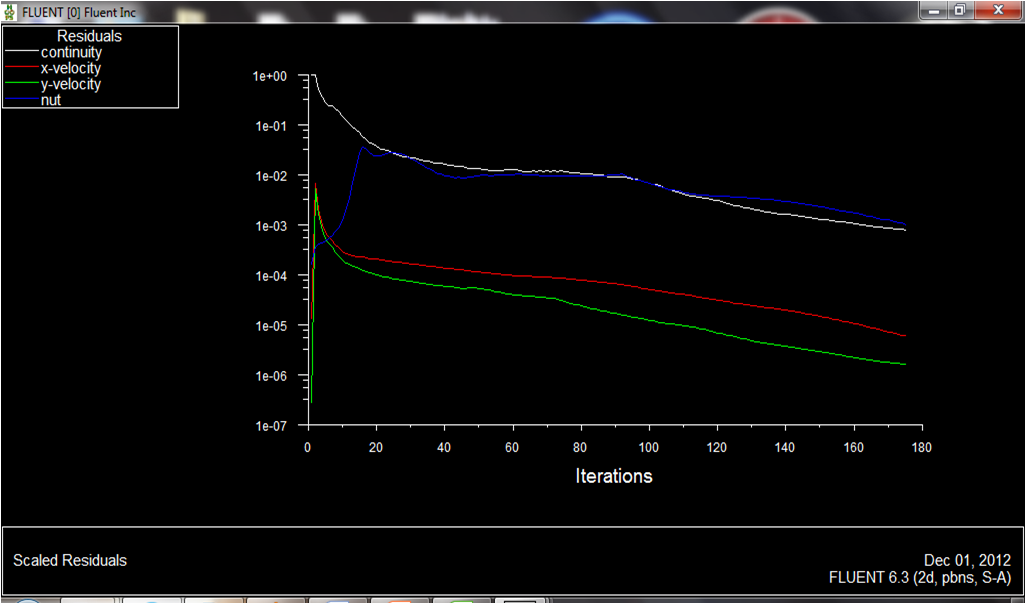
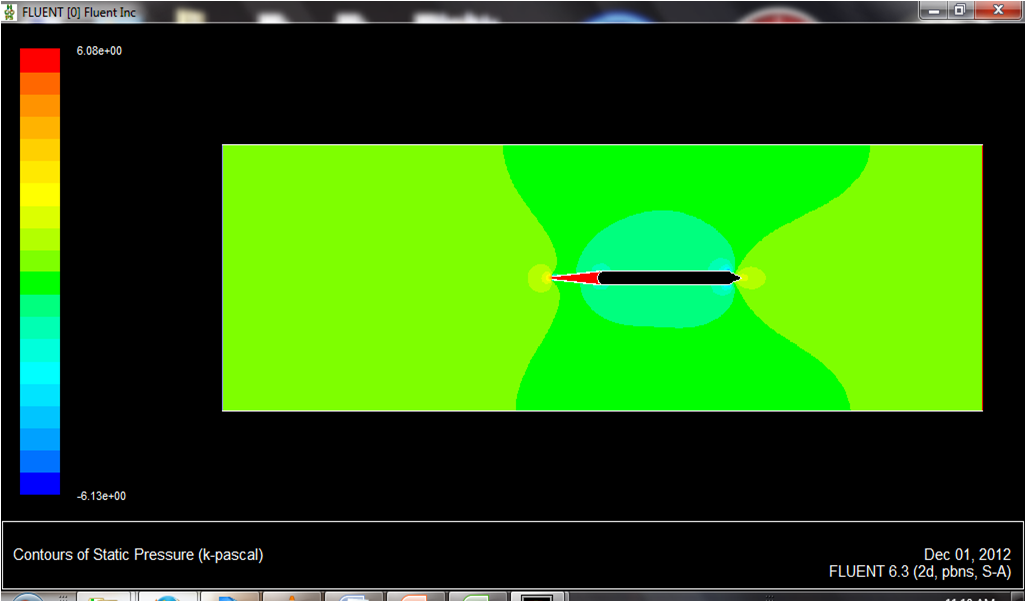
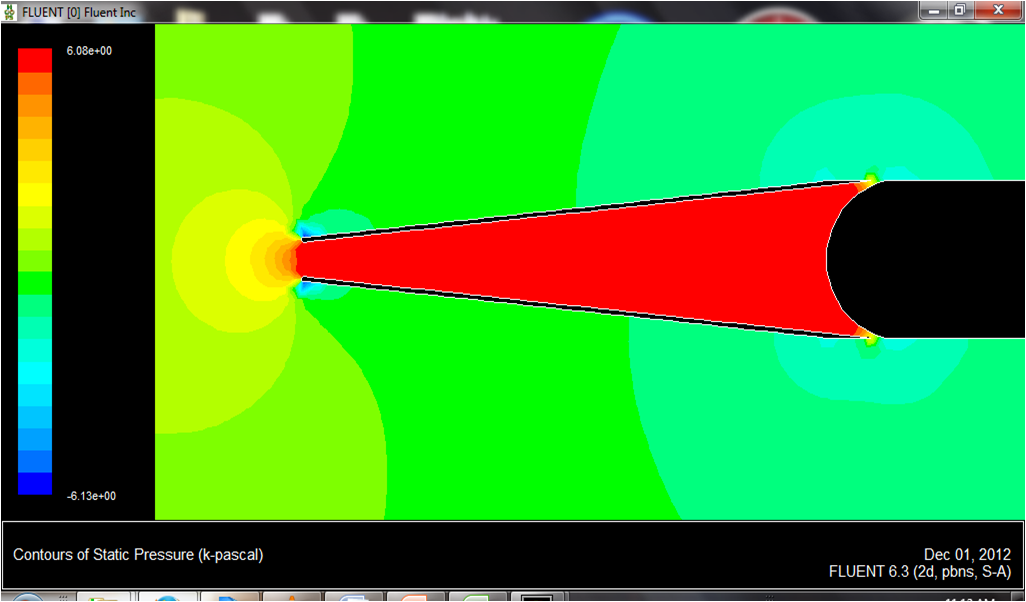
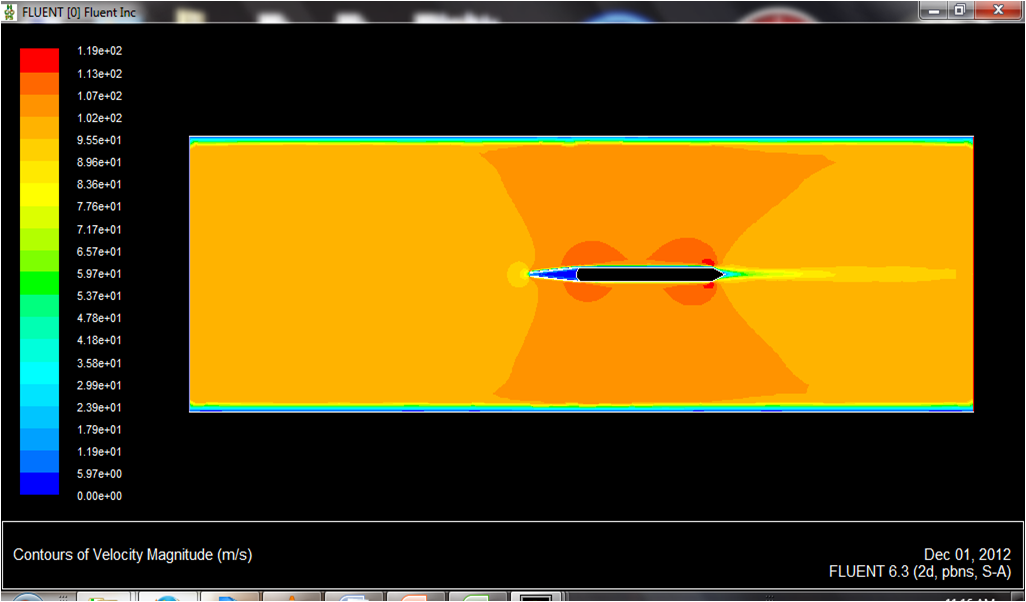
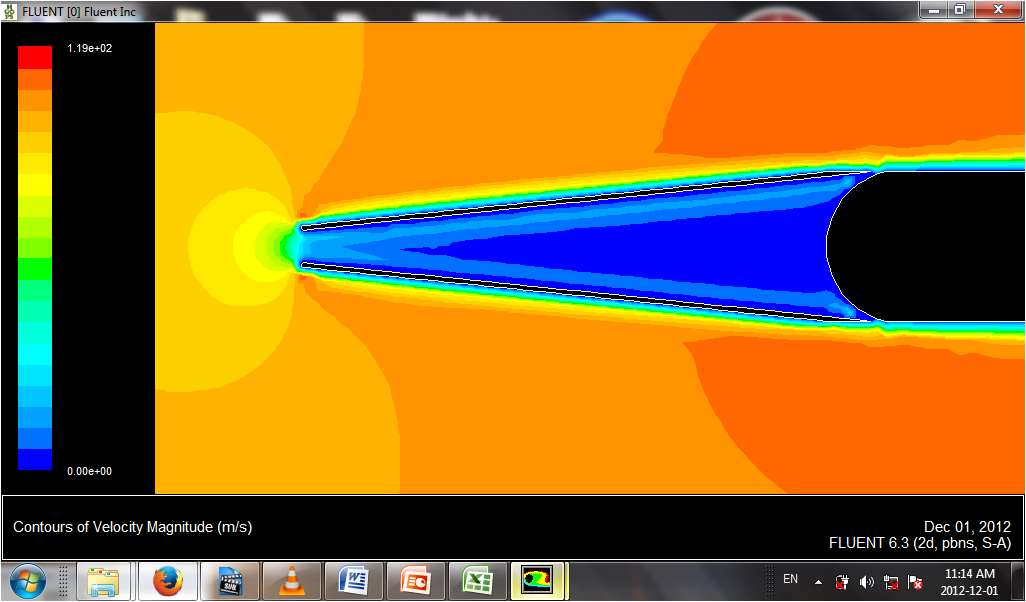
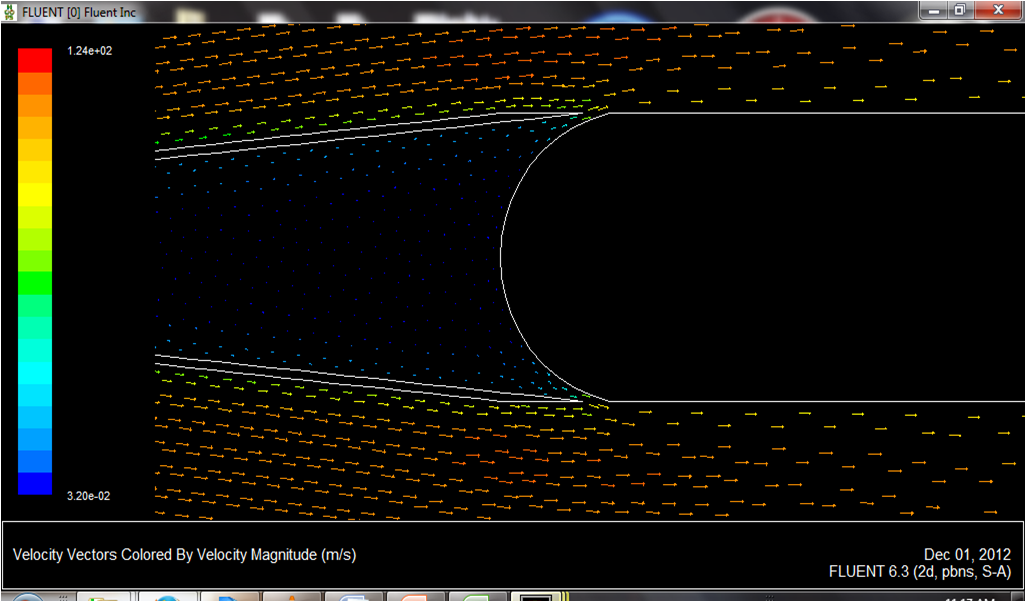
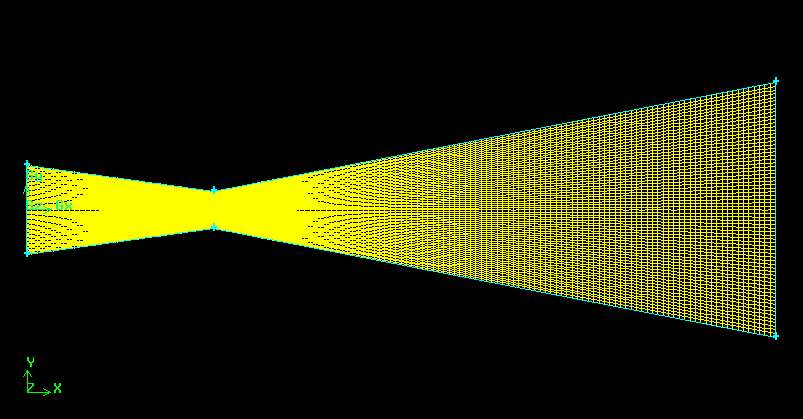
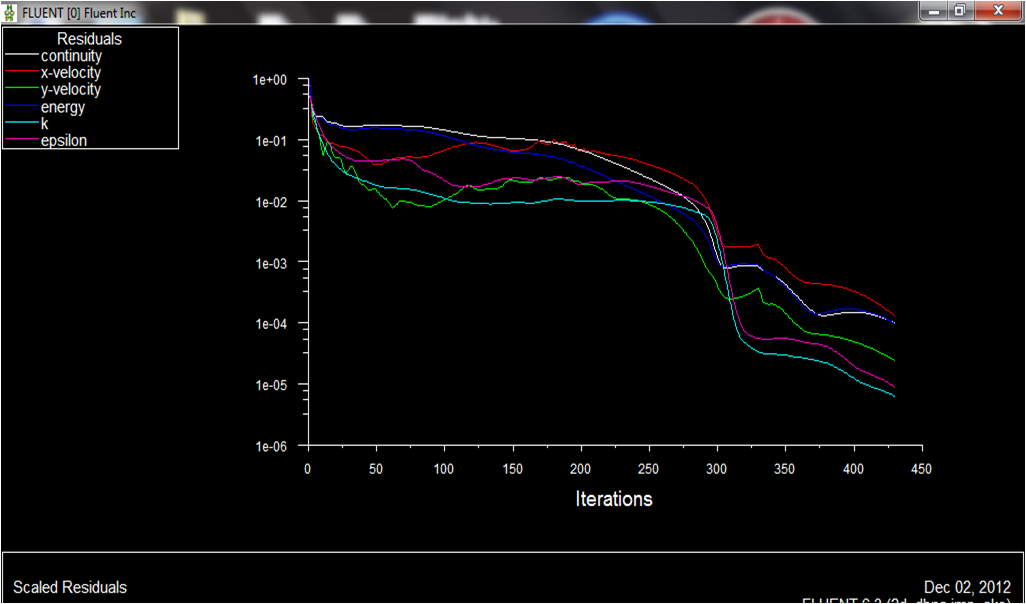
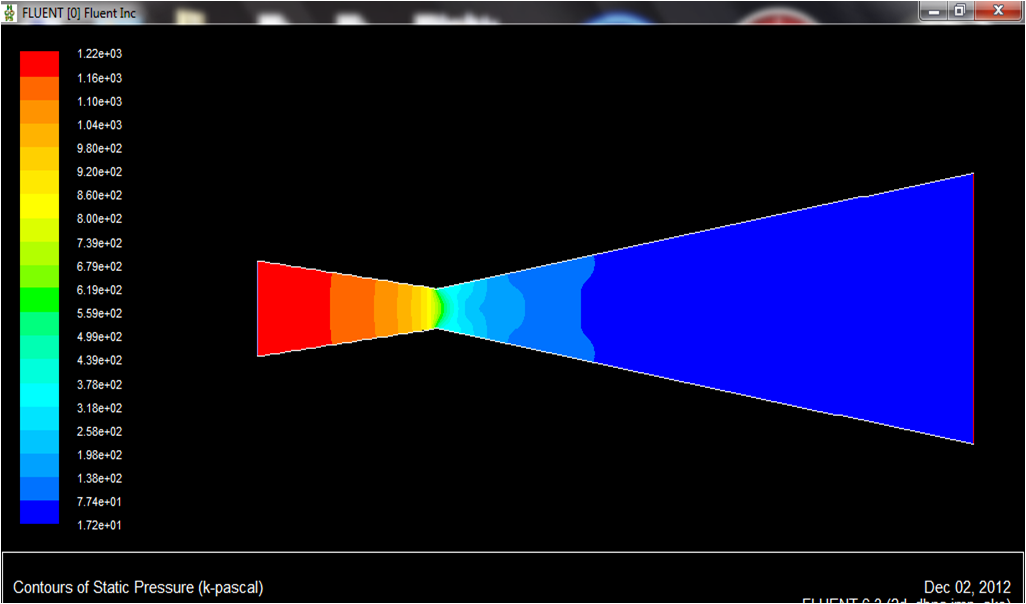
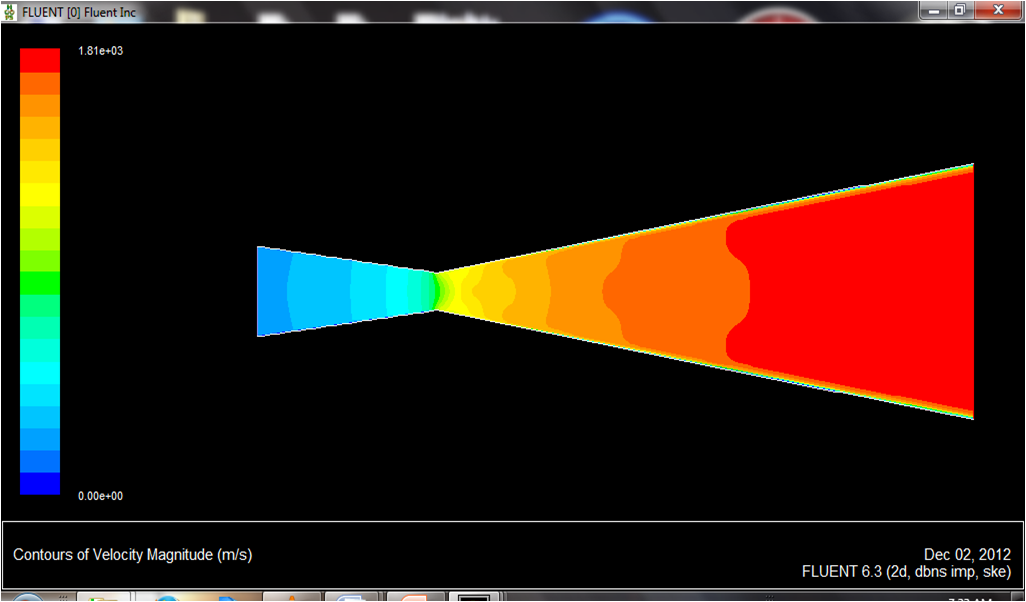
One of things that I proposed to him, was related to improve the air flow of air inside the structure of green house using engineering simulation software Fluent ANSYS.
Traditional house will have a stuck hot air in specific spot (blue color in photo) which affect on growing plants. Using triangular shape will solve the problem.
Figure (4) - Effect of traditional & improved design on air flow inside green house
He was smart, intuitive &quick learnerCEO, as he suggested immediately about cost analysis of the idea to know exactly how it affect in economical feasibility study.
This week, CEO phoned me to get hired. I was really happy. I’m now energy consultant for Turkish green house company.
I hope it will be my opening door for the future of new energy technologies for humankind.
To CEO: seni hayal kırıklığına uğratmayacağım
To be continued
*******
Part 2
Heat is your Invisible Investment
Date: 24 Mar 2023
Capital venture & angel Investors in any agricultural projects wants to reduce their daily expenses by anyway but they always don’t consider the effect of heat inside the green house.
Why?
Because they think you can’t do anything about it & pour money on it to solve it is waste of time.
It’s similar to the group of people who don’t believe in climate change as they called it a “Hoax’ because it is a normal cycle of nature.
Also, they believed that the basic purpose that big environmental institutions & corporations need money for their hidden agenda to keep running their bad business.
Figure (5) - Green House Gas effect
So, they made-up that allegations by controlling international media that climate change is true & we should fight it (we need money to save our planet)
The science doesn’t lie.
What happen inside green house is same for the earth.
Infrared waves will trapped inside the green house & that’s the reason why we should change the air by using exhaust fan to let cool air enter from cooling pads which is used water pump.
Figure (6) - Effect of Solar Radiation on Green House
You can let the fan working 24/7 as easy solution to maintain high production but it will cost you too much money in long terms.
Or, you can use many advanced energy saving technologies such as: digital climate controller (temperature & humidity sensors) for fans & pumps, economical light system, automatic thermal screen system, cooling the ground of house, insulated thermal materials, … etc.
Figure (7) - Automatic Control in Green House
Expensive & complicated but for long terms you will realize it is worth it, if you prepare excellent economical feasibility study.
Doing that may reduce the bill of electricity up to 50% either from national electricity grid or back-up diesel generator which definitely will make the VCs & angel investor more than happy for the improvements that had been made by the team of dedicated & talented engineers.
To be continued
*******
Part 3
We hate Mathematics for a Reason
Date: 7 Apr 2023
When I was in the 2nd or 3rd level of my university studying (2006/2007), one of diligent students asked mathematics lecturer outside the lecture hall about the meaning of Calculus in our daily life? (what’s the real purpose from it)
I was with them that day and I answered spontaneously, that: “we can calculate the center of mass of any object”.
My lecturer nodded with closing eyes of my answer & I was happy that I was correct. My schoolmate was chocked about it.
Definitely, there are many things can do by using calculus such as calculating the area & volume for any complicated objects.
Figure (8) - Center of Gravity on Racing-Car
In that period of my life, using internet was not a common practice to everyone in Sudan, and when someone has a laptop, he/she own Ferrari car. (Very strange)
So, I went to the college library to read more about my engineering studies & sometimes to increase y knowledge about other subjects (e.g. mathematics, physics, chemistry, , ..) which it didn’t belongs to my university study. I really get thrilled when I see colored textbooks which is helped me to understand more than white & black one.
Majority of people hate mathematics because they feeling it’s boring & rigorous numbers only without any action in our real life as we thought.
In my opinion; it’s the mistake of educational system of the country which they didn’t give them a reason of the importance between the theory & practice in daily life to believe in science as cornerstone of the technology.
Not only mathematics; but also physics, chemistry, computer or any subjects that he/she didn’t experienced its role in the evolution of humankind.
In green house company that I worked few weeks ago, they have a broken system called “Flappers Mechanism” for years which let us to open/close the window of exhaust fan automatically when the fan started to operate.
I was asking myself, how is it working “
Figure (9) - Fans with associated flappers mechanism in the project
Dedicated electrical engineer started to repaired it quickly as the spare in Turkey. He know what’s the vital role of this system to save energy inside green house when it attached with climate control system (temperature & humidity sensors). Also, it will prevent let the birds to enter the green house & eat the crop. So, entire project will fail economically.
When I see one of these broken devices in my office, I realized immediately how it works. It used the phenomenon of centrifugal force. It’s very similar when you have stone tied to a rope and then rotated it. You will feel that stone is moving away from you (center of rotation).
Figure (10) - Flapper Mechanism System
It was smart engineering trick to open the window using this exciting phenomenon.
In attached video, you may see how flapper’s mechanism works in our green house project.
To be continued
*******
Part 4
Organizational Structure is really important
Date: 19 Apr 2023
When I was in volunteering period – as my Turkish CEO said once upon time– for one week, he gave me an office & his personal printer to work on it; as I always brought my Laptop because they have old PC computer which wants repair. Also, I need it so I could show him a presentation in specific subjects to him.
Figure (11) - My office inside caravan
I done many things to them related to the development of the work, and one of these things are the issue of “Organizational Structure”.
They – literally- didn’t have any systematic administration.
Chaos is the main address.
The Turkish CEO felt that work move slowly & he didn’t know why?
Definitely that’s would happen eventually because the company works according to the strategy of small grocery in village.
I gave him a printed-paper about the importance of the organizational structure in any company/project as it will help us to:
Know the responsibility of employees & who to report. (Chain of command)
Each employee may know their tasks via a specific job description. (Professional Comfortable)
Evaluating the tasks & solve any issues related to the work. (Working Performance)
In that paper, I design the layout of organizational structure depend on the type of their business as you see in figure (12).
Next day, I met him & told me that organizational structure not always working.
I was shocked but I can’t say anything. He is the top in charge.
Figure (12) - My Organizational Structure Layout for Green House Project
One-day, he came over to my office & asked me to announce a meeting with the key-staff in the project. He wanted to declare the organizational structure of the company with other issues.
When he said that I looked to him surprisingly & I felt he was embarrassed in his eyes.
He changed his mind about it & that’s good sign for the best interest of the company.
I was really happy to them as now the work will move rapidly but …
They didn’t mention anything about job description for employees.
Also, they chose few roles in my organizational structure layout. The entire administrative manager & what associated under it, is totally neglected.
How do they want to run a business properly with more than 30 employees now (and 120 employees in future)?
What we did is a preparation for the future; to let the old administrative staff handle any increase in manpower & be familiar when it’s come.
Really, how were their minds thinking?
To be continued
*******
Part 5
Economics & Energy is not always related
Date: 27 Apr 2023
To convince any company to establish new department is a very hard task & you should prove the advantages of it in a short term.
As my primary role as energy professional – which I assigned it by myself – I should analyze & improve the energy consumption in green house.
The main electrical equipments in a single green house are:
Irrigation Pump (2hp – Qt:1): transfer fertilized liquid to the plants.
Cooling Pump (1.5 hp – Qt:1): transfer water to the cooling pads.
Large Exhaust Fan “Blower” (1.5 hp – Qt:10): move out the air from the green house.
Small Axial Fan (0.5 hp – Qt:5): Circulating the hot & cold air inside the green house.
So, the total power of all electrical devices is 21 hp (15.7 KW)
Figure (13) - Layout of Electrical Devices in Large Green House (45m X 40m)
All these devices should working for 7 hours continuously in summer at least except the irrigation pump.
I asked an agricultural engineer about the estimated time of operation for irrigation pump for one green house & she told me that we need it for 20 minutes as maximum.
Figure (14) - Small Green House [9m X 40m]
Really?!! What’s a waste of money in investment?!!
The cost of single irrigation pump is approximately 300 $.
Why don’t we connect one irrigation pump with 4 irrigation pump as they are nearby to each other?! Definitely, it will not change the energy consumption even it was operated in parallel or series method, but it may affect positively in the economical feasibility study with a little increase in the maintenance cost.
We can save 900 $ for every 4 nearby green houses according to their construction.
Figure (15) - Layout of connecting 4 green house with 1 irrigation pump
I gave my technical suggestion to the Turkish CEO, which he was happy for this improvement by reducing necessary equipments in whole project.
He smiled to me & give me a sign of good thumb-up.
That was wonderful news to convince him about the new department “Performance Quality Unit” as it’s mentioned in my organizational structure of the company in 4th part of this article.
–
Note:
Qt: Number of Quantity
hp: horse power (unit of power in physical science)
These based-day notes has been published in my LinkedIn account under tag #Energy_of_Earth & I though it’s a good idea to collect them in one article. It will be updated periodically.
*******
Part 1
The Discovery
Date: 1 Feb 2023
I was working as electrical repairman in my village for long time (i.e. charger, radio, iron & so on ) although I was graduated as mechanical engineer in 2010 by distinguish.
In the beginning of New Year (2023), I noticed strange natural phenomenon towards specific electrical appliance.
It was weird & I still asking my-self why it’s happening?
It was against physics laws!!
Could be the malfunction of device the main reason behind the phenomenon?
I asked the owner of device to buy one of his electrical devices as he had 2 devices (Definitely I will ever tell him the reason for that).
He refused to sell anyone as he needs them both for his daily work.
I was angry; as it may be the key for breakthrough energy technology that ever seen.
After weeks, it happened again with different device, and then I realized why it’s happening.
This video shows a experimental demonstration that it can be a corner-stone of new type of renewable energy from EARTH.
Click the photo to see video experiment 1
To be continued
*******
Part 2
Finding a Suitable Material
Date: 9 Feb 2023
For last days, I conducted many experiments at home to find way to light the LED bulb without using our hands.
I will not deny that, sometimes I want to give-up due to the old tools & equipments that I used to test my new system & it got worse; when I realized after a while that using multi-meter to analyze different materials had a high performance; was making the entire system collapse.
I was asking myself: “Why the system wasn’t working like before & I figure out; the multi-meter was the main reason.
So, the only way to do our technical analyzing is using “Eye” to measure the intensity of LED bulb for different material although it was difficult; as the intensity always very low.
Anyway, I found the suitable material that let us to switch-on the light.
I gave the material the name of “ The Sink ”; as it can absorb things towards it (according to my initial guessing of how this new system work).
There are many natural phenomenon’s happen during these exciting tests, which means there will be more to reveal in the coming weeks.
Click the photo to see video experiment 2
–
Tip: Multi-meter: an electrical device which can measure voltage, current & resistance.
To be continued
*******
Part 3
No Polarity for LED Bulb
Date: 20 Feb 2023
One of interesting features that I noticed in my experiments related to the strange phenomenon, that LED bulb can light in any current direction.
Definitely, that’s impossible, as LED works only in one direction of current in opposite of incandescent or fluorescent bulb.
LED is referred as Light Emitting Diode, which is special type of diode allows the current to pass & emit light in the same time. It’s called a forward current.
If the current is reversed, diode will block the current due to high resistance unless you reach the breakdown voltage.
In our experimental video, we showed how the LED is affected based on the normal & phenomenon situation.
These based-day notes has been published in my LinkedIn account under tag #Wind_Energy_Version_2 & I though it’s a good idea to collect them in one article. It will be updated periodically.
###
Part 1
Date: 18 Jun 2022
I have postponed the project named as #Ocean_Power_Version_2 temporarily. There new developments related to new wind turbine technology that I worked last week for a vital reason.
Fig (1) - Ocean Power
It’s ironic & weird that what we have learned in past as experience is a cumulative blocks for scientific evolution tower for humankind welfare.
No doubt that renewable energy applications will replace fossil fuel in near future, but one of the challenges that faced countries , is the low efficiency especially for solar & wind systems.
Today, we may introduce our new concept of wind technology which can be a real game changer in the energy industry.
To whom who knows wind turbines well, he/she may know there is a limit of efficiency that couldn’t exceed it which is called “Betz’s Limit”. It value is equal to 59.3%
All efficiency of wind turbines in the world will work under this assumption limit & it ranged between 20 ~ 40%.
But our technology concept has a limit up to 125%
Yes, 125% without any mistake. Beyond the expectations & it’s impossible, but we prove it.
Fig (2)
The physical equation has been established.
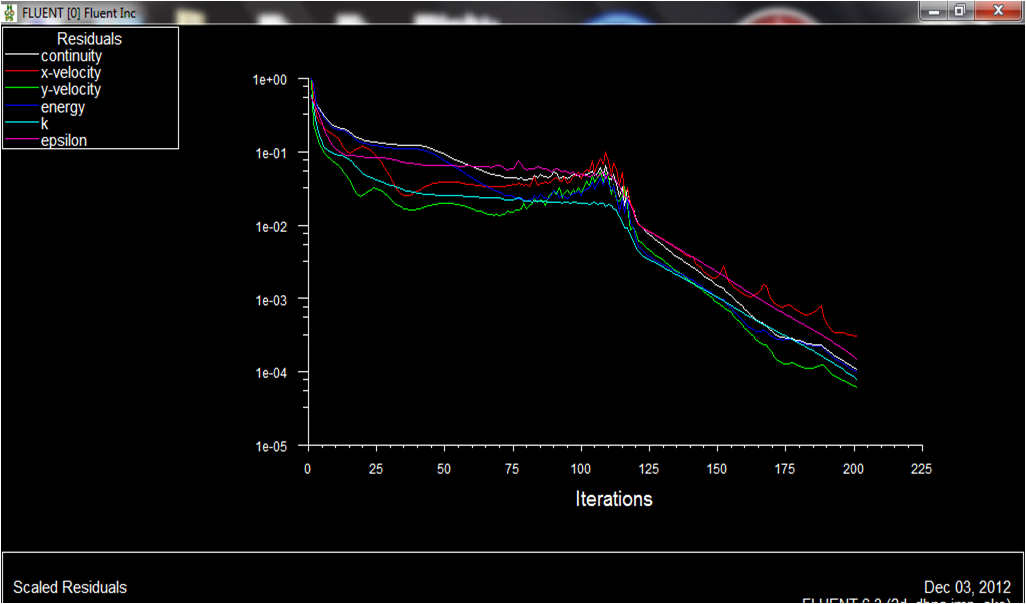
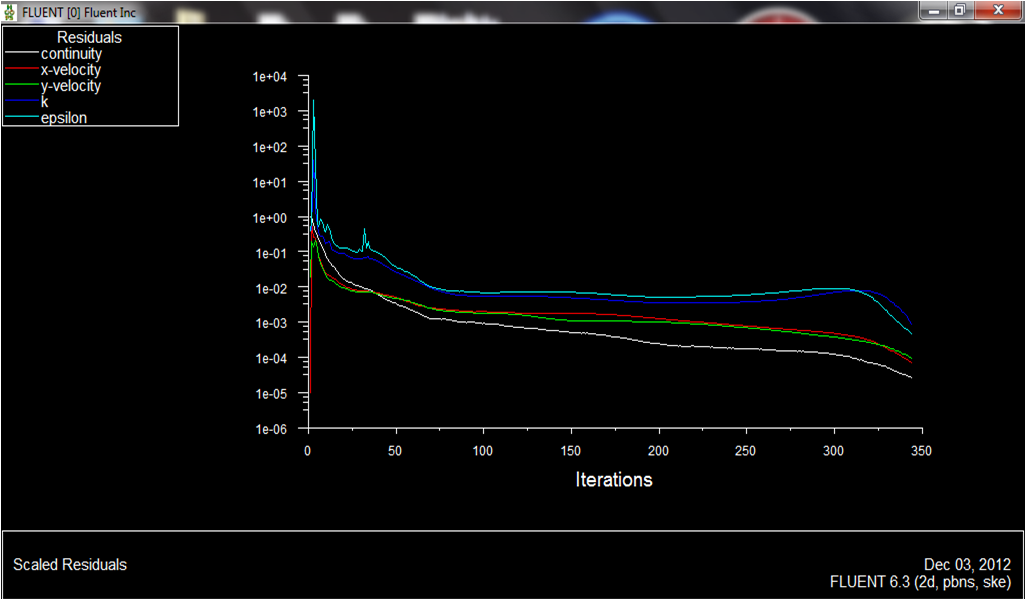
CFD engineering simulation validated our claims.
.
It may be technology breakthrough or even miracle for energy industry in the history of 21st century.
I’m so excited about it & that’s the reason why it will be as “Daily Notes” in my personal website & LinkedIn.
–
To be continued
*******
Part 2
Date: 24 Jun 2022
Betz’s Limit was considered as the maximum theoretical efficiency of wind turbine system. It has been stated by brilliant German physicist Albert Betz in 1919.
Fig (3) - Scientist Betz
In simple words, it’s related to find the value of blade speed which gives us the optimum & maximum efficiency in specific conditions.
Fig (4) - Curve graph between speed ratio and coefficient of power "Cp"
I had know about this limit when I published my 1st article about wind nergy in 2016 named as #Ingenious_Techniques_for_Increasing_the_Power_of_Wind_Energy-Technology [LINK]
In those old times, I wasn’t asking myself;
why there is a efficiency limit at first place for wind turbine?!
Also, I didn’t know how to use engineering simulation software perfectly, so it was only speculative ideas based on my scientific knowledge.
But Now, I understand Betz’s limit more than well with engineering simulation skill & that’s lead me to find the light of proposed technology which is able us to penetrate the crack on the thick cement wall which. It let us to exceed the Betz’s limit beyond the expectation.
You can’t make any progress in future unless you learn & understand the our experiences of past.
–
To be continued
*******
Part 3
Date: 29 Jun 2022
There are two classification of wind turbine in the world;
1) Bare Turbine: This is more popular system all over the world (e.g. HAWT).
2) Ducted (Shroud) Turbine: still not reach the large scale project (commercial stage).
Fig (5) - Types of Wind Turbine globally
The scientists & researchers believed that ducted turbine can supreme the Betz’s limit & posses all market shares from conventional wind turbine (e.g. HAWT), but due to some technical difficulties in high altitude (to gain more energy), they failed to success.
One of the challenges faced ducted turbine is high drag force for creating vortex.
Here we have example of Japanese ducted turbine, named as “Wind Lens Technology” & I have tested by using CFD simulation software by assuming the diameter of fan is 0.1m & wind speed is 5 m/s.
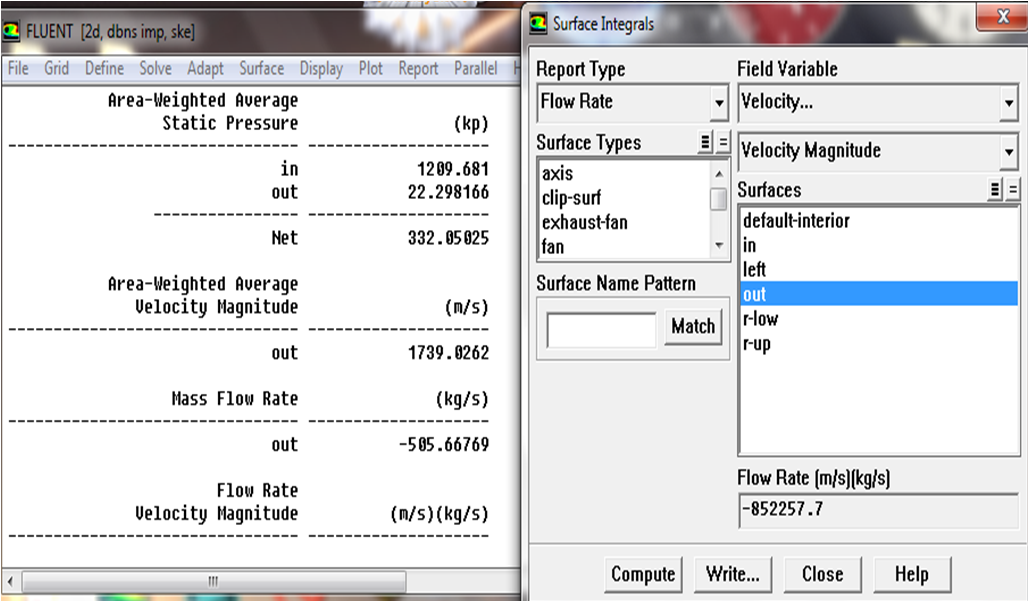
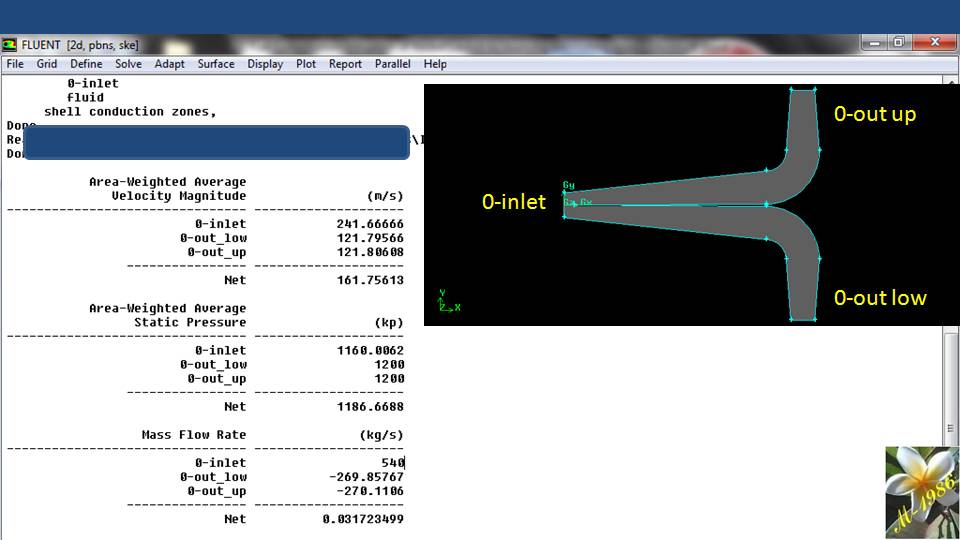
The CFD result of Japanese turbine gives us:
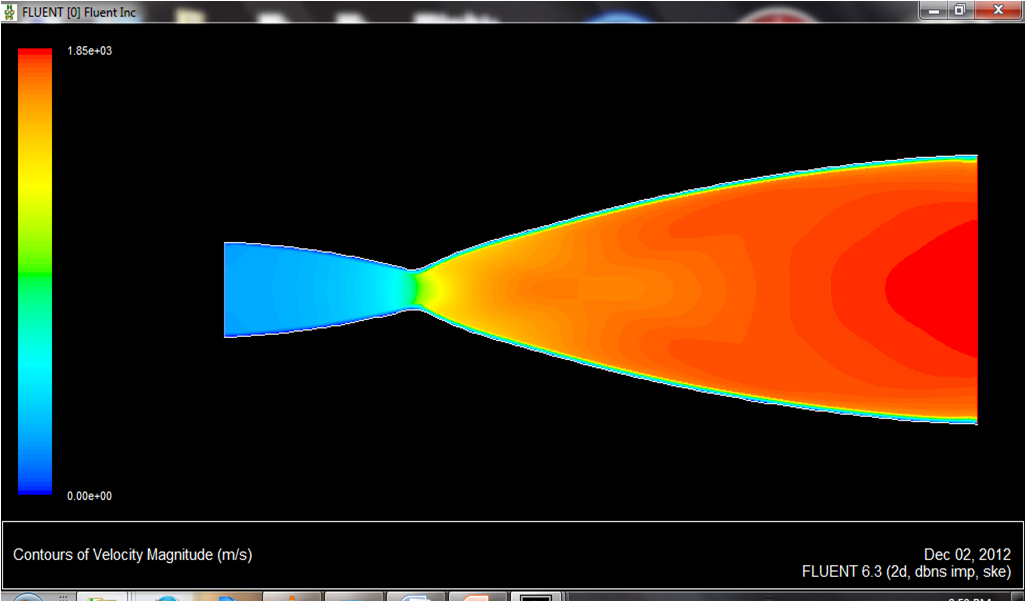
Avg velocity = 7.75 m/s (in the position of fan)
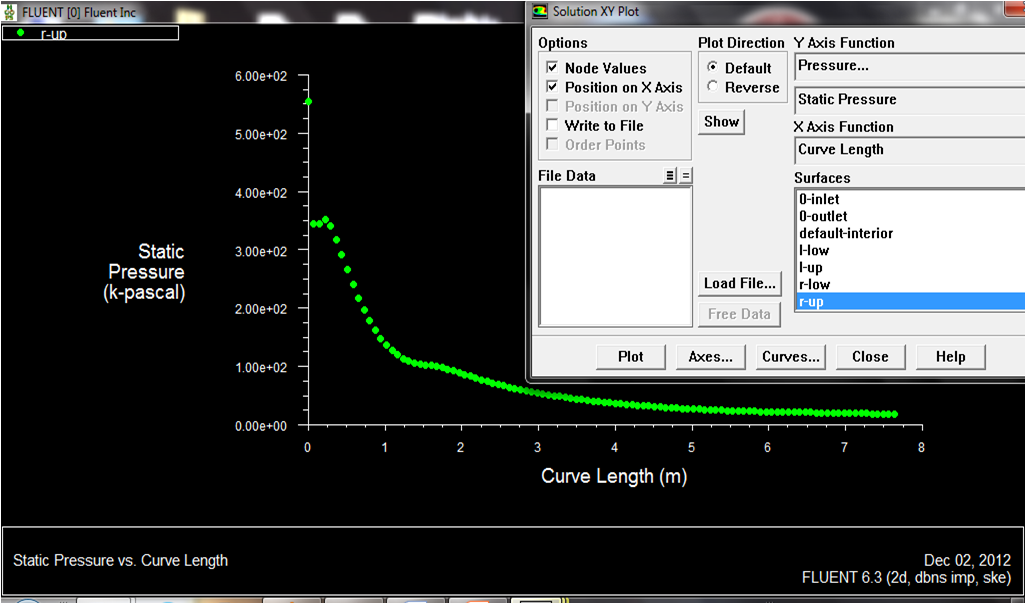
Min Pressure = -24.6 Pa (in the position of fan)
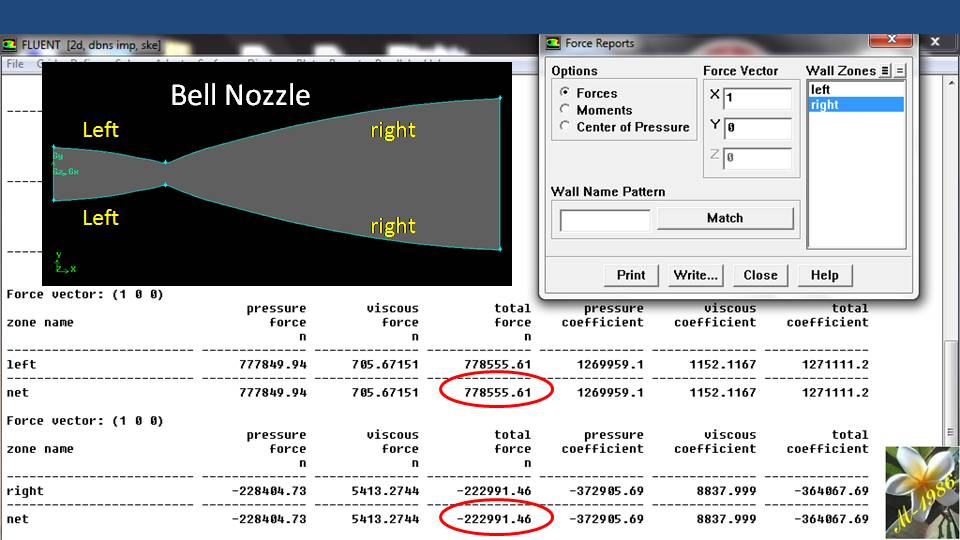
Drag force = 2.42 N (in all walls)
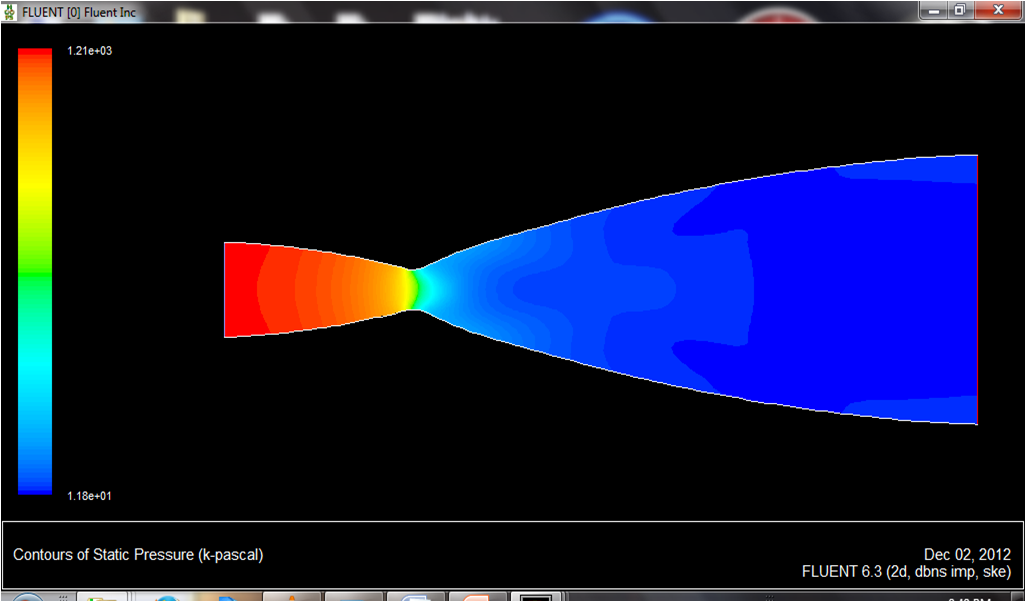
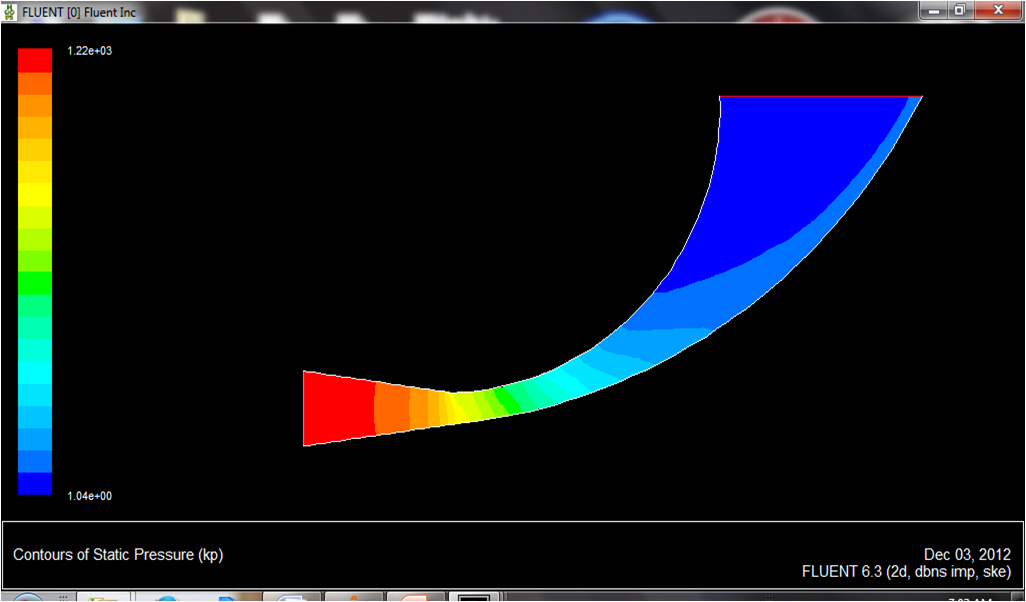
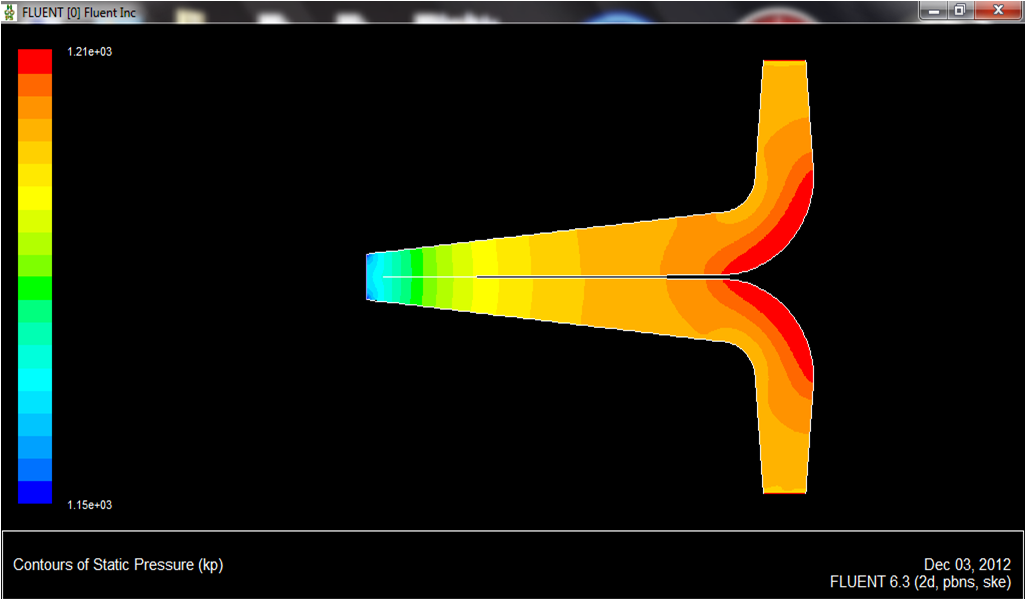
Fig (6) - Static Pressure contour of Japanese turbine
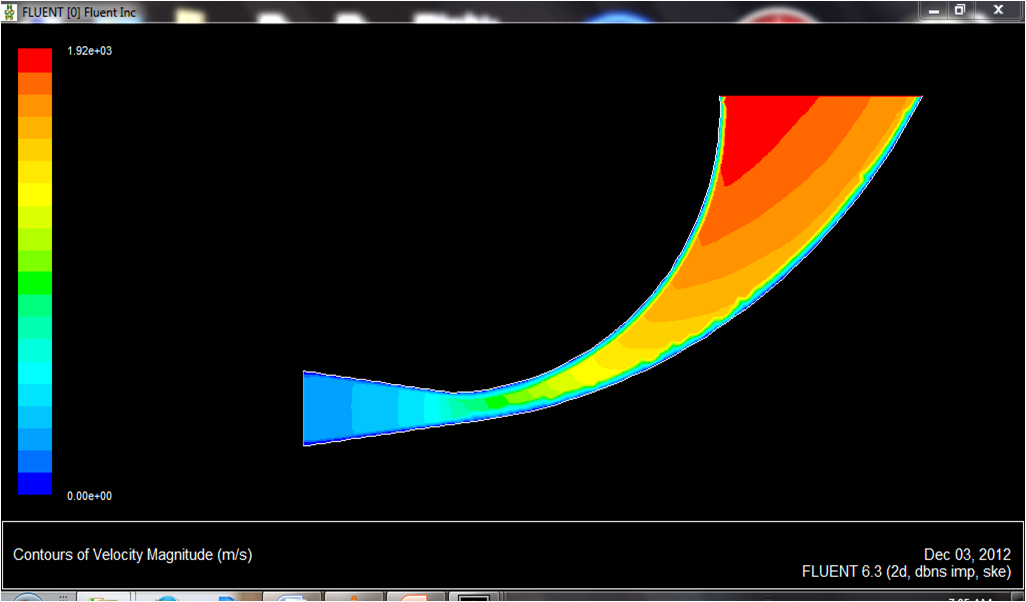
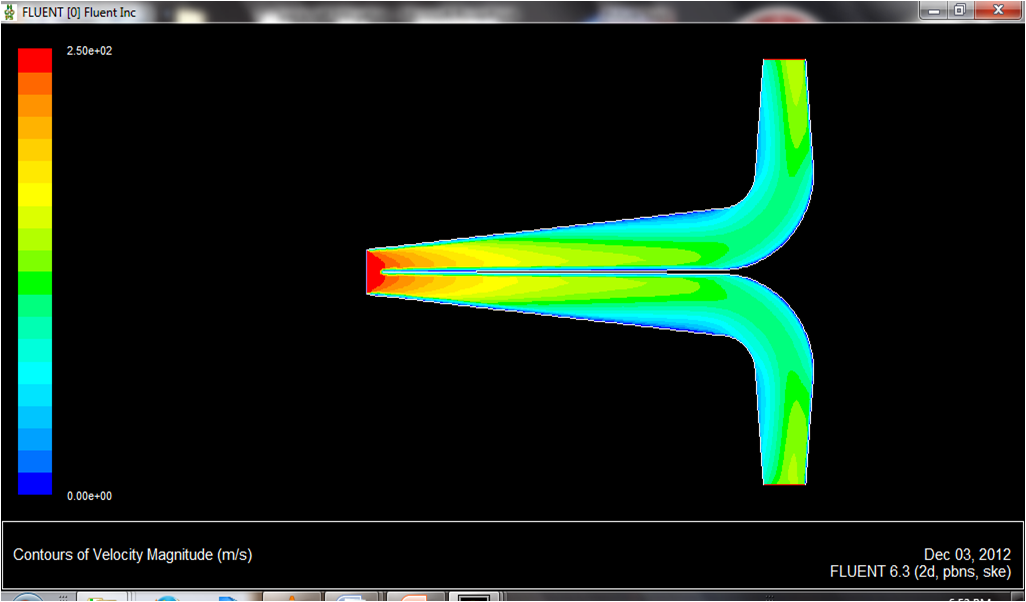
Fig (7) - Velocity contours of Japanese turbine
Our new concept for the same diameter gives us these results:
Avg velocity = 7.76 m/s
MinPressure = -24.5 Pa
Drag force = 0.79 N_
As you noticed there is a drag reduction up to 67% & that’s definitely will solve one the challenges for the promising future of ducted turbine to solve global energy demand.
–
HAWT: Horizontal Axis Wind Turbine
To be continued
*******
Part 4
Date: 8 Jul 2022
Breakthrough: HAWT Power multiplied by 7.4 times
When I was working on CFD simulation of wind turbine, I noticed a strange phenomenon which is contradicts with physical laws that I knew.
I asked why that’s happen & how we can control this phenomenon to utilize it in our aim to increase the efficiency & effectiveness of my new wind shroud turbine.
The only way is to test many designs & draw a pattern of the phenomenon behaviour to understand & analysis the parameters (i.e. length) which affect on the performance of wind turbine.
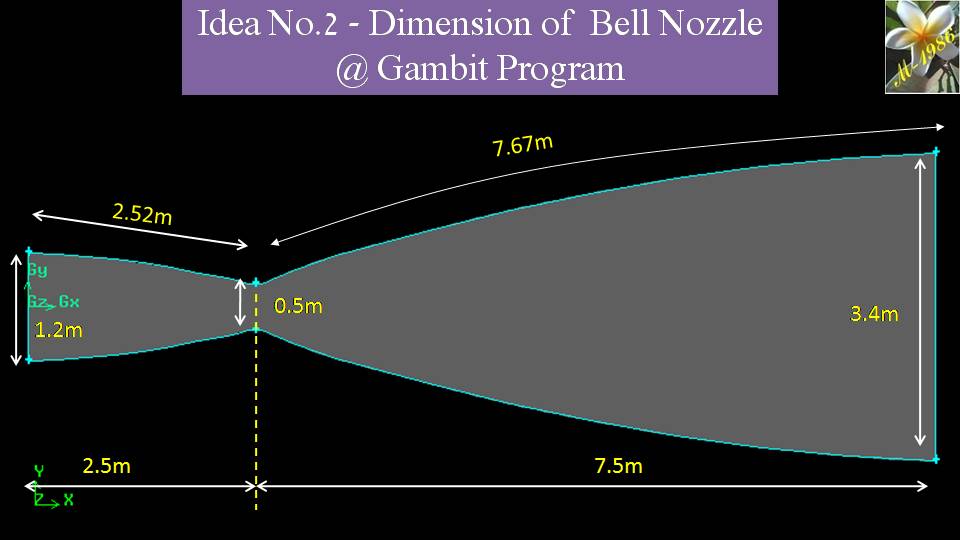
After several cases, we found our unique design. It’s my 2nd idea concept after I started this exciting journey.
The test was made for wind speed of 10m/s & the average velocity on fan position was has reached up 19.5 m/s.
That’s mean the power magnification in respect to HAWT will be 7.4 times.
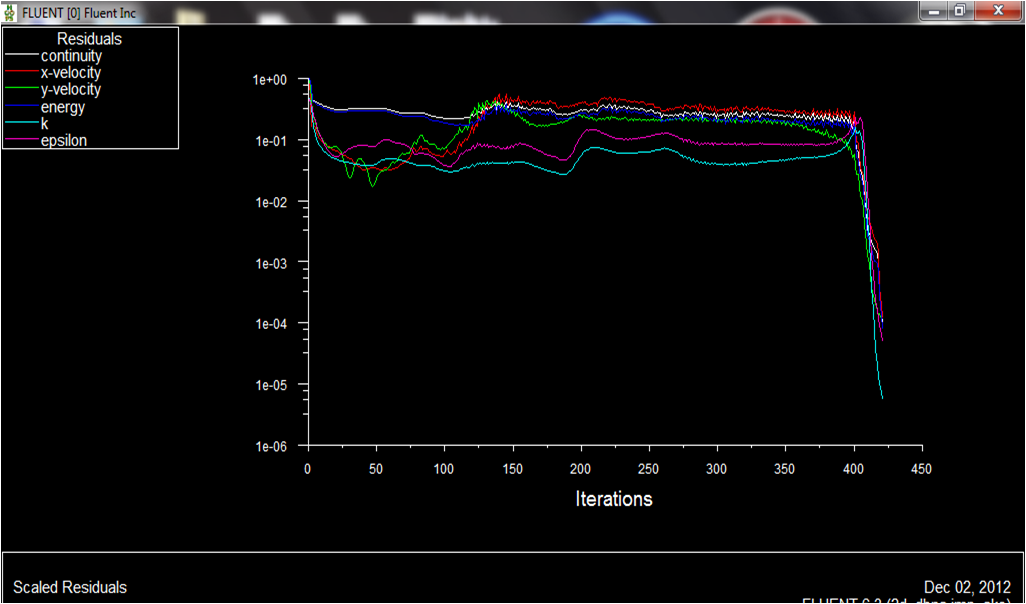
Fig (8) - CFD Residuals by using different turbulence models
I have made a CFD technical table compared my found with Japanese shroud turbine (model 1 & 2).
Fig (9) - Technical comparison with my 2nd idea concept
That’s really a relief after hard working, as we found something extraordinary.
HAWT: Horizontal Axis Wind Turbine
Note:
Japanese shroud turbine (Wind Lens Technology) is belong to Riamwind company (LINK) which technology was co-developed with some professors in Kyushu University (Japan).
Fig (10) - Schematics of Wind Lens Technology by Riamwind company
I tried to comply with the same design of their dimension as possible as I could to test it by using CFD simulation to be as reference of my progression about new idea.
Fig (11) - My Design of Japanese Model 1
Fig (12) - My Design of Japanese Model 2
In part 3, we simulate 1st model of their technology & here we have done the same thing with 2nd model.
Fig (13) - Pressure contours of Japanese turbine
Fig (14) - Velocity contours of Japanese turbine
To be continued
*******
Part 5
Date: 11 Jul 2022
Optimization
After we found our technological concept of shroud wind turbine, we should find the best design which has a high operation performance. In another word “We are optimizing our design”. Which means: we will compare our design with itself.
We are seeking to have:
1) More electrical power with
2) Less drag force on the system.
There are many design parameters that affect those two objectives, so let us begin our investigation.
–
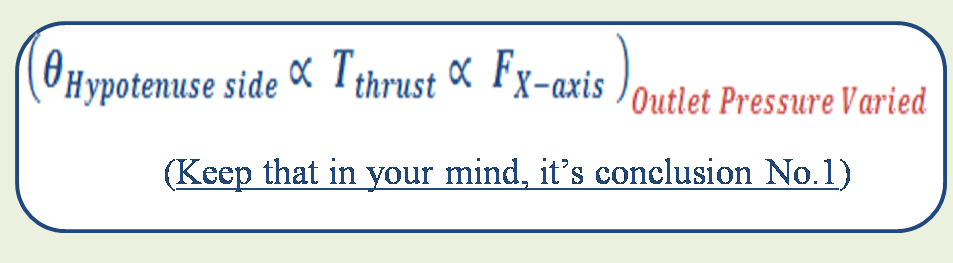
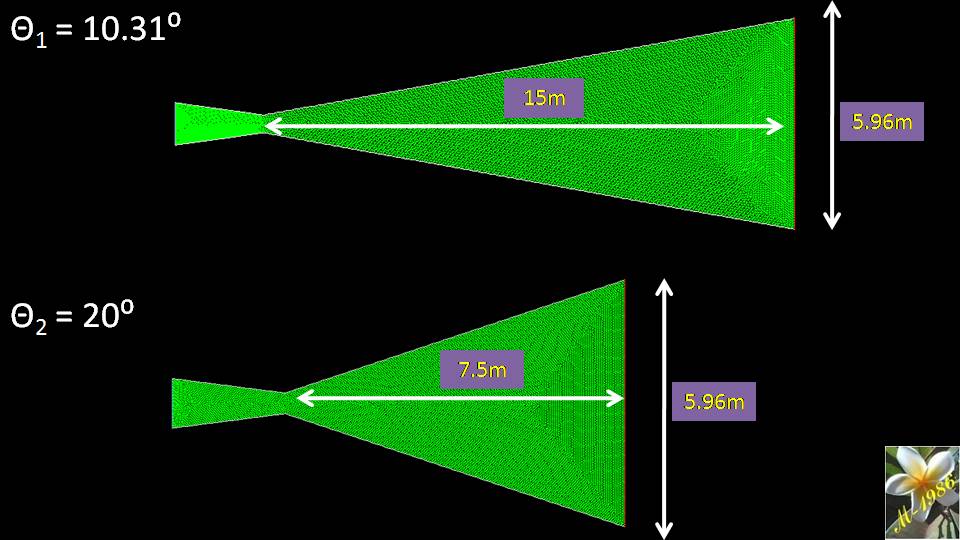
Parameter (1) : Effect of Angle 1
I have made many tests using CFD simulation software to know how the average velocity on hypothetical fan position & drag force can be as you see from curve graph of figure (15).
Fig (15) - Curve graph of Velocity & Drag Force
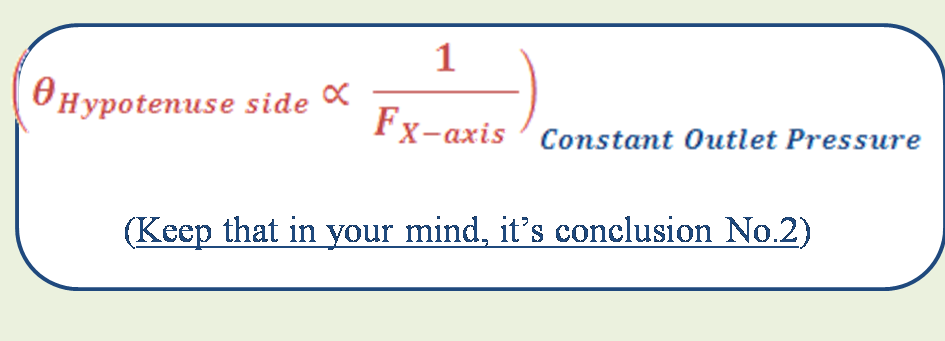
To combine velocity & drag in one equation, we established which may be called “Optimization Function”.
We know that power has a direct proportional relationship with velocity cube.
So, in figure (17) we plot a curve graph for several designs with the optimization function. It concludes that design No.3 was the best compared with other.
Fig (16) - CFD Results of velocity & drag force for different designs
Fig (17) - Curve Graph of Optimization Function
Note:
If you remember from figure (9) in part (4) or fig (18) now, we compared Japanese turbine with design No.5 which the drag force equal to 7.1 N. But now we may consider using design No.3 as it have drag force of 4.66 N which is less than previous design by 34%.
Fig (18) - Technical comparison with my 2nd idea concept
To be continued
*******
Part 6
Date: 15 Jul 2022
Roots of Problem
Ogin (formerly known as “Flo-Design”) was a US-based Energy Company related to ducted (shroud) wind turbine systems. They were super promising start-up from Massachusetts in the field that time, because they have a unique design which could gain 4~5 times of power compared with HAWT systems which means less size of blades for the same power.
Fig (19) - Ogin's Turbine
When I started this journey, I was searching to see if their design is similar to one of my earliest designs that I have made & when I looked to their official website I realized that it has not been updated since 2017.
I was curious, what’s happen to them?
It was very hard to find a reason of shutting down their business after they collected more than 150 USD millions since 2010.
It’s like searching a needle in haystack.
Luckily, I found an article in “Boston Globe” website only [LINK], interviewing an outside expert who declared that “Ogin’s” turbine can’t work in high altitude due to high drag which means more money should spend for making sturdier strong support tower.
Fig (20) - Ogin's Turbine System in Deer Island, Oregon, USA
I was asking myself:why defunct startup/company doesn’t share their failed stories to know their problems & give a chance to other to give their solutions for them??
Few days ago, someone from my LinkedIn connections gave a list of more challenges related to ducted wind turbine that I wasn’t think about it at all & I decided to solve them one by one.-
Challenges 1: Wind Angle
According to his statement, the high power of shroud turbine may be found when the angle of wind motion aligned with the axis of turbine hub (θ= 0 Deg). After that power will reduce dramatically & get worse.
So, I made CFD test with my new concept No.2 to see how the wind angle may affect the power as you see in figure (21). It has been noticed that angle of 16° was a critical angle, that let us say: there is no useful of ducted turbine now.
Fig (21) - CFD Results of My New Concept 2
Also, for comparison, I tested the Japanese turbine model 1 & 2 to see how it may affect also as we see in below figures.
Fig (22) - Velocity contours of Japanese Turbine Model No.1
Fig (23) - CFD Results of Japanese Turbine Model No.1
Fig (24) - Velocity contours of Japanese Turbine Model No.2
Fig (25) - CFD Results of Japanese Turbine Model No.2
You may notice that the reduction of power in our NEW concept is approximately similar to Japanese model No.2, but remember that our concept has power magnification of 5.95, compared with Japanese model which it have 1.88 only.
HAWT: Horizontal Axis Wind Turbine
To be continued
*******
Part 7
Date: 17 Jul 2022
There was a question buzzing my brain all time related to previous part:
Why winds change its direction at first place?
Fig (26) - Strong Wind (storm)
From my searching, I realized 3 factors:
Pressure difference: Hot & cold region which lead to change the density of air.
Coriolis Effect: related to the rotation of earth.
Friction: passing near land, tree & mountains.
They believed that, the angle of wind may reach up 20° every 5 minutes (back & forth) & worst scenario that it can be 180°.
So, I asking myself a logical question;
Isn’t better to control the natural wind direction rather than rotate huge mass of turbine blades & generator which can be more than 12 ton for 1MW of HAWT system?
There is no comparison between density of air & this heavy equipment.
Fig (27) - Parts inside wind turbine
We don’t need a yaw-motor at all which is responsible to align axis of turbine with wind direction, so we can save significant amount of energy.
That’s one of what I’m thinking about it now.
HAWT: Horizontal Axis Wind Turbine
To be continued
*******
Part 8
Date: 20 Jul 2022
Knowledge is power & it makes you to find solutions of our global challenges.–
I was searching in internet to find more about promising wind energy startup companies & it seems not always the big scale project can win the arena every time. We should be flexible & versatile.
They really blowing-up my mind to think about their technologies deeply.
Devecitech is Turkey-based startup. It has invented a tech of the future “Enlil” The first vertical smart wind turbine designed to harvest both the energy from the naturalwind, as well as that created by passing vehicles in highways.
Fig (28) - Virtual Vertical Turbine in Highway.
It’s really very smart idea if we can utilized from this natural phenomenon efficiently as not always the road will have 1 street in both sides.
Fig (29) - Concept of Enlil Technology
Fig (29) - Testing Enlil Technology in Turkey
You may know other top 50 wind energy startups for 2022 in this [LINK]
To be continued
*******
Part 9
Date: 22 Jul 2022
Shifting Gears
It seems to me that ducted augmented wind turbine (DAWT) is unwanted topic for the repetitive patterns of failed startups to move on for years. They take grants/fund & then stopped in the middle of road because they didn’t due diligence to their work rather they get rush to predominate the market of wind industry.
I can’t blame them & I will do the same, but a wise person always learns from the mistakes of others to change the failure to succession.
I don’t give up; as I know some of reasons why they failed either by searching in internet or from my LinkedIn’s connections & there is a solutions, but the big picture is not clear to me about what should I do next if I don’t know what’s the other problems?-
So, I decided to focus my efforts in conventional HAWT system as maybe it gets some attention for wind companies, especially along this little landscape journey of ducted turbine, there was some ideas came up related to HAWT system along & some of them I was testing it by a CFD simulation software few days ago. There is a progress that I will share in this amazing article, so keep follow me.
Our strategy is simple:
We validate our design by engineering simulation.
We estimate the cost of construction.
We make feasibility study of our technology & compare it with HAWT system.
After we accomplish to operate large scale project safely in somewhere, we will return back and open Pandora-Box (i.e. ducted turbine).
Wish Me Good Luck.
To be continued
*******
Part 10
Date: 27 Jul 2022
Diligence is the Key for Success
As I promised in last part, that we have a progress related to increase the efficiency of conventional HAWT system without using ducted (shroud) concept that many wind energy companies don’t like to invest on it as it’s considered as “Pandora Box” by all means.
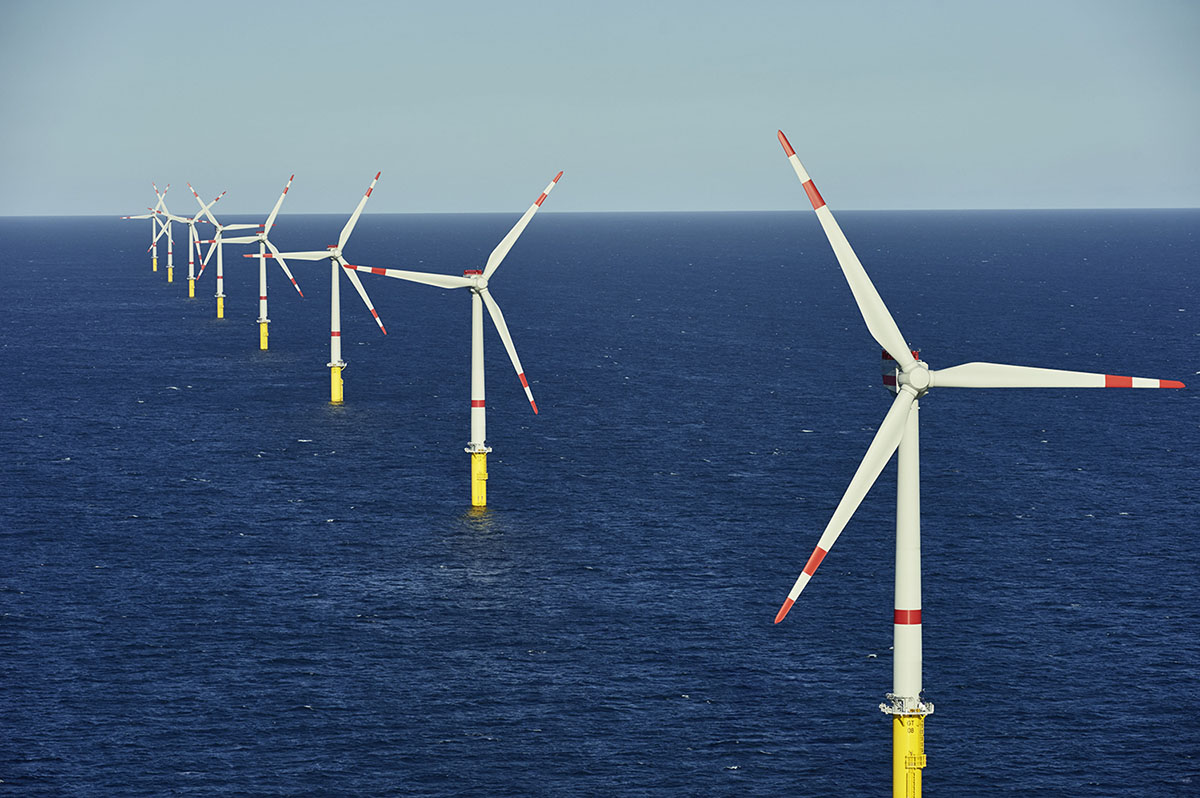
Fig (30) - Offshore Wind Turbine Farm
Actually, there were 2 ideas, one of them is more costly than other; but it has an advantage to gain more power. We will talk today about the idea with lowest cost only.
Advanced HAWT No.1 (Low cost)
We have tested this concept by using three dimensional (3D) engineering simulation software (ANSYS-Fluent) & we gain more than 25% of power compared to conventional HAWT system as you see in figure (31).
Fig (31) - Technical comparison for Advanced HAWT System No.1
We have applied different viscous turbulence model for the same design & it gives same approximated value of average velocity on fan position & figure (32) shows the CFD residuals of our 3D test.
Fig (32) - CFD Residuals of Different turbulence models
It’s very simple idea & all what want to do is add specific device into any existing operational HAWT system in the world & it will works like magic.
Great, isn’t ?!
Definitely, the construction cost of this device is what we concerned.
We will discuss this matter in the next part, but the preliminary evaluation is very promising regards to the price of electricity (USD/KWh).
Wait us & share it to whom is concerned.
HAWT: Horizontal Axis Wind Turbine
Note:
We should mention two important things.
1) There was very big difference in average velocity between 2&3D CFD simulation test for some natural reason that I understand it well, and that’s lead me to find innovative way to overcome it. So, Idea No,2 was born from that reason but it’s very expensive. Anyway, we will discuss it later.
Fig (33) - Difference between 2 & 3D Simulation
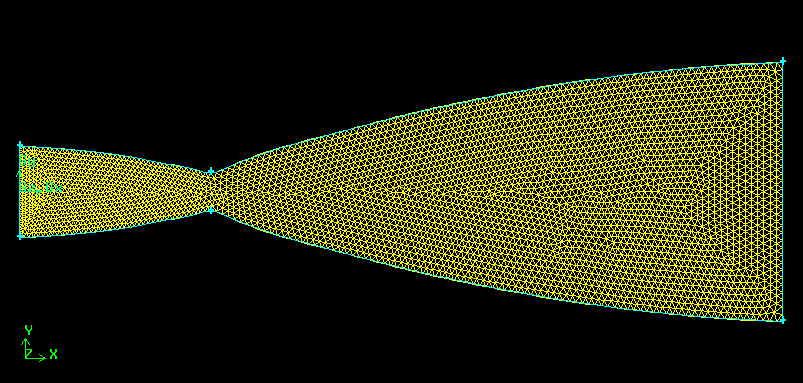
2) Our 3D simulation test was test under high Y+ value due to lack of powerful computer to deal with high intensity of grid meshing, but we made several tests with different grid meshing values & it seems all it has approximately same average velocity on fan position. Y+ value is very important to get accurate result & it should be less than 5.
Also, the grid size may affect accuracy of our solution which is associated with Y+ value. Figure (34) shows a sample of grid intensity to hollow circle.
Fig (34) - Grid Intensity
The grid test results of our idea No.1 shown in figure (35) has been made for wind speed of 5m/s & it will give us the same power gain percentage of 125% for wind speed of 10m/s with neglected difference value.
Fig (34) - The Effect of Grid Intensity on Advanced HAWT system No.1
I really do my best. It’s all possible options in the table to verify my results.
To be continued
*******
Part 11
Date: 2 Aug 2022
Breaking News
As we mentioned in part 9 of our strategy to evaluate our new technology. Today we will talk about the construction cost.
To whom they don’t know, this device can be added to any existing HAWT system.
I wasn’t think it’s very hard to deal with economical cost of any new technology as the physical concept is easier than this, because you be upset for a while when you discover that your idea is not an option anymore for business even it succeed in laboratory tests.
Also, last week I have learned another type of engineering simulation related to structural model which is very crucial part in our economical evaluation. The software that I used is similar to what you saw in figure (35).
Fig (35) - Structural Simulation for Beam subjected to force in the end
To understand what we have done, let us assume that we have HAWT system by this specification in figure (36):
Fig (36) - Specification of Wind Turbine under study
The actual power (electricity) produced from the wind turbine is approximately 77 KW.
So, we know that our new concept can gain more power up to 25.3% of actual power, so the extra power will be 19.5 KWh.
We will focus only in this extra power to compare it with the construction cost of our new concept.
For on-shore HAWT, we will need 4 structural systems. (It will be discussed now)
For off-shore type will add a buoy unit, so we want 5 constructional systems.
The material used in constructional design is a mixture of polyethylene (PE) & glass fiber.
Poly-Ethylene Properties:
Density=900 Kg/m3
Young’s Module: 0.3 GPa
Price= 5.5 $/Kg
Depression Rate = 3 Years
Glass Fiber Properties:
Density=2600 Kg/m3
Young’s Module: 70 GPa
Price= 4 $/Kg
Depression Rate = 40Years
The total construction cost for on-shore HAWT System is 26,580 USD.
So, the annual cost of system is 1204 USD. (Remember it well !!)
We know that extra power is 19.5 KW. For 24 hours of continuous operation in period of year, the annual production of energy will be 170.6 MWh.
Now, divide the annual production of energy from annual cost, and then we may have the price related to adding new concept:
By the way, the average of electricity price over the world is 0.137 USD/KWh
HAWT: Horizontal Axis Wind Turbine
To be continued
*******
Part 12
Date: 24 Aug 2022
Creativity makes us Proud
All horizontal axis wind turbine (HAWT) system has been located in high altitude which leads to increase the construction cost for supporting tower for the main components: Nacelle & Blade.
As you see in figure (37), nacelle has high percentage share of total mass of GE-1.5 MW by 56 ton.
Do you have any solution for it?
Fig (37) - Mass Percentage share of Wind Turbine (GE-1.5 MW)
Definitely there are many ways and one of them is to make new design which maybe called as the “The Ground Wind Turbine” as you see in figure (38). It will make significant reduction of electrical cost per KWh.
Fig (38) - The Ground Wind Turbine System
How you can create such vertical wind type?
Either; by finding a natural location or creating it by using principles of physics.
Ask yourself, why in first place we have horizontal wind & then you will know how to reverse it.
We have many revolutionary applications which go against the nature such as:
Water pump.
Flying by plane.
Sailing by ship.
Planting without sunlight & so on.
All that’s happen after; we understand the natural phenomenon (i.e. experiments) & utilized it to the humanity service for better life.
To be continued
*******
Part 13
Date: 16 Jan 2023
The Luck of Hard Working
For 2 months, I was working in special project with passionate engineer from Sweden who cares too much about wind energy & wants to see the whole world (especially in developing countries such as Africa) depend on it as it’s considered as promising renewable energy nowadays.
He read this scientific article & admired my hard works, so he thinks that there is a opportunity to do great business with each other. He has the experience & I have none except ambition.
He gave me an assignment for making technical study for wind project in Sudan (Africa) to determine the levelized cost of energy (LCoE).
To do that he sent me some links for useful textbooks related to wind energy & suggested me to use 3 software in this project, which they are:
OCTAVE (Numerical Computation).
Global Wind Atlas (GWA).
Q-Blade (Wind Turbine Simulation)
Octave: is a high-level interpreted language, primarily intended for numerical computations. It provides functionality similar to MATLAB, and can be used for signal processing, machine learning, image processing, and other applications. Octave is open- source software released under the GNU General Public License.
Fig (39) - OCTAVE Software Screen
Global Wind Atlas (GWA) was a dataset of wind climate statistics & it was very helpful to determine which locations have the high density of wind energy. I wasn’t aware that there is such software exist which gives you full information easily rather than to read reports & make average values for each day. It was great tool for any investor wants to find suitable place to start a wind project.
Fig (40) - Global Wind Atlas website screen
Q-Blade software was also very useful as it gives 3D approximation results of power coefficient for real test in wind tunnels. You can make many adjustments for type of airfoil by few clicks & saves really a lot of time compared to Fluent (ANSYS) software that I used before as I should wait hours for one case.
Fig (41) - QBlade Software Screen
Although of its advantages, Q-Blade software can’t let you to be creative to design as its limited to traditional type in the field either for HAWT or VAWT system. I was really enjoyed this journey, even it was exhausting & worried that I can’t finish the assignment before the deadline.
I have feeling that Q-Blade is a treasure & can be more than useful to investigate but I want free time.
After I finished my 1st assignment & waiting the decision of my mentor in the beginning of New Year (2023), I did some numerical research for specific design of VAWT system, and I found way to increase the coefficient of performance up to 55%.
Fig (42) - Curve Graph comparison using QBlade software
This is huge & game changer in wind industry – if it’s being validated in real wind tunnel experiments – as VAWT system always has lower efficiency compared to HAWT.
So, VAWT systems are not preferred on the investment table always for this reason.
To be continued
*******
Part 14
Date: 27 Jan 2023
The Power of Communication
Last week, Mr. Anthony Lusich (connection@LinkedIn Website) told me about exciting largest meeting on ZOOM (video-conference App) related to business relationship between investors, founders, startup & mentors for 2 hours every Wednesday.
It’s named as “ Venture-Starters” and it has been found by Mr. Mark November (connection@LinkedIn Website).
So, I said to myself maybe it’s opportunity to present my works of Energy Technologies especially in wind power systems both VAWT & HAWT.
So, I signed-up in ZOOM website & I received invitation email that meeting will be in Thursday.
I said to myself “They are disorganized people, they said it will be every Wednesday in their official website ?!! Maybe they are busy this Wednesday @25 Jan 2023.
In the day of meeting (Wednesday), I received an email told me about meeting that it will be @4.00 PM (PST: Pacific Standard Time). It is the time in west side of North America.
I asked myself what the local time would be in Sudan (Africa)?
You will not believe it.
2 AM (Morning of Thursday)
Great, so I should wake up all night for this meeting for 2 hours.
Now I understand why my meeting should be in Thursday.
For days I was trying to solve technical issues related to my webcam deice as it isn’t not working (Windows said its working properly but there is no screen at all). I googled every inch in webs without any luck.
I remember that I have mess with USB drivers last year for Bluetooth device & since then Webcam stop showing any screen.
When I realized that ZOOM meeting had 1/2 hour to get started, I give up temporarily and I should now prepared for this exciting moment & it can be game changer for my professional life.
When the meeting started I really lost there , you hear voice of someone talking without images & sometime the browser desktop freeze, so I shifted to ZOOM App which I can say it’s less worse but I realized that low speed of internet in my area is one of the reasons.
After closing browser desktop, things get better in ZOOM app.
But, … I wasn’t aware where I’m?!!
After while, I noticed there is a button titled by “Room”.I remember that Mr. Anthony Lusich told me about Rooms & participants can join to any interest 30+ rooms that he/she like such as ,
Accelerators
Business-to- Business/.consumer (B2B B2C)
Disruptive Technology
Climate/Environment.
Women founders.
Coaches and other fields.
so, I searched and I found Energy/Power room.
I was late, but I found people who are really encouraging you about what are you doing. It was a relief.
They are treasure-mine that can be the light of hope in dark tunnel.
Thanks for whom give me his/her time & definitely I will join next time.
Funny moment
When I was join the room, I was trying to test my microphone to see if it’s working in ZOOM meeting, so I clicked un-mute button & I started talking, then I I heard someone told me “Mohamed Wait your …”. I was interrupting other person talk.
It was embarrassing moment but I apologized for them & I told him it’s my first time in ZOOM meeting & They understand. I was thought that moderator have the right to give permission to who should talk first.
We learn from our mistakes & that’s how become expert.
Next time we may prepare well after I realized there is way to upload photo of our works (Not texting only by Chatt button).
Thanks Mr. Anthony Lusich for giving your support all these months.
To be continued
Note: I joined again the next Wednesday. (Click to see hand claps @ the end of Venture Starters meeting)
وقد وجدت أنها فكرة عظيمة إذا تم تجيمع هذه القصاصات في مقالة واحد ليسهل للقارئ متابعتها. سيتم تحديث المقالة من وقت لآخر.
###
فهرس المشاكل
الفوضى 1: استهلاك الغاز البترولي المسال بالمطاعم – مثال :الفول المصري (الأجزاء من 1 إلى 9)
الفوضى 2: استهلاك الكهرباء للمكيف الصحراوي “التبخيري” (الأجزاء من 10 إلى ***)
(قريبا _ تحت الدراسة) الفوضى 3: استهلاك الغاز البترولي المسال بالدكاكين – مثال : الحليب
(قريبا _ تحت الدراسة) الفوضى 4: استهلاك الغاز البترولي المسال بالمخابز
###
الجزء الأول
التاريخ: 7 يناير 2022
الفوضى 1: استهلاك الغاز البترولي المسال بالمطاعم
لقد تحدثنا سابقا أنه يوجد ضياع كبير للطاقة بالسودان سواء كان بالمصانع أو المطاعم أو الأفران أو الشركات.
اليوم سنتحدث عن إحدى الحلول المتعلقة باسطوانات غاز الطبخ.
Liquefired Petroleium Gas (LPG) Cylinder
قبل أسابيع أخبرني أحد ملاك المطاعم الصغيرة بقريتنا أنهم يستهلكون كثيرا أنابيب الغاز نسبة لتحضيرهم الفول المصري الذي يستغرق معهم 5 ساعات وتحضير الطعمية (الفلافل) يحتاج ل 3 ساعات يوميا مما حدا بهم لتغيير الاسطوانات كل 4 أيام (هذا إذا لم يشتريها من السوق الأسود بمبلغ خرافي). هو يريد حلا لمشكلة تحضير الفول بوزن 14 كيلوجرام يوميا.
الصورة 1 - فترة إعداد كل من الفول المصري والطعمية بقريتنا
كانت المشكلة واضحة بأنها في الحرارة المفقودة بكميات كبيرة سواء كان من الحرارة أو التبخير أو سوء نظام اللإحتراق (الموقد) لديه.
ذلك المطعم هو الوحيد بحلتنا ولا يوجد به زبائن كثر ولكن الدكاكين التي تقوم بإعداد الفول يوميا كثيرة وتصور مدى الفقد الحراري وكمية الاسطوانات المستبدلة على امتداد الدولة سواء كان مصانع أو مطاعم أو أفران خلال أيام معدودات.
لقد وجدت من خلال حساباتي أنه لتحضير كمية 14 كيلوجرام من الفول نحتاج لطاقة:
Required Energy for cooking= 1.95 KWh
مع العلم بأن طاقة اسطوانات الغاز الفعلية التي تصل للوعاء الحراري (إن كانت بها غاز البروبان بنسبة 100%) تصل :
Actual Energy in LPG Cylinder= 107 KWh
الصورة 2 - إعداد الفول السوداني والطعمية "الفلافل"
وهذا يعني ببساطة أنه إذا تم حل مشكلة الفقودات الحرارية بفعالية، فإن الاسطوانة لدى مالك المطعم سيغيرها بعد شهر عوضا عن 4 أيام (طبعا بعد إضفة طاقة تحضير الطعمية للحسابات) وبالتالي سيتم التقليل من الاستنزاف الاقتصادي للفرد وللدولة بشأن هذا المنتج وسيؤثر ايجابا على حياتنا المعيشية.
إحدى هذه الحلول هو استخدام المواد العازلة للحرارة (كالقطن والفايبر غلاس والخشب) حول الوعاء المخصص للطبخ (قدرت الفول).
لقد تم استخدام برامج المحاكاة الهندسية لمعرفة الفقد الحراري للوعاء لحركة الهواء الطبيعية (من دون وجود رياح) واتضح جليا أن الفقد سيتناقص بنسبة 50% إذا استخدمنا العازل الحراري.
الصورة 3 - أثر حركة الهواء حول وعاء (قدرة) الفول
الصورة 4 - توزيع درجة الحرارة حول وعاء (قدرة) الفول العادية
الصورة 5 - توزيع درجة الحرارة حول وعاء (قدرة) الفول بعد وضع العازل الحراري "القطن"
–
…. يتبع
#Energy_Chaos_in_Sudan
#LinkedIn_Sudan
*********
الجزء الثاني
التاريخ: 12 يناير 2022
تحتوي اسطوانة الغاز المسالة ذات الكتلة الصافية 12.5 كيلوجرام على طاقة مقدارها 170 كيلوات.ساعة (إن كانت مملوءة بغاز البروبان بنسبة 100% وهي بالسودان ليست كذلك):
Energy of 12.5 Kg LPG Cylinder (If it filled by Propane Gas – C3H6 – as 100%) = 170 KWh
الكفاءة الحرارية بالنسبة للأطعمة تعني مقدار الطاقة الموجبة اللازمة لتسخين كمية محددة من الطعام مقسومة على الطاقة الكلية لنظام التسخين (وهو مجموع الطاقة الايجابية والسلبية – المهدرة). باختصار شديد هو قسمة المخرجات على المدخلات الذي يوضح مدى فعالية أداء عمل المنظومة.
Efficiency = Output/Input
أجهزة الطبخ الحديثة (أو ما تعرف بالبوتوجاز) بالعالم تبلغ كفائتها الحرارية 40% في احسن الاحوال. وهذا يعني أننا نستفيد من طاقة مقدارها 68 كيلوات.ساعة والباقي يضيع إما على شكل حراري كاشعاعات أو عمليات تبخير هذا غذا لم يكن هناك تفاعل كيميائي غير مكتمل بين الهواء والغاز والذي يمكن معرفته عندما ترى لون الشعلة مائل للإصفرار أو اللون البرتقالي، وهذا يدل على أن هناك نقص بكمية الاكسجين. التفاعل التام يمكن معرفته بظهور لون الشعلة باللون الأزرق.
عندما قمت بحساباتي المعملية بالنسبة لحالة إعداد “الفول” والذي يستغرق 5 ساعات ل 14 كيلوجرام، كان هناك تناقض غريب بين النتائج المعملية والنظرية إذا ما قورنت بكفاءة 40%.
بدأ الشيطان يلعب داخل حجرات دماغي (وله الحق فالعلم لا يكذب):
م## هل تقوم الشركات المسؤولة عن اسطوانات الغاز بتعبئتها بأقل من وزنها الحقيقي لتحقيق توازن اقتصادي معقول خصوصا أن الغاز مدعوم ؟؟ لا يوجد جهة سواء كان كفرد أو هيئة تتحقق ما إذا كان ضغط أو وزن الغاز متفق مع ما تدعيه شركات تعبئة اسطوانات الغاز؟ فلا أحد يسال ولا أحد يهتم وإن تحدثت اتهموك بالغباء ولاسذاجة فالأمور هكذا تسير بالدولة ويجب أن تفبل بالواقع (احمد الله على النعمة واسكت فأنت بالسودان بلد العجائب).
م## أم هل يقوم سائقي الدفارات يانقاص وزن بعض الاسطوانات من خلال توصيلها مع انبوبة فارغة حتى تمتلئ وبالتالي حصلو على انبوبة مجانية يمكن بيعها للجمهور من خلال أخذ جزء من حقوق الآخرين ؟ أنا لا أعتقد أن لهم هذه المهارة الهندسية فالأمر به مخاطرة حقيقية.
م## أم أن سيد دكان الغاز بالحلة يقوم ياستبدال الاسطوانة يوميا (خصوصا ان كان له مطعم) ويبيع الإسطوانة ذات النقص للجمهور على أنها مليئة 100% وإذا احتججت فسيدعي لك أنها تم تسليمها له من الشركة عبر ممثليها (ناس الدفارات) هكذا وبالتالي سندور في حلقة مفرغة لا نعرف من هو المخطئ ليحاسب ولكن بالتأكيد الخسارة سيدفعها المواطن المغلوب على أمره.
****
حسنا لنعد لموضوعنا المعقد.
كنت اقكر لأيام عن حل لهذه المعضلة العلمية، فأين ذهبت كل تلك الطاقة التي تخالف القوانين العلمية ؟
ثم بعدها قلت لنفسي: يا لغبائي الشديد، إن القوم (العالم المتقدم) يتحدثون عن كفاءة أنظمة الطبخ الحديثة، أما ملاك المطاعم والدكاكين الين يقومون بإعداد الفول يوميا، فإنهم يستخدمون أسوأ نظام للطبخ وهو المدعو “الدافوري” ذو العين الواحدة، بتصميمه الردئ وهيئته الكئيبة وابتسامته المظلمة غير السارة للناظرين، نسبة لرخص سعره بالسوق السوداني فيسيل له لعاب من لا يفقه شيئا عن العلم ودراسات الجدوى الإقتصادية.
–
عندما قمت بمراجعة حساباتي مرة أخرى ادركت حينها أين تقع فوضى الطاقة بالسودان، فكفاءة نظام “الدافوري” تصل تقريبا ل 7.3%، وهو بالفعل أمر جلل لا يمكن السكوت عنه عند مفارنته بكفاءة أنظمة الطبخ الحديثة التي تصل ل 40% .و
الصورة 6 - مقارنة الكفاءة الحرارية لأنظمة الطبخ الحديثة مع نظام الطبخ التقليدي "الدافوري"
.بحسبما عرفت بأن هذا النوع من الانظمة يتم صناعته بالسوق السوداني من قبل أناس لا علاقة لهم بالهندسة – شغل جربندية -، فلا غرابة أن يكون رخيصا جدا لكن مالك المطعم او الدكان سيخسر الكثير على المدى البعيد.
يجب على الدولة أن تحظر تصنيع مثل هذا النوع الرديء وتعاقب بشدة المخالفين كعقوبات ترويج المحدرات والبنقو، وتطلب من ملاك المطاعم والدكاكين استبداله بمنظومة أفضل حتى وان كان بالاقساط فهو مضر لاقتصاد الدولة ومنهك من ناحية استنزافها للعملة الصعبة.
الصورة 7 - التصميم السيء لنظام الطبخ "الدافوري" يؤثر سلبا في جميع نواحي الحياة
وبخار الماءوأيضا تلك الطاقة المهدرة سوف تضر بالبيئة نسبة لاحتوائها على غاز ثاني أكسيد الكربون وبخار الماء.
CO2& H2O
واللذين لهما دور في تغير المناخ (ولعلكم لا حظتم إحدى آثاره بالأمطار التي هطلت شتاء بمناطق متفرقة بالسودان)
…. يتبع
#Energy_Chaos_in_Sudan
#LinkedIn_Sudan
ملاحظات:
م1) حسبما قرأت قبل سنوات بتعليقات لأحد المهندسين بالفيسبوك (طبعا لأن المعلومة الحكومية بالسودان كأنها سر يمس الأمن القومي فلابد أن تتعب لمعرفه)، فإن اسطوانات الغاز بالسودان وغيرها من الدول تحتوي على خليط من غازي البيوتان والبرويان بنسبة 60:40
Propane (C3H8) – Butane (C4H10)
ويتبادلان هذه النسبة وفقا لتغير المواسم خصوصا الصيف والشتاء من أجل منع انسدلد فتحة الإسطوانات نتيجة التجمد للمادة الأخف كثافة. الإختلاف بالطاقة ليس كبيرا جدا بحيث يحدث تأثيرا في عمل المصانع والمطاعم. مادة “ايثيل ميركبتان” هي المسؤولة عن الرائحة المميزة لاسطوانات الغاز لمعرفة التسرب ومنع الخطر المحدق ببيئة المنزل أو العمل.
Ethyl Mercaptan
م2) مصلحة المجتمع الإقتصادية يجب أن تقدم على مسألة قطع رزق مجموعة محدودة جدا من الناس، بحظر صناعة ذلك النوع الرديء المسمى”الدافوري“. هناك دول حظرت صناعة او استيراد لمبات التنجستين (الكرة الحمراء الملتهبة) ذات 100 وات، لأنها تكلف الدول أعباء مصاريف كهربائية غير مفيدة، وهي بالسودان متوفرة وبكثرة لرخص سعرها وطبعا بالحسابات الإقتصادية فالصين تستفيد أكثر من بيع منتجاتها ذات الكفاءة المتدنية للسودان والتاجر السوداني يحضرها تحت سمع وبصر هيئة المواصفات والمقاييس، ونحن بالمقابل نصدر لهم ما له قيمة وفائدة وعملة حرة. مثل تصديرنا لمصر اللحوم الحية ونستورد أرطال من العلك واللبان والشوكولاتة، كان يمكن صناعتها في الوطن إن كانت هناك إرادة وطنية حقيقية وتوظيف للايدي الماهرة بدون واسطات (من دون ارغامهم على الهجرة) وبيئة استثمارية جاذبة لرؤوس الأموال الاجنبية لننافس بها السوق العالمي بدلا من التخبط الإقتصادي سواء كان بقصد أو بدونه وهم غالبة ساستنا هوالحصول على جزء من كعكة السلطة ليرضى ببيع وطنه في مزادات الخيانة والعمالة.
*********
الجزء الثالث
التاريخ: 17 يناير 2022
بالمنشور السابق، تحدثنا بأن نظام الطبخ الخاص بالمطاعم والدكاكين المسمى “بالدافوري“، لديه كفاءة تقريبية تصل ل 7%، وهذا يعد خسارة كبيرة للمواطن وضياع لموارد ثمينة واهدار للمال العام الخاصة بقطاع الطاقة للدولة السودانية، إذا ما قورنت بالكفاءة الحرارية الكلية لأنظمة الطبخ الحديثة “البوتوجاز” والتي تصل إلى قيمة تقريبية تعادل 40%.ء
إذا ما لاحظت يوما، أنظمة الطبخ الحديثة “البوتوجاز” وانت متجول بالأسواق، يوجد هناك سطح لامع يشبه المرآة. الغرض منه ليس من أجل زينة ديكور المطبخ، بل لها دور محوري في عكس الإشعاعات الحرارية سواء كانت القادمة من شعلة الموقد أو الجزء السفلي لحلة الملاح.
الصورة 8 - الإنعكاس الإشعاعي لللهب يساعد على زيادة الكفاءة الحرارية
بالنسبة لنظام “الدافوري” فلا يوجد به هذا الجزء العاكس وهو يوضع دائما فوق التراب أو الطوب وهذه المواد الأخيرة لها قيم عالية لمعامل الإشعاعية لكنها في نفس الوقت تضيع نتيجة ما يسمى بزوايا التشتت الإشعاعي. أضف لذلك بأن المسافة بين الفراغ الموجود بين جسم الدافوري والأرض تقريبا 15 سم، وهذا يؤدي لفواقد طاقة أخرى نتيجة حركة الهواء حولها.
الصورة 9 - التصميم سيء جدا لنظام الطبخ التقليدي "الدافوري" بالسودان
أيضا، فإن المعادن المؤكسدة التي تتكون من التفاعلات الكيميائية بين المعدن و الأكسجين لها معامل اشعاعية منخفض، وهذا يعتبر فقدانا للطاقة المأخوذة من اسطوانا الغاز.
مما سبق نستنتج، أن حلول الطاقة الخاص بقطاع الغاز المضغوط بالسودان، يتحتم علينا أن نستبدل تلك الانظمة القديمة (كالدافوري) بأنظمة أكثر كفاءة للمطاعم والدكاكين التي تعد الفول المصري، وانا متاكد بأن هذا الإجراء سيؤثر إيجابا على الناتج المحلي الإجمالي والإقتصاد السوداني معا.
–
…. يتبع
#Energy_Chaos_in_Sudan
#LinkedIn_Sudan
*********
الجزء الرابع
التاريخ: 20 يناير 2022
شدو العزائم يا قبيلة الهواسيب فرع المبرمجاب فقد جاءت لحظة الإبداع من قبلكم لحل مشكلة الطاقة بالسودان J
–
إن الدراسة البحثية لاعداد الفول المصري من خلال الوعاء (قدرة الفول) بالمطاعم والدكاكين، بينت أن العامل الاكبر للفاقد الحراري يتمثل في عملية التبخر المائي.
وفقا لافادات مالكي المطاعم، فإنهم يضعون تقريبا 14 كيلوجرام من الماء ومن ملاحظاتهم فإن نصف هذه الكمية تتبخر خلال الساعات 5 الخاصة بالإعداد للفول المصري.
من وجهة النظر لعلم الحرارة، فإن كمية تبخر 7 كيلوجرام من الماء تحتاج لطاقة حرارية تقريبا تساوي 5.04 كيلو-وات ساعة (وتذكر أننا قلنا بأن الفول يحتاج 1.95 كيلو-وات ساعة إذا تم عزله جيدا)
Water Evaporation of 7 Kg ≡ 5.04 KWh
Our Beans want 1.95 KWh only
من الواضح أن هذه تعتبر خسارة كبيرة لمالكي المطاعم وذات اثر سلبي على اقتصاد الدولة المنهك تماما من مسألة الطلب االمتزايد على الطاقة.
على كل هناك حل لاي مشكلة، وذلك من خلال اتحاد جميع العلوم مع بعضها البعض وعدم رفع راية العنصرية والافضلية لعلم على آخر وهذا سر نجاح العالم المتقدم لاحترامهم مجهودات الآخرين وسبب تاخرنا المستمر – كعرب ودول إسلامية – في كافة المجالات سواء كانت علمية أو أدبية.
الحل يكمن في التحكم الآلي لنظام الطبخ الحراري بالغاز بالآتي:
الخطوة رقم 1
عندما تبدا فقاعات البخار بالخروج من أعماق المياه وتصل لأعلى قمة هرم الوعاء (قدرة الفول)، فإن حساس درجة الحرارة – والذي سيتم ضبطه عند درجة حرارة 100 سلزيوس – سوف يعطي إشارة لوحدة المتحكم الدقيق (يشبه عقل الإنسان بالنظام) والتي ستبرمج بغلق صمام الغاز الصغير بواسطة محرك (موتور) صغير(يشبه يد الإنسان بالنسبة للبوتوجاز).
الخطوة رقم 2
عندما تهدأ الأمور (الإضطرابات الداخلية الخاصة بتولد البخار) داخل قدرة الفول، فإن حساس درجة الحرارة سوف يرسل إشارة ثانية من أجل فتح صمام الغازالصغيرببطء، وفي نفس اللحظة سوف تعمل وحدة الشعلة الكهربائية بالقرب من الموقد بشكر تكراري، إلى أن يرسل حساس الحريق أو ثاني أكسيد الكربون إشارة تفيد بأن هناك عملية احتراق كيميائي حدثت تحت الوعاء (يشبه عين الإنسان بالنسبة للبوتوجاز) وأنه يجب إيقاف الشعلة الكهربائية.
الخطوة رقم 3
هذه العمليات السابقة سوف تتكرر بشكل دوري إلى أن تتم عملية الطبخ بشكل ممتاز وهذا يعتمد على خبرتنا بالحياة.
الصورة توضح أجزاء نظام الطبخ الآلي.
الصورة 10 - مكونات نظام التحكم الآلي ببخار الماء داخل وعاء "قدرة" الفول
يمكن وضع مؤقت من أجل غلي مياه أو تسخين طعام لفترة محددة مثلما يحصل بالفرن.
إذا ما حصل شيء خاطئ لاي سبب كان (عطل بوحدة الشعلة أو المحرك )، فإن حساسات الأمان سوف توثق كل شيء من الصمام الرئيسي لاسطوانة الغاز وتفعل جرس الإنذار.
ايضا يمكننا أن نبرمج النظام ليرسل رسالة نصية أو إشعار بالبلوتوث عبر التطبيقات الحديثة (كالاندرويد\أبل) في حالة كنا على يعد أو نائمين.
هذه المعدات الإليكترونية يمكن أن تعمل ببطاريات شحن أقل من 12 فولت وهي لا تمثل شيئا مقارنة بالخسائر الحرارية لسلعة قد يندر وجودها بالمستقبل إذا لم نحسن استعمالها وطبقنا برامج كفاءة الطاقة بجميع مرافق الدولة.
الصورة 11 - الأجهزة والأدوات الإليكترونية المقترحة لنظام التحكم الآلي ببخار الماء
هناك الكثير من لغات البرمجة الخاصة بالمتحكمات الدقيقة يمكن التعامل معها مثل:
C/C++, JavaScript, Python, Raspberry PI & definitely easy one “Arduino”.
…. يتبع
#Energy_Chaos_in_Sudan
#LinkedIn_Sudan
*********
الجزء الخامس
التاريخ: 24 يناير 2022
الإقتصاد الوطني ضد استهلاك منتجات الغاز البتولي المسال (إسطوانات الغاز)
*-*__
بالحلقات السابقة، استنتجنا بأن هناك طرق هندسية لمعالجة مشاكل اهدار الطاقة الحرارية الخاصة بإسطوانات الغاز الخاصة بالمطاعم والدكاكين التي تقوم بإعداد الفول المصري
لنفترض جدلا أننا اخترنا طريقة العزل الحراري ونظام التحكم الآلي لجهاز الطبخ (اهملنا تغيير النظام السيء للطبخ المعروف بالدافوري وتم تضمين خسارته الحرارية بالحسابات).
من خلال الجدول الفني، ستلاجظ بأن الفقدان الحراري نتيجة عملية التبخر المائي هو الذي يأخذ نصيبا أكبر مقارنة بغيرها من الفواقد والتي تصل إلى:
Heat Loss due to Vaporization = 20.15 KWh
ولكن باستخدام نظام الطبخ الآلي، فإننا نستطيع الحد من هذه هذه الخسارة بشكل تام ومنع تكون فقاعات بخارية داخل الوعاء.
أيضا، فإن فواقد الحرارة نتيجة حركة الهواء انخفضت من 107 إلى 40 وات كما وضحنا بمثالنا بواسطة برنامج المجاكاة الهندسي.
Heat Rate Loss by Air Flow reduced from 107 to 40 Watt
الصورة 12 - الجدول الفني لاستهلاك الغاز المسال بالنسبة لاعداد الفول المصري
وذلك من خلال استخدام المواد العازلة حول الوعاء (قدرة الفول) وجعل درجة الحرارة الخارجية للحاجز الحراري أقل ما يمكن والتي كان لها دور فعال جدا في تقليل الفقد الحراري بواسطة الاشعاعات لانها ترتبط ارتباطا وثيقا بفرق درجات الحرارة بين الجدار الخارجي للوعاء و الحيز المحيط بها.
هذه التحسينات الصغيرة ستجعلنا من إعادة ملء إسطوانة الغاز للمطاعم خلال 14 بوما عوضا عن 4 أيام.
***__***
ماذا يعني ذلك من وجهة النظر الإقتصادية ؟
بحسب دراسة أعدتها جامعة الأحفاد (نقلا عن موقع جريدة النيلين الإليكترونية بسنة 2021) يأن عدد المحال الشعبية لبيع الأطعمة الجاهزة (مطاعم وكافتيريات وأكشاك) داخل الأسواق ووفي محيط مواقف المواصلات فقط باكثر من 10 ألف نقطة بيع.
حاولت جاهدا البحث عن بيانات دقيقة بالنت ولو لسنوات مضت، لعدد المطاعم المرخصة التي تقوم بإعداد الفول بالسودان ولكن كالعادة وكأنك تبحث عن المستحيل وكأنه سر من أسرار الدولة العميقة، ولذلك سنفترض بأن عدد المطاعم عبر ولايات السودان بدراستنا الحالية هو 10 الف كحد أدنى مع أنني متاكد أنه سيكون اضعاف ما ذكرته الدراسة السابقة التي حددت هدفها لمساحة محدودة فهي لم تراعي أيضا ما يحصل بالقرى من الدكاكين وبالولايات ومناطق الذهب والبترول والمزارع الطرفية.
على كل، كما هو موضح بالجدول الإقتصادي، فإن عدد مالكي المطاعم هو 10 ألف ويستخدمون أسطوانة الغاز يوميا في إعداد الفول المصري والطعمية. السعر التقريبي للغاز المسال كمنتج بالاسواق العالمية يتم شحنه بالسفن لشهر يناير لسنة 2022 هو 4.9 دولار لكتلة 12.5 كيلوجرام (من دون تعبئة أو ترحيل للمواطن).
وبحسابات بسيطة، سنجد أن الدولة تحتاج تقريبا إلى 11.4 الف طن متري سنويا بتكلفة قدرها 4.5 مليون دولار سنويا.
ولكن ,,,، إن طبقت تلك التحسينات الحرارية لذلك النظام السيء التصميم المدعو “بالدافوري”، فإننا سنحتاج استيراد 3.3 ألف طن متري ، وبالتالي فإن التكلفة ستقل بشكل كبير وستصبح 1.3 مليون دولار سنويا.
الصورة 13 - الجدول الإقتصادي لاستهلاك الغاز المسال بالنسبة لاعداد الفول المصري
باختصار، ستوفر الدولة مبلغ لا يستهان به بالخزينة يبلغ 3.2 مليون دولار سنويا (إذا كان منحنى معدل النمو أو الإستثمار ثابتا – وهذا مستحيل عمليا ولهذا وجب التفكير في حلول خلاقة تضمن استمرارية الحياة بالسودان).
هذه الاموال يمكن أن تصنع فرقا إما بزيادة المرتبات أو إقامة مشاريع حكومية ذات ناتج حفيقي وليس صوري على الورق وتذكر أن هذا المبلغ فقد تم باقنراض أن عدد المطاعم بالسودان هو 10 الف ولم ندخل حتى الآن في قطاع صناعة الخبز (الأفران التقليدية) والتي لن يساورني أدنى شك بوجود فواقد حرارية فوق التصور.
–
…. يتبع
#Energy_Chaos_in_Sudan
#LinkedIn_Sudan
ملاحظات:
أولا: تم تقييم النتائج بالجدول الفني باستهلاك اسطوانة الغاز كلها
) ثانيا: المخطط ذو الشكل المستطيلي ( الصورة 14) يوضح أسعار اسطوانات الغاز سنة 2008 بمناطق السودان المختلفة وجدتها قبل أيام وأنا ابحث عن معلومات خاصة بقطاع الطاقة بالسودان وضمنتها بهذا المنشور لأنها ذكرتنا بالماضي الذي كنا ندفع فيه أقل من 30 جنيها لاستبدال اسطوانة الغاز وهذا شانه كان مدعوما،
مرفق صورة 1 - أسعار استبدال اسطوانات الغاز سنة 2008 بالسودان
ولكن النمو السكاني المطرد وانفصال الجنوب بسنة 2011 أثرا كثيرا على العرض المتدني بالسودان ولهذا لجات الدولة لاستيراد المشتقات النفطية وهذا الأمر سيحصل ايضا عندما تحدث تنمية بإقليم دارفور نتيجة اتفاقية السلام بجوبا سنة 2020، وستشهد أزمة حقيقية بالسودان بخصوص غاز النفط المسال فهم (أهل دارفور) لهم الحق في التنمية لأنهم مواطنون درجة أولى، وبالتأكيد سعره سيرتفع بالسوق الاسود بسبب قلة المعروض. (يجب أن تستعد لمخاطر المستقبل ونخطط لها بمهنية وانسانية وتجرد وطني لا حزبي وإلا سيضيع الوطن بلمحة بصر عندما تستفيق .
يوما من سباتك العميق لعدم درايتك بما يدور داخل أركان بيتك من مشاكل ونزاعات عرقية)
*********
الجزء السادس
التاريخ: 4 فبراير 2022
سوف نغير من خط مسار حلقاتنا السابقة قليلا يشكل مؤقت، نسبة لمسألة عاجلة لابد أن نتحدث عنها، اكتشفتها بالأسبوع الماضي وهي تعتبر مشكلة حقيقية ليس فقط للسودان بل للعالم أجمع.
لابد أنه من خلال تواجدك بالمطبخ من أجل تسخين الماء البارد أو الحليب، فإنه يأخذ وقتا طويلا من أجل الوصول لدرجة الحرارة المناسبة الدافئة مقارنةبالمواد الصلبة كالحديد والنحاس حيث أنه يسخن بسرعة.
إحدى الأسباب العلمية للظاهرة لطء عملية التسخين للماء، لها علاقة بما يسمى ب”الإنتشارية الحرارية”.
Thermal Diffusivity
المسافة بين جزيئات السوائل بعيدة مقارنة بجزيئات المواد الصلبة والتي تكون قريبة لبعضها البعض.
من أجل فهم معنى أدق لعبارة ” الإنتشارية الحرارية“، تخيل أن هناك موظف يعمل بخدمة البريد وطلب منه توصيل طرد لموقع يبعد نصف ساعة بالعجلة في رحلة ذهاب فقط. وهذا يعني أنه يحتاج لساعة كاملة للرجوع لمكتبه لبدء مشوار جديد لكل طرد، وهناك ستكون عدة طرود بريدية لابد من ارساله بسرعة يوميا ولكنه لا يستطيع القيام بالمهمة بالشكل الأمثل والفعال نتيجة عبء العمل الشاق والغستخالة في بعض الأحيان ولهذا سيكون هناك تأخير.
ولهذا فالموظف المسكين لديه حلان:
1) إما أن يغير طريقة نقل الطرود البريدية (استبدال العجلة بسيارة)
2) أو زيادة عدد الموظفين والذين بالتأكيد سيستخدمون نفس طريقة النقل (العجلة).
_____ ____
هذا تماما ما سوف نقوم به من أجل حل مشكلة تدني الإنتشارية الحرارية للسوائل.
تصميم خاص لوعاء الطبخ (حلة ملاح) تعطي تحسين للكفاءة الحرارية.
لقد تم اختبار هذا “الوعاء المتقدم” تقنيا بواسطة برنامج المحاكاة الهندسي وقمنا بعملية التسخين لجحم ماء 2.5 لتر لمدة 8 دقائق.
النتائج وضحت أن متوسط درجة حرارة الماء ب”الوعاء المتقدم” هو 90.2 درجة سلزيوس، بالمقابل فإن “الوعاء العادي” كان متوسط درجة حرارته 78.9 درجة سلزيوس
الصورة 14- توزيع درجات الحرارة على وعاء عادي يحنوي على ماء سعنه 2.5 لتر
هذه إحدى الافكار التي تمت اختبارها بنجاح وهي ستساعد في توفير المال والطاقة للافراد والدولة وأيضا ستحافظ على البيئة.
الصورة 15- استخدامات متنوعة لنظام التسخين الجديد
–
…. يتبع
#Energy_Chaos_in_Sudan
#LinkedIn_Sudan
ملاحظات:
أولا: لغلي 1 لتر من ماء الحنفية فإنها تحتاج ما بين 6 – 8 دقائق باستخدام موقد الغاز و تحتاج ما بين 9-12 دقيقة باستخدام الموقد الكهربائي. إذا كان الماء مقطرا، فإنه يحتاج ل6 دقائق باستخدام الموقد الغازي و 8 دقائق باستخدام الموقد الكهربائي.
[Source: beezzly.com]
ثانيا: الحوائط بالاختبار الخاص باستخدام برنامج المحاكاة الهندسي كلها معزولة من أجل تسهيل الدراسة وهذا يفسر السبب العلمي لسرعة التسخين (سواء كان للوعاء العادي أو المتقدم) مفارنة بما يحصل بالعالم الحقيقي حيث أنه يتأثر بالتصادمات ما بين ذرات الهواء وبين الماء والجدار الوعاء من جهة. على كل سنحصل على نفس النتائج غذا ما كانت ظروف البيئة الخاصة بالتجربة متشابهة لكل من الوعاء العادي والمتقدم.
*********
الجزء السابع
التاريخ: 25 مارس 2022
#الإختراع_1: تكنولوجيا جديدة لتسخين الأجسام
## ## ##
يقولون: “عندما تتعمق داخل بحر المشكلة متسلحا بأدوات العلم والمعرفة، فتأكد أنك سوف تجد الحل الذي يفوق توقعات الناس حتى ولو بعد عقود من الزمن، وسيحترمونك للأبد من أجل جعل عالمهم أفصل من الماضي”.
–
هناك بعض الأفكار التي وجدتها خلال رحلتي الممتعة لهذه المقالة والتي تختص بإعادة تصميم مواقد الطهو والأفران أو حتى أواني الطهي نفسها حيث أن الأخيرة لها نفس التصميم منذ قرون. بعض هذه الأفكار من الصعوبة على أن أنفذها يشكل عملي نسبة للظروف الالية والتقنية.
الصورة 16 – بعض معدات الطهي والتسخين
الإختراع 1 تم تصنيعه وقد استغرق معي 3 أسابيع منذ لحظة التخطيط حتى نشر ملف الفيديو. بالرغم من أن الإختراع سيء التصميم وفقا لامكانياتي المتاحة، إلا أنه كان فقط عبارة عن إثبات لمبدأ العمل.
ولهذا ستكون خطوتنا القادمة هي استخدام برامج المحاكاة الهندسية لتحسين التصميم وكفاءة الطاقة وأيضا التبادل الحراري لهذه التكنولوجيا الجديدة.
الصورة 17 - المحاكاة الهندسية لحركة الهواء في مجال صناعة السيارات
إن برامج المحاكاة الهندسية لهي بالفعل أداة ذو قدرة ضخمة فوق التصور تجعلك تشعر بأنك تمتلك مختبر افتراضي بأدوات وأجهزة غالية الثمن من أجل اختبار تصميمك وهذا يوفر الوقت والجهد والمال للتصنيع.
الصورة 18 - النفق الهوائي الحقيقي لاختبار تصميم السيارات
الصورة 19- النفق الهوائي التخيلي باستخدام برامج المحاكاة الهندسية
إذا شاهدت الفيديو الخاص باختراعي الأول بالحلقة الماضية، ستتذكر أنني قلت ” بأن الجهاز سيء التصميم والذي بدوره أدى لانخفاض فعاليته حيث أنه يأخذ وقتا طوبلا لتسخين الطعام، لقد كان مجرد اثبات مبدأ العمل”.
ولهذا قررنا أن نستخدم برامج المحاكاة الهندسة الخاصة بالأنظمة الحرارية لنرى العيوب بتصميمنا الأولي.
لقد افترضنابأن لدينا قطعة بيتزا قطرها 5.5 سم وسماكة 0.5 سم.
عندما قمنا باختبارالمحاكاة للتوزيع الحراري لقطعة البيتزا، أدركنا أشياء كثيرة عما يحصل داخل الجهاز وقطعة الإختبار. لقد ارتفعت درجة الحرارة من 25 إلى 60 درجة سلزيوس وكان الوقت المستغرق لعملية التسخين هو 16 دقيقة
الصورة 20 - اختبار المحاكاة الحاسوبي للتصميم الإبتدائي
لقد أعطتنا هذه النتائج رؤية واضحة عن الكيفية التي يجب أن تحل بها المشكلة بعد تشغيل حالة العصف الذهني للافكار لدي لأيام.
–
لقد قمنا باختبار بعض التصماميم الجديدة باستخدام برنامج المحاكاة حتى وجدنا التصميم المتطور المثالي. هذا التصميم يستطيع تسخين قطعة البينزا خلال 6 دقائق فقط لنفس درجة الحرارة المستهدفة (حتى أنه يمكننا أن نفلل الزمن لأفل من ذلك) ولكن الآن برزت مشكلة جديدة لها علاقة بكفاءة الطاقة فالوقت تحسن ولكن الكفاءة قلت.
الصورة 21- اختبار المحاكاة الحاسوبي للتصميم المتطور
المطاعم ستفضل أنظمة التسخين السريعةمن دون القلق بشأن فاتورة الطاقة لأنهم يعلمون أن زبائنهم سيدفعون تلك التكاليف، ولكن الدولة ستعاني إقتصاديا من ضياع الطاقة.
على كل ، إنه تقدم إيجابي وسنحافظ على السير قدما بثبات حتى نصل للإنجاز النهائي
…. يتبع
#Energy_Chaos_in_Sudan
#LinkedIn_Sudan
*********
الجزء التاسع
التاريخ: 13 أبريل 2022
بالاسابيع الماضية، كنت ابحث بالإنترنت عن كفاءة الطاقة الكلية لأجهزة التسخين الموجودة بالمطبخ مثل المواقد والافران والمايكروييف وغيرها.
لقد صدمت عندما اطلعت على النتائج. لقد كانت الكفاءة متدنية جدا على النحو الآتي (كقيم متوسطة):
– الأفران الغازية (ذات المروحة): 9%ء.
– الأفران الكهربائية (ذات المروحة): 17%ء.
– المايكروييف: 57%ء.
كنت أسأل نفسي لماذا الأفران الحديثة حتى الآن لديها كفاءة حرارية متدنية ؟
ولماذا لا تضع الشركات المصنعة بطاقة توضح كفاءة الجهاز المعني الخاص بالفرن وأن يتم اختيار مادة (طعام) قياسية لتكون قاعدة لتقييم كفاءة الكاقة عالميا.
إخفاء الحقيقة لن يجعل منتجك هو الأفضل بالسوق. الزبون له الحق في معرفة جودة ما اشتراه.
عندما قمت باستخدام برنامج المحاكاة الهندسي لتسخين قطعة صغيرة من البيتزا باستخدام فرن كهربائي تقليدي، أدركت حينها السبب الرئيسي في تدني الكفاءة الحرارية. (لقد تم استبعاد المايكروييف من الدراسة لأن آلية عمله مختلفة من ناحية المبدأ وحدود درجة الحرارة القصوى والتي لن تتجاوز 100 درجة سلزيوس ).
أولا، إن التصميم التقليديرللأفران غيرمجدي وغير كفء حيث أنه يؤدي لتحريك الهواء بشكل دوري بعيدا من الطعام كما نرى من الصورة المرفقة رقم (22)، بنتيجة تجربة المحاكاة. هذا يعني أننا نضيع وقتا وطاقة. وحتى إن تم استخدام مروحة (والتي تعني إضافة أعباء أخرى لفاتورة الكهرباء على جيب الزبون). لكن السبب الثاني يعتبر جوهريا.
الصورة 22- حركة الهواء و درجة الحرارة لقطعة البيتزا ببرنامج المحاكاة
ثانيا، إن الأمر له علاقة بكمية الحرارة التي يتم امتصاصها عبر الطعام المراد تسخينه، حيث أن الكمية سوف تنخفض مع الزمن والقدرة الكهربائية لنظام التسخين ستستمر بالعمل كما نرى بصورة المنحنى التخطيطي (باختبار المحاكاة، افترضنا أن الحوائط معزولة تماما، وبالتالي فإن الفواقد كما موضح بالصورة رقم (23) ستزيد حتميا في التجارب الحقيقة).
الصورة 23- منحنى التغيير للطاقة والحرارة للفرن الكهربائي مع الزمن
لقد اكتشفنا الفيروس الذي سبب المرض.
والآن نستطيع إنتاج اللقاح بسهولة بالمختبر
…. يتبع
#Energy_Chaos_in_Sudan
#LinkedIn_Sudan
*******
الجزء العاشر
التاريخ: 3 مايو 2022
الفوضى 2: استهلاك الكهرباء للمكيف الصحراوي “التبخيري”
أجهزة التكييف المائية (والتي تسمى أحيانا بالمكيفات الصحراوية) تستخدم الماء من أجل تبريد الهواء وذلك من خلال ظاهرة الترطيب بأن يتم تحويل الهواء الجاف الساخن لهواء رطب بارد وذلك من خلال تبخر الماء نتسجة مرور الهوا الجاف.
بالطبع هذا النوع من الأجهزة ذو كفاءة تبريد عالية ومناسب للطبقات المتوسطة، لرخص ثمنه وسهولة تركيبه إذا قارنته مع أجهزة التكييف الغازية (الإسبلت) لكن إن كنت تعاني من مشاكل صحية خاصة بارتفاع رطوبة الجو فهذا النوع غير مناسب لك. أيضا أحد عيوبه أنه لا يعمل إلا بالمناطق التي لديها نسبة رطوبة متدنية (كالخرطوم مثلا) وأما المناطق الساحلية (كبورتسودان) فإنه غير مفيد البتة إلا إذا أضفت جهاز تخفيض الرطوية ومن ثم دمجته مع المكيف الصحراوي ليعملا معا بتوافق وانسجام تام.
ما نود أن نتحدث عنه اليوم هو مدى رداءة التصميم الهندسي لجهاز التكييف الصحراوي بشكله المتعارف عليه “الصندوق” والذي يؤثر سلبا على الإستهلاك الكهربائي للمواطن أولا واقتصاد الدولة ثانيا، بحيث تتراوح قدرة الأجهزة ما بين 400 – 1200 وات بحسب مكونات وسعة المكيف.
Avg. Electrical Power for Desert Cooler: 400 ~ 1200 Watt
الصورة 24- تصميم المكيف الصحراوي ذو الشكل الصندوقي
فعند استخدام برامج المحاكة الهندسي لمنظومة تكييف كما موضحة تفاصيلها الفنية بالصورة (25)، بالشكل فإن فقد الضغط بالنسبة لهذا التصميم كان كالآتي:
Pressure Drop @ Upper Inlet = 295.4 Pa
Pressure Drop @ Middle Inlet = 308.1 Pa
Pressure Drop @ Lower Inlet = 294.9 Pa
الصورة 25- محاكاة هندسية لحركة الهواء داخل المكيف ذو الشكل الصندوقي
وبالتالي يمكن اعتبار فقد الضغط المتوسط هو 300 باسكال، وعندما يتم ضربه مع معدل السريان للهواء فإننا نحصل على قدرة هيدروليكية مقدارها:
Aerodynamic Power = Pressure Drop X Flow Rate = 300*1.44 = 432 Watt
وإذا افترضنا أن كفاءة الموتور الكهربائي هي 80%، فإن القدرة الكهربائية للمكيف ستكون:
Electrical Power = Aerodynamic Power / Efficiency = 432/0.8 = 540 Watt
هذه القيمة فقط للوصول لمخرج الهواء البارد بمعدل سريان 1.44 متر مكعب للثانية (3051 قدم مكعب للدقيقة).
تأثير فقد الضغط بالنسبة لقش التبريد الجديد ليس كبيرا (ويمكن اهماله) فهو لن يتجاوز قيمة 12 باسكال إذا تم اختيار القش ذو الجودة العالية والمادة المناسبة.
Pressure Drop across the new Cooling Pads will not exceed 12 Pa
الصورة 26- أنواع قش التبريد المشهورة بالعالم
وبالتالي فإن إعادة تصميم الشكل الصندوقي للمكيفات الحالية هو الحل لتخفيض التكاليف سواء كانت بالنسبة لفاتورة الكهرباء أو اختيار نوع الموتور المتوافق مع بيانات فقد الضغط الكلي ومعدل السريان.
…. يتبع
#Energy_Chaos_in_Sudan
#LinkedIn_Sudan
ملاحظات:
1) لا تهتم بشراء مكيف رخيص بقدر أن تهتم بحجم الغرفة أو الصالة التي تريدها أن تكون باردة بأي ركن من اركانها ولعلك لاحظت أنه دائما ما نسعى لاختيار موقع استراتيجي بالغرفة أو بالمسجد لأننا نعرف بأن الهواء البارد والمنعش سيكون هناك وهذا طبعا خطأ في اختيار ما هو مناسب لحجم الحيز المراد تبريده والذي يجب أن يكون باردا في أي نقطة منه ولكن …. عدم اهتمامنا بالمواصفات وحبنا للعشوائية – لانها لا تكلف مالا – التي قد تضرنا في بعض الاحيان مما تلحق بنا ضررا سواء كان ماديا أو جسديا.
2) عندما تريد التعامل مع شركة تكييف لمشروع معين لابد أن توضح لك الشركة كفاءة التكييف وفقا لدرجات الحرارة والرطوبة على مدار السنة وأنه إذا حصل نقص معتبر يؤثر سلبا على مشروعك فلابد أن يتم التعويض من قبل شركة التكييف لأنها إلتزمت بتقديم خدمة ممتازة وليست مجرد تركيب والموضوع انتهى– إلا إذا كانت ظروف طبيعية أثرت في عملية التبريد – ، وفي الغالب سيكون إما نوعية القش غير جيدة و رخيصة أو أن التصميم غير متوافق مع متطلبات المشروع المعني. وأيضا يجب الاخذ بالإعتبار بالصيانة الدورية خصوصا خلال موسم الاتربة (الكتاحة) والترسبات سواء كانت كيميائية أو بيولوجية (بكتيريا) لأنها ستقلل من كفاءة التبريد بشكل كبير.
*******
الجزء الحادي عشر
التاريخ: 13 مايو 2022
الفوضى 2: استهلاك الكهرباء للمكيف الصحراوي “التبخيري”
إذا كنت تمتلك مكيف صحراوي ذو النوع الصندوقي بالبيت أو المصنع، فلا بد أنك لاحظت وجود فتحات هوائية قبل وصول الهواء لقش لتبريد كما نرى بالصورة (27).
الصورة 27- فتحات بالمكيف الصحراوي
كنت أتسائل في نفسي، ما هي الفوائد من هذا الترتيب الخاص للفتحات الهوائية بهذا الشكل بالرغم من أن هذا التصميم سيء من ناحية علم الديناميكا الحرارية ؟
هل له علاقة بزيادة كفاءة التبريد ؟
أنا أشك بذلك، فالسرعة النسبية بين الهواء والماء هي العامل الرئيسي من أجل تحفيق ذلك الغرض (زيادة الكفاءة التبريدية)، ولكن بحالتنا الحالية،فإن زاوية دخول الهواء تجعله يتحرك تقريبا باتجاه موازي لحركة الماء بقش التبريد نتيجة تأثير الجاذبية الأرضية. الزاوية يجب أن تكون معكوسة إذا كان ذلك هدفنا الرئيسي.
إن قش/كرتون التبريد المسمى ب”سيلديك 7090-15″ والذي يتكون من مواد سيليلوزية والمصنع من قبل شركة “مونتيرس”
CELdek 7090-15 cooling pad (cellulose material) that manufactured by “Munters”
يحتوي على تصميم فريد نوعه لقش التبريد،بحيث أنه يوجد ممران داخليان لسريان الماء والهواء وزاوية ميل كل منهما هي 60 و30 درجة بالتتابع. أي أن الزاوية المحصورة بينهما 90 درجة كما نرى بالصورة (28). ().
الصورة 28- قش التبريد السيلديك
كما تدعي الشركة: فغن هذا التصميم يمنع من تكون الطحالب وترسب المعادن بمادة القش التبريدي. وبالتالي فإنها تسقط للأسفل عندما تجف. وأنها أيضا تحمي قش التبريد من آثار الضرر المترتب على الطقس القاس والتعرض الطويل للأشعة فوق البنفسجية. وبالتالي ستزيد من مدة الإعتمادية مقارنة بأنواع القش الخرى بالسوق.
على كل حال، وجود زاوية ميل للممرالهوائي داحل قش التبريد هو أفضل بكثير من وجود فتحات هوائية بالجزء الخارجي للمكيف الصحراوي لأن الاخيرة تقوم بوظيفة حاجز لحركة الهواء.
ولهذا، قررت أن أجد فقد الضغط للفتحات الهوائية والتي تستخدم دائما لقش التبريد المصنوع من مادة الأسبين
(Aspen) – خليط من نشارة الخشب والفايبر الإصطناعي
وهو رخيص الثمن مقارنة مع قش الكرتون المصنوع من السيليلوز – باستخدام برنامج المحاكاة الهندسي.
كما نراها بالصورة (29)لقد وجدنا أن فقد الضغط كان حوالي 7.3 باسكال، والذي يمثل قدرة كهربائية غير ضرورية مقدارها 13 وات.
Pressure Loss = 7.3 Pa & Electrical Power = 13 Watt
الصورة 29- اثر الفتحات ببرنامج المحاكاة على المكيف الصحراوي
هل حقا تستحق هذه الطاقة الضائعة لقش التبريد لمادة الإسبين ؟
كحل لهذه المشكلة، لماذا لا نضع سقف معلق شمسي بدل الفتحات الهوائية، على الأقل يمكن الإستفادة من المساحة الغير مستغلة في توليد الكهرباء بموسم الصيف؟.
يتبع
#Energy_Chaos_in_Sudan
#LinkedIn_Suda
*******
الجزء الثاني عشر
التاريخ: 15 مايو 2022
الفوضى 2: استهلاك الكهرباء للمكيف الصحراوي “التبخيري”
فكرة فوق الخيال: تحويل الطقس الرطب إلى جاف للمدن الساحلية
** **
بغض النظر من مميزات استخدام المكيفات الصحراوية سواء كان بالبيت أو مكان العمل، هنالك عيب قد ينسف كل تلك الممزات: وهي أنها تحتاج لنطقة ذات طقس جاف من أجل توفير هواء بارد للمستخدم.
المدن الساحلية تعاني من الطقس الرطب بسبب قربها من البحر. ولهذا فإن السكان يستخدمون نظام مكيفات الفريون بموسم الصيف والتي ستكلف المواطن فاتورة كهربا عالية جدا.
استخدام جهاز تخفيض الرطوبة ودمجه مع المكيف الصحراوي قد تكون فكرة إبداعية وذكية، ولكنها ليست فعالة وغير عملية للأغراض الشخصية من أجل تبريد منزلك.
بالايام الماضية، كنت أفكر حول هذه المشكلة وقلت لنفسي:
“لماذا لا نقوم بتغيير الطقس بالمدن الساحلية ؟”
لقد قمت بدراسة وتحليل حالتنا الحرجة بالنسبة لعملية الترطيب وقد وجدنا أن أفضل حل هو بناء ما أسميته “حائط الإتزان الطقسي” كما نراه بالصورة (30).
Climatic Equilibrium Wall
اسمح لي بأن اشرح لك بلغة الهندسة كيف يعمل هذا الحائط.
إذا كنت مطلعا على أنظمة التبريد المسمية ب
HVAC” أو سمعت بمؤسسة اسمها “أشراي” – “ASHRAE “،
فأنت بالتأكيد تعرف بأن هنالك مخطط مشهور يدعى ب”مخطط الرطوبة” والذي يستخدم لتحديد الرطوبة النسبية، الكثافة ودرجة الحرارة الجافة والرطبة للهواء تحت ظروف الضغط الجوي العادية، كما بالصورة (31)
Psychrometric Chart
كل نقطة بالصورة (30) لديها رقم تمثل الحالة الجوية للهواء بالترتيب كما يلي:
النقطة (1): في البداية، سنفترض أن الهواء بمنتصف البحر (أو الارض القريبة من البرج) درحة حرارتها 40 درجة سلزيوس وأن الرطوبة النسبية هي 20%. وبالتالي فغن كثافة الهواء الرطب بالنسبة للنقطة 1 ستساوي 1.122 كغم/متر مكعب سواء كان بالبحر أو قرب البرج.
Temperature (T1) = 40 °C
Relative Humidity (RH1) = 20%
Density (ρ1) of Wet Air = 1.122 Kg/m3
النقطة (2): بالنهار، فإن حركة الرياح ستكون من ناحية البحر نحو اليابسة، نتيجة الحقيقة العلمية بأن اليابسة تسخن أسرع من البحر، وبالتالي فسيكون هنالك اختلاف لكثافة للهواء على سطح اليابسة والماء.
ولهذا فإن الهواء سوف يتم ترطيبه ويبرد في نفس الوقت خلال مرروه عبر المسار البحر (وهذا يفسر سبب ذهاب الناس للشاطئ بموسم الصيف).
إن درجة الحرارة ستصل ل 22 درجة سلزيوس (إذا كانت العملية الحرارية من النوع المكظوم) مع افتراض أن الرطوبة النسبية وصلت ل100%. كثافة الهواء الرطب ستكون 1.185 كغم/متر مكعب.
Temperature (T2) = 20 °C
Relative Humidity (RH2) = 100%
Density (ρ2) of Wet Air = 1.185 Kg/m3
النقطة (3): الآن، سنفترض أن الهواء البارد تم تسخينه من خلال اتصاله بالوسط المحيط به مع مرور الوقت، وبالتأكيد فإن درجة الحرارة ستصل ل 40 درجة سلزيوس. سنفترض جدلا بأن الرطوبة النسبية ستبقى ثابتة وهو أسوأ سيناريو ممكن. وبالتالي، فإن كثافة الهواء الرطب ستكون 1.097 كغم/متر مكعب وهذا سيؤدي لارتفاع الهواء الساخن للأعلى (أثر الطفو بفعل الجاذبية الأرضية).
Temperature (T2) = 40 °C
Relative Humidity (RH2) = 100%
Density (ρ2) of Wet Air = 1.097 Kg/m3
ماذا سيحصل الآن ؟
راجع الصورة رقم (30).
بالجانب الجاف، لدينا كثافة الهواء الجاف تساوي 1.122 كغم/متر مكعب.
يبنما كثافة لهواء بالجانب الرطب هي 1.097 كغم/متر.
– في الظروف العادية، فإن الجاذبية ستؤثر أيجابيا (أثر الطفو) وسيتحرك الهواء الجاف ليكون بالطبقة السفلى والهواء الرطب الطبقة العليا، ولكن بارتفاع محدد للحائط، فإن تاثير الجاذبية ستكون محايدة ولن يحدث شيء.
لا يوجد مقارنة بشأن الاستهلاك الكهربائي للمكيف الصحراوي والذي تبلغ قدرته تقريبا 500 وات لكي تؤدي نفس المهمة لمكيف الفريون والذي يستهلك قرابة 2000 وات بالبيت أو المصنع.
هنالك كثير من المدن الساحلية ذات الكثافة السكانية العالية بالعالم كسيدني، طوكيو، سنغافورة، بومباي، دبي، روما، نيويورك وغيرها. إنها تعتبربمثابة مغير لعبة لاقتصاد الطاقة للدول.
يتبع
#Energy_Chaos_in_Sudan
#LinkedIn_Sudan
ملاحظات:
1) بيانات النقاط تم الحصول عليها من مخطط الرطوبة القياسي، ما عدا النقطة (3) وكثافة الهواء الرطب والتي استخدمنا فيها قوانين الديناميكا الحرارية.
3) تذكر أن النقطة رقم (3) هو السيناريو الاسوأ بدراستنا وقد لا يحصل بتاتا بسبب عوامل كثيرة منها انتقال الحرارة والتكثيف وغيرها من العوامل. وبالتالي فإن ارتفاع جائط الإتزان الطقسي سيكون أقصر مما هو متوقع.
3) بالليل، فإن المنطقة الرطية ستتعرض لدرجات حرارة منخفضة، وهذا يؤدي لتكثيف البخار الموجود بالهواء الرطب. إنه يعتبر مشروعأعمال لإنتاج مياه مقطرة من الهواء الجوي.
4) “HVAC” Is abbreviation for Heat, Ventilation & Air-Conditioning.
4) “ASHRAE” is also abbreviation for American Society of Heating, Refrigerating and Air-Conditioning Engineers, Inc
These based-day notes has been published in my Linkedin account under tag @Energy_Chaos_in_Sudan & I though it’s a good idea to collect them in one article. It will be updataed periodically.
###
Index of Problems
Chaos 1: LPG Consumption in Restaurants (e.g. Egyptian Beans) [Part 1 to 9]
Chaos 2: Electrical Consumption of Evaporative “Desert” Cooler [Part 10 to >>>]
Chaos 3: LPG Consumption in Groceries (e.g. Milk)[Soon/Studying]
Chaos 4: LPG Consumption in Bakeries [Soon/Studying]
*********
Part 1
Date: 7 Jan 2022
Chaos 1: LPG Consumption in Restaurants (e.g. Egyptian Beans)
I decided to change my strategy again & return to solve problems within my local area rather than what happen in the world due to challenges occur recently related to the energy industry in the country.
Even I was really upset & angry with them, as I have previous disappointed moments since 2010, either with public or private sectors to solve problems, but …
They said: “Rome didn’t build in one day”
So, it seems that I should prove myself locally if I want to move on the ladder to be an international researcher in scientific fields.
********************
5 or 6 Years ago, my friend who own a grocery, asked me to solve for consuming a lot energy by LPG cylinder for cooking Egyptian beans which he sell it to people daily. It was very obvious excessive heat was the loss, so I told him immediately to surround his big pot by bricks. He was smiling & I can’t blame him to do something weird that nobody do it in his community. Definitely he didn’t do what I suggest. Maybe he think I’m crazy engineer.
Fig (1) - Cooking Times for Egyptian Beans & Falafl in my Village
Anyway, there are other losses I didn’t account for in that period such as: evaporation & combustible process & it will be addressed here.
Now [2022] a threat will come from supply chain of LPG cylinders sufficiently due to many factors such as:
Signing Peace Agreement [ends the war in Darfur with government, which they have the right to have electricity, water & cooking gas like other normal citizens instead of being refugees ]
Increasing the population [ Burden on the annual governmental budget]
The economical Graduating Shock for middle & low level labor [save any penny for future as wage 75 USD/Month].
Black market will arise eventually for LPG cylinders products.
When the pain is increased in life of people & get close of the point of breakdown, they will hang-in by everything, even by a thin rope of illusion as they mind tell them: ”Maybe that the solution”.
Implementing programs of energy efficiency (Grants & Fund) will be the solution & it’s NOT adopted at all – as my knowledge – here in Sudan. That’s why there is a CHAOS.
Restaurants rather than change one LPG cylinder in 3 or 4 days, they can let it last up to a month, which will be a huge save for their daily expenses & the economics of the country.
Fig (2) - Required Energy for Egyptian Beans & Falafl in my Village
One of the solutions for heat loss in restaurants (who are making Egyptians peanut) is by using isolated bag from specific materials (e.g. cotton, wood & fiber-glass).
It has been tested by using an engineering simulation of natural flow of air on hot cooking pot & the results as we see indicate that we can save more than 50% of heat loss daily.
Fig (3) - Velocity contours of Air in Simulation software "ANSYS-Fluent"
Fig (4) - Normal situation of pot without insulated material
Fig (5) - Modified situation of pot by using insulated material
#LinkedIn_Sudan
#Energy_Chaos_in_Sudan
….. to be continued
*********
Part 2
Date: 12 Jan 2022
Efficiency is a measurable approach to know the performance of our system in specific conditions & with/out any technical modifications may be made, for saving money & time to end-users.
In cooking appliances, modern cook-top (cooker) has an OVERALL Efficiency of converting heat (chemical reaction) to a useful energy which is reached a specific amount of food, is approximately 40%.
An LPG cylinder of 12.5 Kg (if it’s filled by 100% of Propane gas – C3H8) has energy up to 170 KWh.
That’s mean, thermal energy of 68 KWh is transferred into food perfectly & other will lose eventually either in forms of heat transfer (e.g. radiation), water evaporation or incomplete chemical reaction due to lack of oxygen (yellow color in spark is the evidence for that, as the blue color is the normal situation).
When I apply this concept of efficiency with our case of cooking Egyptians beans in our local restaurant in my village [which takes 5 hours daily & then they replace LPG cylinder after 4 days], I was confused as there is discrepancy in values of my calculations, that I don’t know where the mistake is.
It’s doesn’t add-up at all with our live experiment!!
I was wondering if The main LPG Company in Sudan is really filling the cylinder by 100% & they don’t cheat on us (Like other institutions/companies) as there is no independent supervision of their work from the production line until it reach the end-user.
Nobody care to measure the pressure/weight of LPG cylinders especially from small stores in cities & that’s really the chaos of energy “Corruption”.
Thinking a lot about my scientific case for days, and after that I realized how I’m so stupid.
Our local restaurants & groceries in Sudan using an old type of cooker system called “Davori”.
Now I was relief as it explains everything.
You may not believed, but according to my case study, the overall efficiency of “Davouri” cooker for preparing 14 Kg Egyptian beans is 7.3%
Horrible, right?!
Fig (6) - Efficiency Comparison between Modern & Traditional Cooker in Sudan
This is really bad & bad design of cooking device [which is – as I informed – made by non-technicians in Sudanese market] & it should be banned by government similar to drugs, as it costs the national economics & the owners of restaurants a lot of money.
Fig (7) - Bad Design of Traditional Cooker "Davouri"
Without forgetting, the negative effect on environment (e.g. Climate Change) for releasing excessive amount of Carbon dioxide (CO2) & Vapor (H2O) without any necessary.
#LinkedIn_Sudan
#Energy_Chaos_in_Sudan
….. to be continued
*********
Part 3
Date: 17 Jan 2022
In previous part, we concluded that that efficiency of traditional cooker system named as “Davouri” – which used in almost local restaurants & groceries in Sudan for preparing Egyptian beans – is approximately equal to 7% compared to modern cooker system which has efficiency up to 40%.
Why that’s happen?
If you notice any modern cooker in the market, you may notice a soft reflected surface similar to mirror near the ignition stove. This unique surface has not built as a beauty decor unit inside kitchen. It has really significant role in reducing heat transfer by radiation, as it reflects downward & side rays of either from spark ignition or the bottom of cooking pot.
Fig (8) - Reflection Surface in Stove of Modern Cooker
In opposite, the ‘Davouri” system has no reflection surface on it. They put it on soil/rocks, although these materials have a good emissivity value, but it has a problem with the scattering angles of radiation. Add to that, there is gap between system & ground up to 15cm, which will be considered as heat loss due to the convection effect of air flow.
Also, the oxidized metals which are made by chemical interaction between hot metal & oxygen in “Davouri” system, has a low emissivity, which means another energy loss from LPG cylinder.
Fig (9) - No Reflection Surface in Davouri Cooker System
So, the solution of energy issue related to LPG sector is obviously by replacing the old system with efficient type of cooker system for restaurants & I’m sure; it will affect positively on the gross domestic product (GDP) of Sudanese economics.
#LinkedIn_Sudan
#Energy_Chaos_in_Sudan
….. to be continued
*********
Part 4
Date: 20 Jan 2022
Our research study of cooking Egyptian beans showed that, the major player in heat loss was the water evaporation.
I have asked some owners & they said they put approximately 14 Kg of water & from their notice; half of that water was evaporated from cooking pot after 5 hours of operation.
From thermal point of view, these 7 kg of evaporated water wants energy equal approximately to 5.04 KWh (Recall that : our beans wants only 1.95 KWh of energy if it’s been insulated perfectly).
Huge daily loss of energy for citizen budget & nation economic, isn’t?
It’s by controlling our cooking system automatically as follows;
1) When some bubbles of water starts converts into vapor & rise up to the top of cooking pot, there will be a temperature sensor which definitely will be controlled in 100 °C. This sensor will send a signal to micro-controller unit (similar to human brain) which will be programmed to close the mini-valve of gas by using small motor (similar to human hand).
2) When everything is calm (No Vapor), our temperature sensor will send another signal which will open mini-valve slowly & simultaneously, the electric ignition (spark) unit will start to work repeatedly. The CO2/Fire sensor will be responsible to make sure that there is chemical combustion under the pot (similar to human eye), then the ignition unit will stop from working.
3) These previous processes will be repeated periodically until our food is cooked well according to our experience in life.
The photo of programmable cooker system, contains all what we talked about to make the job done & save money & environment as well.
Fig (10) - Progmmable Cooker System for Controlling Water Vaport
There is a timer, if you want to boil water/heat-up food for specific time similar to oven.
Now, if something going wrong for any reason (i.e. malfunction in spark igniter/motor), a safety sensors will shut down everything from the main valve of LPG cylinder & activate warning alarm.
Also, it can send either SMS or notification via Bluetooth by using smart phone apps (Android/Apple) if you are far away or sleeping.
This electronic equipment may be run by less than 12-Volt rechargeable batteries & it’s worthless, if you compared it with tremendous loss of thermal energy of product that may be rare in soon-future, if we don’t apply energy efficiency programs in all utilities of country.
Fig (11) - Electronic Devices & Tools
There are many programs language that you may learn such as; C/C++, JavaScript, Python, Raspberry PI & definitely the easy one Arduino.
#LinkedIn_Sudan
#Energy_Chaos_in_Sudan
….. to be continued
*********
Part 5
Date: 24 Jan 2022
National Economic Vs. LPG Consumption
–
In previous parts, we concluded that there are some engineering methods, may lead to improve the efficiency of cooking Egyptian beans in Sudanese restaurants.
Let’s say that; we want use insulated & automatic system methods (neglect the effect of bad design of traditional cooker “Davouri” for now)
From technical table, we notice that heat loss due to vaporization process, was a significant (20.15 KWh), but using automatic cooker system has its great impact to solve the problem at all measures & prevent any vapor inside cooking pot.
Fig (12) - Technical Table for Cooking Egyptian Beans
Also, the heat loss by convection (Air Flow) has been reduced from 107 to 40 Watt in our CFD simulation case, as a result of using isolated materials efficiently and has a low temperature in the outer surface of insulated shield. Consequently, this low temperature may affect positively in reducing heat loss by radiation, as it’s temperature-dependent between the outer shield & surrounding air/zone.
These little improvements let us to re-fill LPG cylinder in 14 days rather than 4 days as usual.
**** ****
What’s that mean in point of economical view?
Let us assume that we have 10,000 business places using LPG cylinder for cooking Egyptian beans daily as we mentioned in economical table.
Recently, The average price of 12.5Kg LPG cylinder is 4.9 USD [@Jan 2022]
Then, by simple calculations we will realize that the country wants to import 11.4K metric ton of LPG yearly, which cost approximately 4.5 Million USD per year.
Fig (13) - Economical Table for Using LPG Cylinder in Cooking Egyptian Beans Only
But …, if we apply our thermal improvements on bad design of traditional cooking appliance “Davouri”, then we only need capacity of 3.3K metric-ton of LPG product & it will cost 1.3 Million USD per year.
So, the country will save up to 3.2 Million USD annually (if the population growth & investments is stable).
#LinkedIn_Sudan
#Energy_Chaos_in_Sudan
….. to be continued
Notes:
1) The values on technical table have been estimated by assuming that energy on LPG cylinder will be consumed all.
*********
Part 6
Date: 4 Feb 2022
We may deviate a little bit from our plans temporarily due to an urgent matter, that I realized last week which Is a real problem, not only for Sudan but for the whole world.
Definitely, you may noticed in kitchen that warming up water/milk or anything considered as liquid, took long time to reach warm temperature rather than solid (e.g. iron/copper) as the last type is heated very quickly.
One of the reasons of why liquid can’t heat-up quickly; has a relationship with “Thermal Diffusivity“.
The distance between molecules in liquid is too far compared to solid molecules which they are very close to each other.
To understand thermal diffusivity well, imagine that you are working in post-office & someone told you deliver a package to a location wants half-hour by riding a bicycle one way. That’s mean to get back; you will spent 1 hour for one package. You always know there is a lot of packages daily & you can’t do the job perfectly, so there will be “Delay“due to burden of work.
There is 2 solutions for our bored officer.
Either, changing his method of transportation (Using car instead of bicycle).
Or increase the number of employees which they are using the same method (bicycle)
That’s exactly how we may solve the low diffusivity of liquid.
A special design has been made for cooking pot which gives us improvements in thermal efficiency.
We tested our advanced pot by using CFD simulation software for 8 minute of heating 2.5 liter of water.
The result shows that, the average temperature in water for advanced pot was 90.2 °C instead of 78.9 °C for normal pot.
Fig (14) - Temperature Contours of CFD Simulation in Normal Pot
This is one of ideas that I have tested & may help us to save money & energy for citizens, country & the environment.
Fig (15) - The benefits of using Advanced Cooking Pot
#LinkedIn_Sudan
#Energy_Chaos_in_Sudan
….. to be continued
Notes:
1) One liter of ordinary tap water will boil after 6-8 minutes at a gas stove and from 9 to 12 minutes at electric stove. If the water is pure, it will be 6 minutes at a gas cooker and 8 minutes at an electric stove. [Source:beezzly.com]
2) The walls in CFD simulation test has been insulated for simplifying our case & that explains why it will heat-up higher (either for normal or advanced pot) than in real life due to interaction between water & pot with the surrounding air. Anyway, it will give the same result related to the environment conditions.
*********
Part 7
Date: 25 Mar 2022
#Invention_1 (Video): New Technology for Heating Objects
They said: “When you delve into the sea of a problem and you are prepared with the tools of science and knowledge, then be sure that you will find a solution that exceeds people’s expectations, even after a decades and they will respect you forever, for making their world more better.
There are new ideas that I found along this exciting journey of my article related to re-design; cooking stoves, ovens or even the cookware itself as they had the same design for centuries. Some of these ideas are difficult to invent by me under recent technical & financial circumstances.
Fig (16) - Some cooking & Heating Appliances
Invention 1 has been made & it took me 3 weeks starting from scratch until I launched this video. Although, it was a really bad design, but it was only a proof of concept.
So, next step is to use CFD simulation tools (engineering software) to optimize the design & improve energy efficiency & heat transfer of this new technology.
Engineering Simulation software is extremely powerful tool beyond expectation which makes you own virtual expensive laboratory test your design with saving time, effort & money for manufacturing.
If you watch my video of invention 1 in last part, you may remember that I said:
“the design is too bad which lead to decrease in the effectiveness of device as it takes long time to heat food. It was only proof of concept”.
So, we decided to use CFD simulation software (ANSYS-Fluent) to see where the flaws are in my preliminary design.
We assumed that we have a pizza piece with diameter & thickness of 5.5 & 0.5 cm respectively.
When we run the CFD simulation, we understand more things about what happen inside the device & test sample. It takes up to 16 min to warm-up pizza from 25 to 60 °C.
Fig (20) - CFD result of preliminary design
It gave us clear vision about how it can be solved after mind-blowing for days.
We have test some new designs by simulation software until we find our optimistic development design. This design can warm-up pizza in 6.7 min only for the same target temperature (even time can be less than that) but the issue now is rising about energy efficiency not about the time which was improved, but efficiency become low.
Fig (21) - CFD result of development design
Restaurants may prefer quick heating system rather than worried about energy bill, as they know their clients will pay for it, but the country will suffer economically from the waste of energy.
Anyway, its positive progress & we will keep our path steady until we reach the ultimate accomplishment.
–
#LinkedIn_Sudan
#Energy_Chaos_in_Sudan
….. to be continued
*********
Part 9
Date: 13 Apr 2022
In past weeks, I was searching in internet about the total energy efficiency of heating appliances in kitchen such as cooker, oven, microwave and so on.
I was shocked when I saw the results. It was very low efficiency as follows (avergae):
Gas convection oven: 9%
Electric convection oven : 17%
Microwave: 57%
I was asking myself; “Why modern ovens until now has low efficiency?
And why company don’t put label about efficiency of their oven product even by selecting standard item of food to be a base for evaluating the energy of efficiency globally?
Hidden the truth will not make you’re the product the best in market. The customer has the right to know wat they bought.
When I use CFD simulation software for heating small piece of pizza by using small conventional electric oven, I realize the main reason. [Microwave may be excluded from our investigation as it has different working principle & limit temperature not exceed 100 °C]
Firstly, the convection design is inefficient for oven which leads to circulate air away from the food, as we see in simulation photo [Fig 22]. That’s mean we are wasting time & energy. Even they are using the fan (add another electrical bill in our pocket), next reason was the vital reason.
Fig (22) - CFD Simulation for electrical oven for pizza
Secondly, it has related with the amount of heat which is absorbed by food itself, as the quantity will reduce with time & the electrical power of heating system Is still working as we see in curve graph.
Fig (23) - Curve Graph of time and energy rate
(In our simulation we assumed the walls are perfect insulated, so the loss will increase without it).
We discover the virus which causes the disease.
Now, the cure can be made easily in lab.
#LinkedIn_Sudan
#Energy_Chaos_in_Sudan
….. to be continued
*********
Part 10
Date: 3 May 2022
Chaos 2: Electrical Consumption of Evaporative “Desert” Cooler
Desert cooler appliances has been manufactured for decades & they use water as working fluid for cooling air by utilizing from humidification phenomenon by converting hot dry air to cold wet air by mixing vapor. Water has been evaporated due to pass of dry air on the surface of liquid water until the dry air reach saturation point.
Of course, this kind of device is highly efficient in cooling process & suitable for middle class; as it has low up-front cost without forgetting easy installation, configuration & maintenance services.
There is no comparison with expensive Air Conditioning (AC) Split System, but if you have a health issue with high humidity air, it may not be good choice for you.
Also, this type of device can only operate in dry climate zones, and can’t work in humid climate coast zones or coastline areas unless you emerge “De-humidifier” system with desert cooler, and then it will work fine.
What we want to talk about it today, is how recent design of desert cooler is more than worse by its traditional shape which is like the “Box” – as you see in fig (24).
Fig (24) - Box Design of Desert Cooler
It may affect negatively on the electrical consumption for first; our citizen & secondly in the state economic, as the electrical power of such appliances ranged between 400 to 1200 watt based on the components & size of cooler.
When we use engineering simulation software for testing desert cooler which have technical specification as shown in figure (25), and we found that pressure drop (loss) for inlets are:
P@upper Inlet = 295.4 Pa
P@middle Inlet = 308.1 Pa
P@lower Inlet = 294.9 Pa
Fig (25) - Simulation of Air inside Box Desert Cooler
So, we can assume that average pressure drop is 300 Pa & when we multiply it by flow rate of air; we will have the aerodynamic power as:
Aerodynamic Power = Pressure Drop X Flow Rate = 300*1.44 = 432 Watt
If we considered that efficiency of motor is 80%, so the electrical power will be:
Electrical Power = Aerodynamic Power / Efficiency = 432/0.8 = 540 Watt
This value only for delivering cold air by flow rate of 1.44 m3/s [3051 CFM]
The effect of pressure drop across the cooling pads is not too high ( may consider as negligible). It can’t exceed a value of 12 Pa, if we select high quality & suitable material product.
Fig (26) - Famous type of cooling pads in the world
Hence, re-designing the box shape of recent cooler may be the solution for decreasing the cost either in electrical bill or selecting the best motor according to the total pressure drop & flow rate.
–
#LinkedIn_Sudan
#Energy_Chaos_in_Sudan
….. to be continued
*********
Part 11
Date: 13 May 2022
If you have box type of desert cooler in your home or factory, then you may notice that there are many air slots – as I called – before reaching out the cooling pads as we see in figure (27).
Fig (27) - Air slots in desert cooler
I was asking myself, what the benefits from these slots arrangement regardless of how this design is worse from aerodynamic point of view?
– Does it have relationship with increasing cooling efficiency?
I doubt of that; as the relative velocity between air & water is a primary factor for that purpose, but here the angle of slot is always letting the air move in direction approximately aligned with water motion in cooling pads due to gravity effect. Angle should be reversed if it’s our main objective.
In CELdek 7090-15 cooling pad (cellulose material) that manufactured by “Munters”, has a unique design of pads by making steep angle of 30° & 60° for 2 flutes (inner tube) for both air & water respectively as we see in figure (28).
Fig (28) - CELdek 7090/15 Cooling Pads
As they claimed; it prevents algae and minerals from anchoring themselves into substrate of the pad, so they fall off when dried. It offers protection to the pads from the damaging effects of severe weather and long-term exposure to UV light. It’s the life of the pad over that of non-treated pads.
Anyway, making steep angle flute inside the pads is more than better rather than outside the box which can be like road block for airflow.
So, I decided to find pressure loss for air slots – which is used usually for Aspen material as cooling Pads – by using simulation software.
We found that pressure loss was approximately 7.3 Pa, which lead to un-necessary electrical power equal to 13 watt.
Does it worth it to waste energy for Aspen cooling pads?!
Fig (29) - Simulation of Air slots Effect on Desert Cooler
For a solution, why we don’t use a solar hanged- roof instead of air-slots, at least we can utilize from unused area to generate electricity in summer season.
–
#LinkedIn_Sudan
#Energy_Chaos_in_Sudan
….. to be continued
*********
Part 12
Date: 15 May 2022
Idea_Beyond_Imagination: Converting humid into dry climate for coast-cities.
*** ***
Regardless of the advantages of using desert cooler in home or workplace, there is a one limitation that torn it apart; it needs a dry climate zone to work perfectly & produce cool air.
Coast-cities are suffering from humid climate as it nearby the seawater. So, people using AC-Split system in summer season which can cost person a high electricity bill.
Fig (30) - Desert Cooler and AC Split System
Using de-humidifier system & merge it with desert cooler may be a smart & innovative idea, but it’s not effective & practical for personal purposes for cooling your own home.
Few days ago, I was thinking about this problem & I told myself:
“Why we don’t change the climate in coast-cities?”
I started studying & analyzing our critical situation regarding to the humidification process & we found the best solution is to build what I called “Climatic Equilibrium Wall” as we see in figure (31).
Fig (31) - The Climatic Equilibrium Wall for Coast-cities
Let me explain in engineering language how it’s work.
If you familiar with HVAC systems or ASHRAE institution, you definitely know there is a famous chart called “Psychrometric Chart” which is used to determine relative humidity, density, dry & wet temperature for air under the atmospheric pressure as we see in figure (32).
Fig (32) - The Psychrometric Chart
Every point in figure (31) has a number which represent a weather status of air in order as follows;
Point [1]: As the beginning, we may assumed that air in middle of seawater (or land near the tower) will have a temperature of 40 °C with relative humidity (RH) equal to 20%. This will make the density of air in that point equal to ρ= 1.122 Kg/m3 (Wet Air).
Point [2]: In day-light, the wind will move from sea-water to the land due to fact that land heats-up quickly rather than water; hence there will be a density difference between air above land & seawater.
So, air will be humidified & cooled along this lovely journey (which explains why people go to beach in summer). The temperature will be 22 °C (if it was adiabatic process) with assumption that RH=100%. The density of wet air will be ρ= 1.185 Kg/m3.
Point [3]: Now, we may assumed that cool air has been warmed-up by surrounding environment over time & definitely the temperature should be raised up to 40 °C . We will also assume that RH=100%, as the worst scenario that could happen. So, the density will be (ρ= 1.097 Kg/m3) & that’s lead to raise-up the hot wet air (buoyancy effect by gravity).
What’s happen next?
Look again in figure (31).
In the side of dry zone, we have density of air equal to 1.122 Kg/m3.
In the side of humid zone, we have density of air equal to 1.097 Kg/m3.
In normal situation, the gravity will act positively (buoyancy effect), but with specific height of climatic equilibrium wall, the gravity effect will be neutralized & nothing happen.
There is no comparison when using electrical power of 500 watt for desert cooler (water) to do the same job of 2000 watt of AC-Split system (Freon-12) in your home/factory.
There are many high density coast-cities in the world such as; Sydney, Tokyo, Singapore, Mumbai, Dubai, Rome, New York & other.
It may be considered as a game-changer for energy-economic of nations.
#LinkedIn_Sudan
#Energy_Chaos_in_Sudan
….. to be continued
Notes:
1) The data of points in figure (31) has been extracted from standard psychrometric chart except for point [3] & density of wet air which have been found by using laws of thermodynamic science.
2) Remember, point [3] is the worst scenario in our study & it may not happen at all due to several factors such as heat transfer, condensation & other. So the height of climatic equilibrium wall will be shorter than we thought.
3) In night, the humid zone will be exposed to low temperature, which leads to condense vapor from wet air. It’s a business project to produce purified water from air (Aero-desalination).
4) “HVAC” Is abbreviation for Heat, Ventilation & Air-Conditioning.
5) “ASHRAE” is also abbreviation for American Society of Heating, Refrigerating and Air-Conditioning Engineers, Inc
NACA: National Advisory Committee for Aeronautics (By NASA).
ARMD: Aeronautics Research Mission Directorate (By NASA.)
CFD: Computational Fluid Dynamic.
GAMBIT: Geometry And Mesh Building Intelligent Tool (By ANSYS Inc.)
FLUENT: It’s just a phrase suggested by Brilliant English Scientist physicist Sir: Isaac Newton in one of his technical treatises on flow when relating the word to flowing fluids he suggested it’s use for smooth flows & it’s now the name of CFD software by ANSYS Inc.
1) Introduction
Professionals in aviation industry still believe (& agree in quorum), that there is no way for any new concept for designing a wing which is differ from traditional one, due to the simple idea of Bernoulli’s phenomenon which stated that the air speed on upper part should be higher than lower part to generate lift (Pressure Difference) on plane. And if it’s happen & find another concept, it will be a scientific breakthrough & will open a new chapter in aviation generation book.
Figure (1) – Why planes can fly? Bernoulli’s concept is one of the answers.
Speaking of which, there are 2 concept (until now) which are mainly depend on lifting/flying objects (e.g. birds & planes) & they are:
Bernoulli’s Concept of Fluid Motion.
Boundary Layer Concept.
Two months ago, I found a new revolutionary concept while I was testing new designs of wing/airfoil by using Pre-processing program named “GAMBIT” & CFD simulation program named as “FLUENT” which both belongs to ANSYS Inc. & I have positive results after hard learning by myself to understand how we can simulate a wing like NACA 2412 perfectly & evaluate the lift & drag coefficient with considering the important factors such as y-plus (Y+) which is related to the turbulence flow.
Figure (2) – Pressure Contour of NACA 4412 Airfoil
This numerical breakthrough of 3rd concept will lead to increase the efficiency of flight by decreasing a huge amount of total mass of planes which consequently make a fuel consumption more economical up to 65%. Also, the prominent feature of miracle airfoil that It doesn’t affect by flow regions (e.g. incompressible, subsonic , … etc)
(3) – Douglas DC-8 producing contrails at a bio-fuel test
In our extraordinary analysis article, we will discuss how planes & birds fly & mention briefly the history of wings with it’s applications & know some of recent developments of wing. Then we will show the numerical results of our CFD simulation for different cases & types of wing without disclosing the secret design.
2) Physical Reasons of Flight
We said previously, that there are 2 concepts which depend on flying objects, which are:
Bernoulli’s Concept of Fluid Motion.
Boundary Layer Concept.
Bernoulli’s effect is obvious to people who studied physical science or mechanical engineering. For simplicity, it’s stated that if the speed of air/water is decreased by increasing the duct/pipe, so the pressure will increase consequently by somehow, & the vice versa is true. Figure (4) shows what I’m talking clearly.
Figure (4) – Bernoulli’s Law
Definitely, we are talking if the density of air is constant & if not, the ideal gas law will involved which mean that the temperature should be involved in our equations to take it’s effect on Bernoulli’s concept.
In general speaking, Bernoulli’s concept has a relation with energy conservation by somehow.
Anyway, let us talking about the 2nd strange concept called “The Boundary layer”
Many graduates engineers (like me !) think that Bernoulli’s concept was the only factor which is making planes & helicopter to fly above the ground.
I was always asking myself;
1) Does it really changing the speed of air between upper & lower part of wing may lead to generate a lift force by creating difference of pressure ?
2) What’s really happen between air particles & surface of wing in the micro-scale ?
Bernoulli’s concept doesn’t give you a full vision of what happen between the molecules.
After I read very informative, understandable, interesting, & exciting book named by “ Fundamentals of Aerodynamics, 5th Edition “ by Dr. John D. Anderson, Jr., my previous knowledge has been changed totally.
When an object (e.g. plane) move inside a large volume of fluid (gas/liquid), there will be 2 distinct layer which surrounded the object. The thick layer will have a same speed in all points along the perpendicular line of the surface of object. So, this region has been characterized by frictionless feature & named as “Inviscid Region”.
The another region is named as “Viscous Region” which is adjacent to the surface of object & it has a very thin layer. The velocity of fluid on this region changed along the perpendicular line of surface from Zero (on surface) to maximum value which is equal to the velocity on the in-viscid region. So, the 2nd region has velocity gradient due to molecules friction. Figure (6) shows those types of region.
Figure (6) – Viscous and inviscid Region
The common property with these regions that it have the same pressure points along the perpendicular line of object’s surface.
Maybe you will surprise, if you know that the thin layer of viscous region are responsible of lift for planes.
Let us read what Dr. Anderson say in his informative book:
Without Friction, Could We Have Lift?
In Section 1.5 we emphasized that the resultant aerodynamic force on a body immersed in a flow is due to the net integrated effect of the pressure and shear stress distributions over the body surface. Moreover, in Section 4.1 we noted that lift on an airfoil is primarily due to the surface pressure distribution, and that shear stress has virtually no effect on lift. It is easy to see why. Look at the airfoil shapes in Figures 4.17 and 4.18, for example. Recall that pressure acts normal to the surface, and for these airfoils the direction of this normal pressure is essentially in the vertical direction, that is, the lift direction. In contrast the shear stress acts tangential to the surface, and for these airfoils the direction of this tangential shear stress is mainly in the horizontal direction, that is, the drag direction.
Hence, pressure is the dominant player in the generation of lift, and shear stress has a negligible effect on lift. It is for this reason that the lift on an airfoil below the stall can be accurately predicted by inviscid theories such as that discussed in this chapter. However, if we lived in a perfectly inviscid world, an airfoil could not produce lift. Indeed, the presence of friction is the very reason why we have lift.
These sound like strange, even contradictory statements to our discussion in the preceding paragraph. What is going on here? The answer is that in real life, the way that nature insures that the flow will leave smoothly at the trailing edge, that is, the mechanism that nature uses to choose the flow shown in Figure 4.18c, is that the viscous boundary layer remains attached to the surface all the way to the trailing edge. Nature enforces the Kutta condition by means of friction. If there were no boundary layer (i.e., no friction), there would be no physical mechanism in the real world to achieve the Kutta condition.
So we are led to the most ironic situation that lift, which is created by the surface pressure distribution—an inviscid phenomenon, would not exist in a frictionless (inviscid) world. In this regard, we can say that without friction we could not have lift. However, we say this in the informed manner as discussed above. [Ref-1]
Although I don’t yet convinced, but I should read more about it extensively when I have time.
Anyway, you can find more detail in that exciting book that I have mentioned earlier.
I promise that you will enjoy it.
3) History of Airfoil:
Anybody interested in aviation industry, definitely knows who are the “Wright’s Brothers”.
They are an American Inventors who built the 1st operated airplane with successful sustained flight in 17 Dec 1903.
Figure (7) – Wright’s Plane
Figure (8) – Wright’s Plane
That’s accomplishments don’t come without cost.
Failure experiments, deep knowledge, hard working & beautiful patient were the key factors of succession.
Figure (9) – Stages of Development for Wright’s Plane
Since their 1901, glider was of poor aerodynamic design, the Wrights set about determining what constitutes good aerodynamic design.
In the fall of 1901, they design and build a [ 6ft long x 16inch square ] wind tunnel powered by a two-bladed fan connected to a gasoline engine. A replica of the Wrights’ tunnel is shown in Figure (10).
In their wind tunnel they test over200 different wingand airfoil shapes, including flat plates curved plates, rounded leading edges, rectangular and curved plan forms, and various monoplane and multi-plane configurations. A sample of their test models is shown in Figure (11). The aerodynamic data are taken logically and carefully.
Figure (10) – Replica of the wind tunnel designed – Wrights Brother
Figure (11) – Wing models tested by the Wright brothers in their wind tunnel during 1901–1902
Armed with their new aerodynamic information, the Wrights design a new glider in the spring of 1902. The airfoil is much more efficient; the camber is reduced considerably, and the location of the maximum rise of the airfoil is moved closer to the front of the wing.
The most obvious change, however, is that the ratio of the length of the wing (wingspan) to the distance from the front to the rear of the airfoil (chord length) is increased from 3 to 6.
Figure (12) – Wing Area of Different Planes
The success of this glider during the summer and fall of 1902 is astounding; Orville and Wilbur accumulate over a thousand flights during this period. In contrast to the previous year, the Wrights return to Dayton flushed with success and devote all their subsequent efforts to powered flight.
The rest is history. [Ref-1]
So, the starting point of aviation industry was in 1903 & we still understand aerodynamics very well every day especially by using computer software by using CFD approach to analyze the flow of air over wing.
Definitely, there were many attempts by different means & ways to fly & below are figures which shows one of them:
Figure (13) – Leonardo da Vinci’s Ornithopter design
Figure (14) – Governable parachute” design of 1852
Figure (15) – Jean-Marie Le Bris and his flying machine, Albatros II, 1868
Figure (16) – The Aeroplane of Victor Tatin, 1879.
Figure (17) – Otto Lilienthal, May 29, 1895.
Figure (18) – Santos-Dumont’s “Number 6” rounding the Eiffel Tower in the process of winning the Deutsch de la Meurthe Prize, October 1901
[You may download a PDF file of Aviation History fromHERE]
Figure (19-A) – Poster of Book talking about Abbas Ibn Firnas
Abbas Ibn Firnas was very creative engineer and inventor who successfully constructed the first flying machine. His flying machine was controlled one and he also demonstrated it’s flight, many centuries before designs of Leonardo Da Vinci. He is also famous for developing a glass lens that could be used to correct some vision problems. He had done many inventions and is so famous that a crater on the moon has been named after his name. [web-1]
Figure (19- B) – Abbas Ibn Firnas
With his flying machine he jumped off a cliff and stayed a loft for 10 minutes. Unfortunately he couldn’t land as smoothly and injured his back during his crash. This mistake made him realize how important the tail of a bird is for landing. To honor his accomplishments, Baghdad’s northern airport is named after him as well as a bridge in Cordoba (Spain) and a moon crater.[web-2]
Figure (19- C)- -Statue of Ibn Firnas outside Baghdad International Airport
Figure (19- D) Bridge in Cordoba (Spain)
Anyway, after 1903, we have the ability to fly, but in that decades, the design of wing/airfoil was depend by luck. It was based on guessing & imagination . It wasn’t organized in a uniform system.
Early airfoils were designed by trial and error. Royal Aircraft Establishment (RAE), UK and Gottingen laboratory of the German establishment which is now called DLR(Deutsches Zentrum fϋr Luft-und Raumfahrt – German Centre for Aviation and Space Flight) were the pioneers in airfoil design. Clark Y airfoil shown in Fig.(1) is an example of a 12% thick airfoil with almost flat bottom surface which has been used on propeller blades. [Ref-2]
Figure (20)- View of RAE Location
Figure (21) – Douglas Dakota III, ZA947, Royal Aircraft Establishment (RAE)
So, in 1930, the National Advisory Committee of Aeronautics (NACA) developed an organized system for airfoil design.
NACA was a U.S. Federal Agency founded on March 3, 1915, to undertake, promote and institutionalize aeronautical research. That’s was born date of airfoil series 4-digit in first place.
Figure (22) –Logo of NACA
“ The early NACA airfoil series,the 4-digit, 5-digit, and modified 4-/5-digit, were generated using analytical equations that describe the camber (curvature) of the mean-line (geometric centerline) of the airfoil section as well as the section’s thickness distribution along the length of the airfoil. Later families, including the6-Series, are more complicated shapes derived using theoretical rather than geometrical methods.
Before the National Advisory Committee for Aeronautics (NACA) developed these series, airfoil design was rather arbitrary with nothing to guide the designer except past experience with known shapes and experimentation with modifications to those shapes. This methodology began to change in the early 1930s with the publishing of a NACA report entitled The Characteristics of 78 Related Airfoil Sections from Tests in the Variable Density Wind Tunnel. See figure (23). [Ref-3]
Figure (23) – The Variable Density Wind Tunnel (VDT)
The VDT was operational in October 1922 at the NACA Langley Memorial Laboratory at Hampton, Virginia. It is essentially a large, subsonic wind tunnel entirely contained within an 85-ton pressure shell, capable of 20 atm. This tunnel was instrumental in the development of the various families of NACA airfoil shapes in the 1920s and 1930s. In the early 1940s, it was decommissioned as a wind tunnel and used as a high-pressure air storage tank. In 1983, due to its age and outdated riveted construction, its use was discontinued altogether. Today, the VDT remains at the NASA Langley Research Center; it has been officially designated as a National Historic Landmark. (Courtesy of NASA.) [Ref-1]
In this landmark report, the authors noted that there were many similarities between the airfoils that were most successful, and the two primary variables that affect those shapes are the slope of the airfoil mean camber line and the thickness distribution above and below this line.
Figure (24) – Wing Geometry Definitions
They then presented a series of equations incorporating these two variables that could be used to generate an entire family of related airfoil shapes. As airfoil design became more sophisticated, this basic approach was modified to include additional variables, but these two basic geometrical values remained at the heart of all NACA airfoil series. [Ref-3]
Any airfoil in NACA series has a specific terms (e.g. length & thickness) to construct the airfoil according to the corresponding number (digit). As we see in figure (25),the geometry of airfoil is consist of such terms:
The Chord.
Maximum thickness.
Maximum thickness position.
Maximum Camber line.
Maximum camber position.
Figure (25) – Airfoil Nomenclature
Let us know what’s the mean of NACA 4-Digit for airfoil an example (e.g. NACA 2415).
The first family of airfoils designed using this approach became known as the NACA Four-Digit Series.
The first digit specifies the maximum camber (m) in percentage of the chord (airfoil length), the second indicates the position of the maximum camber (p) in tenths of chord, and the last two numbers provide the maximum thickness (t) of the airfoil in percentage of chord.
For example, the NACA 2415 airfoil has a maximum thickness of 15% with a camber of 2% located 40% back from the airfoil leading edge (or 0.4c).
Utilizing these m, p, and t values, we can compute the coordinates for an entire airfoil using the following relationships. [Ref-3]:
Figure (26)
where
x = coordinates along the length of the airfoil, from 0 to c (which stands for chord, or length)
y = coordinates above and below the line extending along the length of the airfoil, these are
either yt for thickness coordinates or yc for camber coordinates
t = maximum airfoil thickness in tenths of chord (i.e. a 15% thick airfoil would be 0.15)
m = maximum camber in tenths of the chord
p =position of the maximum camber along the chord in tenths of chord
Figure (27) shows a different shapes of NACA 4-digit series.
Figure (27) – Many Shapes of NACA 4-Digit Series
There are many digit series of NACA which they are:
NACA 4-Series.
NACA 5-Series.
Modified NACA Four- and Five-Digit Series.
NACA 1-Series or 16-Series.
NACA 6-Series.
NACA 7-Series.
NACA 8-Series.
Figure (28) shows the difference of them with other model of airfoil.
Figure (28) – Different model of airfoil
Now let us see what’s the pros & cons of each series which is represented in figure (29).
Figure (29) – Pros & Cons of NACA Series
Today, airfoil design has in many ways returned to an earlier time before the NACA families were created. The computational resources available now allow the designer to quickly design and optimize an airfoil specifically tailored to a particular application rather than making a selection from an existing family. [Ref-3]
That’s true, using powerful computers with simulation software (e.g. Fluent-ANSYS ) may help us to predict the flow of air over any complicated shape of wing approximately more accurate than real experiment which is waste our time & money but definitely we can’t ignore the real experiment in our life because it’s the actual place to invest our money.
Figure (30) – taken from NUMECA website
NASA airfoils
NASA has developed airfoil shapes for special applications.
For example GA(W) series airfoils were designed for general aviation aircraft.
The “LS” series of airfoils among these are for low speed (LS) airplanes. A typical airfoil of this category is designated as LS(1) – 0417. In this designation, the digit ‘1’ refers to first series, the digits ‘04’ indicate C lopt of 0.4 and the digits ‘17’ indicate the thickness ratio of 17%. Figure (31-e) shows the shape of this airfoil.
For the airfoils in this series, specifically designed for medium speed airplanes, the letters ‘LS’ are replaced by ‘MS’(see Fig.31.f).
NASA NLF series airfoils are ‘Natural Laminar Flow’ airfoils.
NASA SC series airfoils are called ‘Supercritical airfoils’. These airfoils have a higher critical Mach number. Figure (31-g) shows an airfoil of this category.
Figure (31) – Typical Airfoil
Airfoil selection
Large airplane companies like Boeing and Airbus may design their own airfoils.
Figure (32) – Specifications of Airbus & Boeing Plane
However, during the preliminary design stage, the usual practical is to choose the airfoil from the large number of airfoils whose geometric and aerodynamic characteristics are available in the aeronautical literature.
To enable such a selection it is helpful to know the aerodynamic and geometrical characteristics of airfoils and their nomenclature. [Ref-2]
Figure (33) – Boeing 737 Airfoil Sections
Figure (34) – Boeing 737 Airfoil Sections
That’s the reason why there are an extreme competition between manufacturing companies of planes to find reliable, strong & light design of wing which is reflected positively in the economical side for airlines companies to attract more clients by offering the best solutions for their commercial or military purposes especially by making the fuel consumption more cost effective.
Figure (35) – Manufactures are competed hardly to win the race of aviation industry
4) Airfoil Performance:
The important factors in flight are Drag, Lift Coefficient, angle of attack (AoA) & Lift-Drag Ratio.
Lift(L) is defined as the component of the aerodynamic force that is perpendicular to the flow direction
Drag(D) is the component that is parallel to the flow direction
So, the coefficient of drag & lift can be calculated as we see in figure (36) & (37) respectively.
Figure (36) – Drag Equation of Plane
Figure (37) – Lift Equation of Plane
Angle of attack (α) : It’s angle between relative wind and chord line of airfoil as we see in figure (38).
Figure (38) – How Measuring the Angle of Attack on Plane
Stall Angle: A stall occurs when the angle of an airfoil exceeds the value which creates maximum lift as a consequent of airflow cross it. See figure (39) for more understanding.
In fluid dynamics, a stall is a reduction in the lift coefficient generated by foil as angle of attack increase. This occurs when the critical angle of attack of the foil is exceeded.
Figure (39) – Effect of Stall on Airfoil
Lift-Drag Ratio: is the ratio between the lift to drag coefficient @ specific angle of attack (AoA).
Figure (40) shows the curve graph of both drag & lift coefficient in polar style with corresponding angle of attack (AoA).
Figure (40) – Polar curve and L/D to AoA curve
An aircraft designer does not only have to make sure that enough lift is produced by the wings but also at a reasonable amount of thrust, i.e. without simultaneously producing too much drag. We can see that CD has its minimum value at small angles of attack.
As the stall angle is approached, the drag increases at a progressively higher rate due to separated flow.CD has its minimum value at small angles of attack. With an increase in the AoA, drag increases at a progressively higher rate.
In order to evaluate the wing efficiency we must consider more than just the lift produced. In fact, a wing has its greatest lifting ability just prior to the stalling angle of attack. Unfortunately, near the stalling angle, the wing also generates considerable drag.
A wing has its greatest lifting ability (CLmax) at the stall AoA but also very high induced drag. The minimum drag occurs at a fairly low angle of attack, in this case slightly above zero degrees AoA. Unfortunately, the lifting ability is very low at low angles of attack.
At each angle of attack, the lift/drag ratio is the ratio between lift and drag or between the coefficient of lift and the coefficient of drag. It expresses the aircraft efficiency. [Ref-4]
Figure (41) – Highest L/D ratio in Polar Curve
When I was able to simulate NACA 2412 successfully, I was wondering always from where did people find this old fashioned & nasty graph of real experiment of NACA airfoil which shown in figure (42) as example ?
Figure (42) – Data of Lift & Drag coefficient for NACA 4412
Tried hardly day after day & suddenly, when I was downloaded PDF files from internet, I find the answer.
It was from “Abbott Report” or it officially named as “NACA Report 824” which is issued in 1945.
It has everything that I want for NACA 4digit series experimental results.
Figure (43) – Cover of NACA Report 824 “Abbott Report”
I was in relief to compare my simulation with real one to see how close I’m from the accuracy for NACA 2412/4412.
You may download it from [HERE] especially if you’re interested with CFD Simulation of airfoil.
The camber of airfoil also has it’s effect on lift & drag coefficient. Figure (44) & (45) shows that difference.
Figure (44) – Effect of airfoil camber on lift coefficient
Figure (45) – Effect of airfoil camber on drag coefficient
Many engineers are interested in designing high lift systems for planes.
So, Why High Lift is Important ?
Figure (46) – Mechanism of High Lift Systems Control
Wings sized for efficient cruise are too small to take-off and land in “reasonable” distances.
From Boeing: ”
– “A 0.10 increase in lift coefficient at constant angle of attack is equivalent to reducing the approach attitude by one degree. For a given aft body-to-ground clearance angle, the landing gear may be shortened for a savings of airplane empty weight of 1400 lb.
– “A 1.5% increase in maximum lift coefficient is equivalent to a 6600 lb increase in payload at a fixed approach speed”
– “A 1% increase in take-off L/D is equivalent to a 2800 lb increase in payload or a 150 nm increase in range.”
For fighters: – Devices move continuously for minimum drag during
maneuvering.
Powered Lift concepts hold out the hope for STOL operation. [Ref-5]
STOL: Short Takeoff & Landing
There are many designs for high lift configurations as we see in figure (47).
Figure (47) – Miscellaneous Design of High Lift Systems
Boeing has been developed the high lift system since 1947. Figure (48) shows the phases of change for wing design.
Figure (48) – Trends in Boeing Transport High Lift System Development
Figure (49) – Boeing 747-100
Imagine how the shape of slat & flap may effect in the value of maximum lift coefficient as we see in figure (50).
Figure (50) – Effect of adding slat & flap in airfoil
Figure (51) – Airbus 380 Trailing Edge Flap System
Figure (52) shows a curve graph of highest lift of airplanes manufacturers. RJ70 plane has high value among other planes which the lift coefficient is approximately equal to 3.5
Figure (52) – Coefficient Maximum Lift Data of Airplane Manufacturers
I think there is nothing to write here.
Definitely there are more detail about performance like momentum , center of pressure & other stuff, but … we don’t think it’s important for our case.
5) Applications of Airfoil:
Far as I know, there are few applications that depends on airfoil & they are:
Wings for planes.
Propellers.
Rotor Blades. (e.g Helicopter)
Turbine blades.
Figure (53) – Application of Airfoil
So, the industries which is depend on the airfoil are:
Aviation Industry.
Renewable Energy Industry (Wind Type).
Power Generation Industry.
Figure (54) – Industries depend on Airfoil
There is also another industry could be added to that list which is a “Maritime’ but it’s limited to used it.
Airfoil in that scope of industry is named as “Hydrofoil” which it has the same function of airfoil, but we will used in water instead of air. Hydrofoil will be attached to ships & submarines similar to the plane’s wing.
Figure (55) – Layout of Ship with front hydrofoil
Figure (56) – Ship with Hydrofoil
So, why I said it’s limited to used in the maritime industry.
We know that increasing the speed of boat or ship will lead to move the boat upward due to the relationship between viscosity, external force & velocity gradient.
Figure (57) – Viscosity effect on Speed of Boat
Now, if we use hydrofoil inside water, the upper part of it will have higher velocity rather than the lower part as we knew from Bernoulli’s effect. Obviously, the pressure in that upper part will reduce to some value which lead to convert the water into vapors as we see in figure (58) . This phenomenon called “Cavitation”.
Figure (58) – Cavitation occur in upper part of hydrofoil
Cavitations is defined as the phenomenon of forming and imploding vapor bubbles in a region where the pressure of the liquid falls below its vapor pressure. Cavitation and the resultant damage can occur in any fluid-handling equipment, especially in pumps. See figure (59)
Technological advances in industrial protective coatings and composite repair materials have made it possible to repair pumps operating in a cavitating environment rather than simply replacing them after damage occurs. [Web-3]
Figure (59) – Negative Effects of Cavitation on Tools & Equipments
When you see the speed list for different types of ships like in figure (60), you will wonder about how very low speed of ship in upper part of hydrofoil may cause cavitation phenomenon.
Figure (60) – List of speed for different types of ships
The answer is found in the density. For air & water, it’s 1.2 Kg/m3 & 1000 Kg/m3 respectively.
Anyway, there is a draft paper of mine suggested 10 ideas to solve the cavitation issue. Some of them wanted to run CFD simulation software for analyzing & evaluating the new design of hydrofoil.
I don’t have time yet for them. So, maybe in the future will be published.
6) Future Technologies of Airfoil:
The accumulation knowledge over years is the key for making an excellent design for anything.
Understanding the philosophy of nature & how it’s act on specific conditions for unique design, will let us to improve it next time.
Why learn about aerodynamics?
For an answer, just take a look at the following five photographs showing a progression of airplanes over the past 70 years.
The Douglas DC-3 (Figure 61-A), one of the most famous aircraft of all time, is a low-speed subsonic transport designed during the 1930s. Without a knowledge of low-speed aerodynamics, this aircraft would have never existed.
The Boeing 707 (Figure 61-B) opened high-speed subsonic flight to millions of passengers beginning in the late 1950s. Without a knowledge of high-speed subsonic aerodynamics, most of us would still be relegated to ground transportation.
The Bell X-1 (Figure 61-C) became the first piloted airplane to fly faster than sound, a feat accomplished with Captain Chuck Yeager at the controls on October 14, 1947. Without a knowledge of transonic aerodynamics (near, at, and just above the speed of sound), neither the X-1, nor any other airplane, would have ever broken the sound barrier.
Figure (61)
The Lockheed F-104 (Figure 62-A) was the first supersonic airplane point-designed to fly at twice the speed of sound, accomplished in the 1950s.
The Lockheed-Martin F-22 (Figure 62-B) is a modern fighter aircraft designed for sustained supersonic flight. Without a knowledge of supersonic aerodynamics, these supersonic airplanes would not exist.
Figure (62)
Finally, an example of an innovative new vehicle concept for high-speed subsonic flight is the blended wing body shown in Figure (63). At the time of writing, the blended-wing-body promises to carry from 400 to 800 passengers over long distances with almost 30 percent less fuel per seat-mile than a conventional jet transport.
Figure (63)
This would be a “renaissance” in long-haul transport. The salient design aspects of this exciting new concept are discussed in Section 11.10. The airplanes in Figures (61–63) are six good reasons to learn about aerodynamics. [Ref-1]
Recently, there are a lot of developments in aviation industry has been applied & some of them still test phase in different scope such as airframe, engines & alternative fuels.
We will briefly talk about some of these developments here in my article & you may read the rest of it from PDF file named as “IATA Technology Roadmap : Technology Annex” which is Prepared in collaboration with the Aerospace Systems Design Laboratory (ASDL), Georgia Institute of Technology.
So, let us see some of the next generations of aviation industry maybe found in the future.
1) The Morphing Airframe:
In the longer-term future, it is conceivable that an aircraft would reconfigure its aerodynamic surfaces “on the fly” to achieve maximum performance during each element of the flight profile.
Key enablers for this significant gain in adaptation capabilities, in conjunction with flight controls and mission objectives that exploit the ability to drastically morph, are:
Materials capable of supporting flight loads and undergoing high strain without creep.
Compact actuators consuming exceptionally low power, yet are able to generate substantial forces and displacements. The use of piezoceramic actuators as well as adaptronics technology is under consideration.
The aerospace industry is currently investigating the practicality of morphing structures that combine smart materials and compact actuators. For instance, the USAF/NASA/Boeing Active Aeroelastic Wing (AAW) programme’s objective is to control the twist of a flexible wing in to induce roll movements, thereby obviating conventional roll-control surfaces that are mechanically complex [40].
The Morphing Aircraft Structures (MAS) programme of the US Defense Advanced Research Projects Agency (DARPA) involves the development of multiple vehicular platforms by Lockheed, Raytheon Missile Systems, and NextGen Aeronautics. The program’s primary emphasis is on realizing the technological feasibility of large-scale, in-flight morphing. Lockheed’s Z-wing concept has a seamless folding structure to provide conformal coverage over the wing-fold area at each fold. The seamless skins are made out of elastomers produced through the vacuum assist resin transfer mold (VARTM) process. The wing folds itself through hierarchically mechanized servo-drive systems, locked by fold brake systems once folding is achieved.
Figure (64) – The Morphing Shape of NASA
Figure (65) – The Material Structure of Morphing Airframe
Figure (66) – N-MAS wind tunnel model -left- morphing structure layout (center), and elastomeric skin with ribbons (right)
MIT and NASA Engineers Demonstrate A New Kind of Airplane Wing
Assembled from tiny identical pieces, the wing could enable lighter, more energy-efficient aircraft designs
A team of engineers has built and tested a radically new kind of airplane wing, assembled from hundreds of tiny identical pieces. The wing can change shape to control the plane’s flight, and could provide a significant boost in aircraft production, flight, and maintenance efficiency, the researchers say.
Figure (67) – The Morphing Plane on Subsonic Tunnel
The new approach to wing construction could afford greater flexibility in the design and manufacturing of future aircraft. The new wing design was tested in a NASA wind tunnel and is described today in a paper in the journal Smart Materials and Structures, co-authored by research engineer Nicholas Cramer at NASA Ames in California; MIT alumnus Kenneth Cheung SM ’07 PhD ’12, now at NASA Ames; Benjamin Jenett, a graduate student in MIT’s Center for Bits and Atoms; and eight others.
Instead of requiring separate movable surfaces such as ailerons to control the roll and pitch of the plane, as conventional wings do, the new assembly system makes it possible to deform the whole wing, or parts of it, by incorporating a mix of stiff and flexible components in its structure. The tiny subassemblies, which are bolted together to form an open, lightweight lattice framework, are then covered with a thin layer of similar polymer material as the framework.
The result is a wing that is much lighter, and thus much more energy efficient, than those with conventional designs, whether made from metal or composites, the researchers say. Because the structure, comprising thousands of tiny triangles of matchstick-like struts, is composed mostly of empty space, it forms a mechanical “metamaterial” that combines the structural stiffness of a rubber-like polymer and the extreme lightness and low density of an aerogel.
Figure (68) – Morphing Plane Manufactured by Tiny pieces of lighter Material
Jenett explains that for each of the phases of a flight — takeoff and landing, cruising, maneuvering and so on — each has its own, different set of optimal wing parameters, so a conventional wing is necessarily a compromise that is not optimized for any of these, and therefore sacrifices efficiency. A wing that is constantly deformable could provide a much better approximation of the best configuration for each stage. [Web-4]
Figure (69) – The Future of Morphing Airframe
2) Hybrid-Wing-Body :
The hybrid or blended wing body (BWB) concept originated at McDonnell Douglas in the late 1990s in response to the question posed by NASA’s Dennis Bushnell, “renaissance for the long-haul transport?” [119] Initial iterations of McDonnell Douglas’ and the Boeing Company’s BWB designs indicated a 25% reduction in per-seat fuel burn over an 800 passenger-conventional, tube-and-wing configuration [120, 121].
Figure (70) – The Hypothetical Design of Blended Wing Plane
Subsequent studies have focused on aircraft concepts ranging from 200 to 600 passengers. The most recently studied concept, which is funded under NASA’s N+2 Subsonic Fixed Wing program, is a 300-passenger replacement for the Boeing 777. NASA design efforts indicate that the BWB configuration alone produces a 10% fuel burn saving comparable to a B777-200ER with GE90 engines on a 7,000 nautical mile mission carrying a full passenger load. The aerodynamic benefits are larger for very big BWB aircraft. However, an 800+ seat BWB has a wingspan of 90 to 100 meters. This is incompatible with today’s airport compatibility rules, which limit aircraft size to 80 meters length by 80 meters span. The BWB shape that is totally different from today’s aircraft also generates a number of other airport operations issues that need to be solved. Another main unsolved issue is pressurization of a big lens-shaped cabin.
A significant amount of research has been performed in this area by Boeing. The Silent Aircraft Initiative is a venture between the University of Cambridge and the Massachusetts Institute of Technology, and within the European research projects VELA and NACRE.
The current generation of the Silent Aircraft Initiative, the SAX-40, has focused on developing an aircraft configuration that would provide a 20% reduction in fuel burn) over current generation commercial transports, and limit the perceptual noise, commonly taken to include a Day-Night Noise Level greater than 55dB, to within the perimeter of a typical international airport [123].
Figure (71)
While the BWB appears attractive on paper, the technology is relatively immature. Thus far, only subscale demonstrators, including the Boeing X-48, have been flight-tested [124]. Significant design, maintenance, and airport compatibility issues must be addressed, all of which may delay the commercialization of the BWB to beyond the 2020 timeframe. Nevertheless, the U.S. military has expressed interest in the concept as either a transport aircraft or an aerial refuelling tanker [125] and NASA and other organizations are continuing the technology risk reduction programme.
3) Cruise-Efficient Short Take-off and Landing (CESTOL):
The Cruise-Efficient Short Take-off and Landing (CESTOL) concept was devised to provide a capability to perform missions of around 1000 NM, similar to the majority of flights performed today by the Boeing 737 and Airbus A320 families of aircraft, while operating from smaller regional and “metroplex” (city) airports. These have stringent demands for low noise and short and/or steep climb and descent requirements [126].
Figure (72) – The Hypothetical Design of CESTOL Concept
The CESTOL is a response to NASA’s Horizon Missions Methodology (HMM) [127]. Under the HMM, it is envisaged that there will be a shift in airline network structures toward a more distributed framework [128]. This would decrease the average number of passengers carried on an individual flight. Moreover, these passengers would desire to operate out of local airports closer to home, which are often not equipped with runways or facilities capable of handling larger aircraft. A CESTOL aircraft, on the other hand, could operate on runways as short as 500 metres and cruise at Mach numbers near those of current generation civil transports [129].
An advantage of the CESTOL concept, even when operating in larger airports, is that the aircraft would be able to operate in and out of runways that, at present, can only be used by small regional jets and turboprops. This would relieve many existing airports from congestion, and thus reduce the fuel burn associated with taxiing and holding. This is only an operational fuel saving, since a CESTOL aircraft’s fuel burn per passenger-km might be rather higher than for current ones.
4) Truss and Strut-braced Wing (TSW/TBW):
Beginning with the inception of the Boeing 707, nearly all modern subsonic transport aircraft bear a close resemblance to one another in their external configurations. Along with continued investigations on several revolutionary configurations, such as the Blended Wing Body and the Joined Wing [130], the Truss-Braced Wing (TBW) [131] concept has been recognized as another alternative subsonic configuration that could considerably enhance the aerodynamic efficiency of a conventional take-off and landing aircraft.
Figure (73) – Boeing SUGAR Truss-Braced Wing (TBW) Aircraft Concept
The motivation toward the TBW configuration is grounded on the well-known relationship between induced drag and wing aspect ratio. Extensive increases in the aspect ratio or wingspan would yield a considerable reduction in drag, thereby enhancing the lift-to-drag ratio during cruise. Nevertheless, this idea is not likely to be realized with conventional cantilever wings due to weight penalties. Wing weight increases with increasing wing aspect ratio, thus negating any gains associated with improved aerodynamic efficiency, such as savings in fuel weight, from an aircraft perspective.
Figure (74) – TBW Pressure Coefficient Distribution Computed by STAR-CCM+
However, the TBW concept would allow a substantial increase in wingspan with few significant weight penalties, or in some cases, savings in wing weight are likely [132]. Such aerodynamic enhancement at little structural cost would further serve to reduce wing area and aircraft weight according to a general aircraft sizing routine. Additionally, the resultant downsizing of the propulsion system would, in turn, allow a synergistic reduction in noise emissions levels. A recent study [133] on Strut-Brace Wing configurations, which can be considered as a subset of the TBW, indicates that an optimized single-strut configuration can allow a nearly 20% reduction in take-off gross weight and a 29% reduction in fuel burn when compared to a technologically similar cantilever-wing configuration [134,135]. Such remarkable improvements in cruise performance would logically enable nominal reductions in pollutant engine emissions. These benefits, which originate solely from aerodynamic enhancements, would be further augmented if appropriate supporting technologies were to be synergistically integrated into a working TBW concept.
Figure (75) — Notional Diagram of TBW with VCCTEF System
A TBW configuration designed for civil transport is most likely to have a very long wingspan, possibly larger than the gate-box limit of 80 meters. This is why a folding wing concept, similar to that applied to the Boeing 777 as an optional feature, is considered to be one of the core enablers for the TBW aircraft. Such extremely high aspect ratio wings, however, are a cause of significant unknowns with respect to the ability to manufacture and maintain TBWs. Further, the additional weight of the wing folding mechanism will reduce and possibility eliminate the fuel burn benefit. There is ongoing research at NASA that focuses on risk reduction related to the TBW concept.
5) Boundary Layer Ingesting Inlet:
Recent trends in the development of engine nacelles and engine/nacelle integration have focused on reducing the interference losses, fuel burn (~3.8 % based on Silent Aircraft [60]) and minimizing noise. However, there are several potential developments in nacelle design that promise not only to reduce noise, but also to mitigate engine installation losses. These technologies include the buried, boundary layer ingesting installation concepts shown in Figure (76) and the variable area fan nozzle.
Motivated by the drive to create a silent aircraft, designers have been investigating burying and/or shielding the propulsion system from the external flows. This typically involves placing the engine inside the fuselage or the wing, or putting a portion of the vehicle’s structure between the engine and an observer.
Figure (77) – Sketch of Working Principle of BLI concept
The issue here is that the body of the vehicle disrupts the flow. In the past, either an engine’s inlet was located outside of the boundary layer, or the disturbed air was diverted, as it contributed to losses in efficiency.
Figure (78) – Boundary layer ingesting inlets on Aircraft
The boundary-layer ingesting inlet, on the other hand, is devised to re-energise the wake of the aircraft [59] by ingesting the incoming boundary layer.
Figure (79) – Boundary layer ingesting inlets Fan
The downside of this concept is that the distortion of the airflow occurs at the engine fan face, which has the potential to decrease fan efficiency and increase the stress on the fan blades [60, 68]. It is therefore doubtful if this design principle can be made beneficial for modern engines.
6) Slotted, Natural Laminar Flow (SNLF) Airfoil:
Figure (80) – SNFL Airfoil merged with TTBW Concept
The research is targeted to address ARMD Strategic Thrust 3 –Ultra-Efficient Commercial Vehicles.
By demonstrating a viable aerodynamic wing-design concept enabling 70% reduction in fuel/energy burn compared to 2005 baseline. The solution is by a Revolutionary Airfoil Design: called “Slotted, natural-laminar-flow” (SNLF) airfoil.
Figure (81) – SNFL Airfoil Design
Non-experts will be able to see the difference.
This unique design of airfoil have these features:
Low-speed tests show simultaneous decrease in cruise drag coefficient and increase in static maximum lift coefficient.
Slotted airfoils also have known benefits for transonic wave drag.
Changes the rules for airfoil design and affords extra degrees of freedom.
Figure (82) – SNFL Airfoil in Lab
Figure (83) – S414 installed in the Penn State Low-Speed, Low Turbulence Wind Tunnel
Figure (84) – CFD Result of SNFL Airfoil
Figure (85) – CFD Result of SNFL Airfoil
A multidisciplinary team of researchers covering all areas of aeronautics (Primarily academic partners (UTK + 5 others) with 2 two industrial partners (Airfoil, Incorporated + Boeing Research & Technology).
Figure (86) – Partners of this exciting project
Build upon recent N+3 concept studies by Boeing and MIT where natural laminar flow is an enabling technology for performance goals. Down-selection to Boeing TTBW configuration.[Ref-6]
Figure (87) – Testing SNFL Airfoil merged with TTBW concept in wind tunnel
Figure (88) – Boeing SUGAR High TTBW
You may read about this technology by downloading PDF File from [HERE]
7) Span-wise Adaptive Wing (SAW):
Figure (89) – Span was used to decrease the drag of air
NASA is exploring the feasibility of a system that will allow part of an aircraft’s wing to fold in flight, to increase efficiency through wing adaptation.
Engineers at NASA’s Armstrong Flight Research Center in California, Langley Research Center in Virginia, and Glenn Research Center in Ohio, are working on the Span-wise Adaptive Wing concept, or SAW.
Figure (90) – Small Prototype of Plane with SAW concept
Figure (91) – Small Prototype of Plane with SAW concept
Figure (92) – Technical Detail of ARENA Plane Prototype
The concept, if feasible, would permit the outboard portions of the wings to move to the optimal position during operation. This could potentially result in an increase in efficiency by reducing drag and increasing lift and performance.
Figure (93)
Through advanced actuation, SAW aims to use control surfaces to allow the outboard portions of wings to adapt as much as 75 degrees, to optimally meet the demands of the various conditions throughout a flight. A mechanical joint, acting as a hinge line for rotation, makes the freedom of movement possible.
Figure (94) – Span can rotate 75⁰ Degree
“Ideally, we would be able to take that portion of the wing, and articulate it up or down to the optimal flight condition that you’re in,” NASA Armstrong principal investigator for SAW Matt Moholt said.
“So let’s say you’re a condition that requires a climb-out. The optimal position might be up 15 degrees or down 15 degrees, and you would be able to get that.”
The objectives of testing on PTERA include the development of tools and vetting of system integration, evaluation of vehicle control law, and analysis of SAW airworthiness to examine benefits to in-flight efficiency.
Figure (95) – Future Plane may changed totally by Applying SAW concept
The ability to achieve an optimal wing position for different aspects of flight may also produce enough yaw control to allow for rudder reduction on subsonic and supersonic aircraft, which may provide additional benefits to aircraft efficiency, such as reduced drag and weight. [Web-5]
That’s all what I have for this exciting space. You may find more in IATA PDF link.
IATA has uploaded a video for promising technologies that will be in the market between 2035 – 2050. You may watch the video [HERE].
7) Benefits of CFD Simulation Programs:
Figure (96) – Life without computer
No doubt that entering the era of computer changed everything in our life.
The old engineers definitely remembered what the life look like in the past, when they were drawn or do a complicated experiment without helping the Auto-CAD or Simulation software.
Figure (97) – Old days of drawing
Figure (98) – Old days of drawing
Figure (99) – Old days of drawing
Really, it was hard time which nobody can imagine now.
Using computer makes our life more easy, flexible & accelerated our business by using Internet.
Figure (100) – 3D Simulation of Flight
There are many types of simulation software either in mechanical , civil, electrical , chemical & so on.
For the simulation of wing, we used a CFD software such as “Fluent-ANSYS”.
Fluid (gas and liquid) flows are governed by partial differential equations which represent conservation laws for the mass, momentum, and energy.
Computational Fluid Dynamics (CFD) is the art of replacing such Partial Differential Equation (PDE) systems by a set of algebraic equations which can be solved using digital computers.
Computational Fluid Dynamics (CFD) provides a qualitative (and sometimes even quantitative) prediction of fluid flows by means of:
Numerical methods (discretization and solution techniques)
Software tools (solvers, pre- and post-processing utilities)
CFD enables scientists and engineers to perform ‘numerical experiments’ (i.e. computer simulations) in a ‘virtual flow laboratory’
Numerical simulations of fluid flow (will) enable [Ref-7]:
Architects to design comfortable and safe living environments.
Designers of vehicles to improve the aerodynamic characteristics.
Chemical engineers to maximize the yield from their equipment.
Petroleum engineers to devise optimal oil recovery strategies.
Surgeons to cure arterial diseases (computational hemodynamics).
Meteorologists to forecast the weather and warn of natural disasters.
Safety experts to reduce health risks from radiation and other hazards.
Military organizations to develop weapons and estimate the damage.
CFD practitioners to make big bucks by selling colorful pictures.
These are some of examples of capability of CFD can do in our life.
Figure (101) – Simulation of AC-1 Aircraft
Figure (102) – Applications of CFD Simulation
Figure (103) – Applications of CFD Simulation
CFD model demonstrating the correlation between wall shear stress (WSS) and restenosis in coronary artery disease (a – structural modeling of sent insertion in porcine arteries reconstructed from micro-ct and stent-srtery coupling obtained after arterial recoil (See figure 104–A)
Comparison between the in vivo histological images (left) and corresponding sections from structural simulation (right) demonstrating excellent agreement (See figure 104-B).
Figure (104) – CFD Simulation for Coronary Artery Disease
Results of CFD simulation in terms of the spatial distribution of WSS magnitude over the arterial wall. (See figure 104-C)
The correlation between areas characterized by low WSS (orange lines) an in-stent restenosis after 14 day. The CFD simulation of WSS has identified areas of reduced shear and restenosis with excellent agreement. (See figure 104-D) [LINK]
So, what’s the difference between simulation & real experiment.
The answer in below figures.
Figure (105) – Difference between Experiment & Simulation
Figure (106) – Difference between Experiment & Simulation
Now, let us see our results of miracle airfoil by using CFD program “Fluent”.
8) CFD Simulation of Miracle Airfoil:
⊕⊕ Preparation stage
Before we begin, I should mention something embarrassing about me that I had done it in the past related to CFD Simulation.
In 2018, I have published an article named as “Fuel Consumption Mitigation of Aircrafts by Applying Astonishing Ideas” & I have used Simulation program “Fluent-ANSYS”as you see in figure (107).
Figure (107)
In that dark time, I had no idea totally about:
The value of Y-plus “Y+” for turbulence flow & how it’s crucial factor in CFD simulation especially for
The Angle of attack (AoA).
The types of NACA series.
The NACA experimental results (Abbott NACA report 824) for comparing.
I was thinking that, I may draw any shape of airfoil by using pre-processor drawing program such as “GAMBIT” & then use CFD simulation such as “Fluent” to see the results.
Then, I will add my creative ideas on it as we see in figure (108) & see any further improvements in the performance of airfoil such as drag & lift force.
When I started this simulation of miracle airfoil (which I was thought that I fulfilled by enough knowledge of how to simulate an airfoil successfully such as NACA 4412 & I did it), I was made another mistake.
Figure (109) – Meshing NACA 4412 by using GAMBIT Software
Figure (110) – Contours of Static Pressure of NACA 4412 using FLUENT Software
Figure (111) – My CFD Residuals of NACA 4412
Figure (112) – Comparison of my CFD Simulation with Abbott Report
I was thinking that if I have very low residuals by reducing the Courant Friedrich-Levy (CFL) number, that should mean more accurate results. The new airfoil is complicated, so by using normal ways will not give us result unless an CFD error, so either it’s non-physical case or the mesh is low .
The last issue of enhancing mesh will take a long time to see results [see figure (113)] which I don’t prefer it for preliminary designs for quick evaluating & analyzing to see if it’s good or not & after that if there is high powerful computer we can increase the mesh quality.
Figure (113) – Required Time for increasing the accuracy of simulation
So, how I discover the mistake ??!!
One day, I have downloaded some PDF files related to CFD simulation & I found a paper/presentation named as “Lecture 5 – Solution Methods Applied Computational Fluid Dynamics by Instructor: Prof. André Bakker”.
You may read about it by downloading PDF File from Bakker’s website [HERE]
I went through it to see what it was containing from information & I noted something strange.
He said [See Figure (114)]:
Figure (114)
What ?? Residuals are not my solution !!!
I was shocked.
Why lowering residuals doesn’t mean more accurate answer. That’s weird really.
He also said [See Figure (115) ]:
Figure (115)
I will not deny that I had my doubts about my obtained results of miracle airfoil as there are some tolerance fluctuations in range of ±0.001 as we see in figure (116), but I said to myself: “Maybe it’s matter of mesh quality”
I have used coupled – pressure based solver as the remain option (e.g. SIMPLEC) was not helpful & also the coupled didn’t give me an answer unless to reduce the CFL number up to 0.1 & I was thinking I’m brilliant 🙂
Figure (116) – My Previous mistake about Simulating Miracle Airfoil
Under-relaxation factor (URF)or Courant Friedrich-Levy number (CFL) are tricky mathematical method to stabilize the iterative process. It shouldn’t be too low. When stabilizing returned back, then we can change gradually the value of URF or CFL up to default value.
We always learning from our mistakes to improve our ability to be familiar with new knowledge.
⊕⊕ Launching stage
Obviously, I can’t reveal the secret design of miracle airfoil for future business & sign Non-Disclosure Agreement (NDA) with companies who are interested with this innovative concept & scientific breakthrough in aviation industry.
Figure (117) – Confidentiality is A Business Treasure
So, we will give only the results of CFD simulation with real screenshots from the window of “Fluent” program to authenticate my expertise that everything is fine.
We will study all situations of air flows which is related to Mach number (Ma) & they are:
Incompressible Flow. (Ma <3)
Subsonic Flow. (0.3< Ma <8)
Transonic Flow. (0.8< Ma <2)
Supersonic Regime. (1.2< Ma < 5)
Hypersonic Regime. (5< Ma < 12)
Hyper Velocity Flow (12< Ma)
Figure (118) – Mach Number Flow Regimes
I should also mention that I have discovered many designs for the 3rd concept (e.g. Type A,B, C, …), which means more flexibility in designing process when our options is limited according to the operating conditions.
So, let us start our investigation with first type.
Miracle Airfoil – Type “A”
#1# Incompressible Flow (Ma < 0.3) Case:
We have used GAMBIT software to draw the miracle airfoil with it’s boundary layer which the length of boundary should be 20 time of the airfoil’s cord to use “Pressure Far-Field” option in boundary condition for compressible flow case later. See figures (120) & (121).
Figure (120) – Meshing Miracle Airfoil type “A” using Gambit Software
Figure (121) – Boundary Condition of Miracle Airfoil type “A” in FLUENT Software
Below Figure shows our case properties parameter that has been used for our simulation for incompressible flows cases of type “A” in Fluent software:
Figure (122) – Solver Properties in FLUENT Software
Figure (123) – Viscosity Properties in FLUENT Software
For incompressible flows it is normal to specify a large (typically atmospheric pressure) operating pressure and let the solver work with smaller “gauge” pressures for the boundary conditions, to reduce round–off errors. [Ref-8]
Figure (124) – Material Properties in FLUENT Software
Figure (125) – Solution Control Properties in FLUENT Software
Figure (126) – Residuals Properties in FLUENT Software
I have started with air velocity of 60m/s(Ma = 0.173) in the beginning of this simulation, and I will not deny that I encounter many issues for obtaining stability status until I used an adaption for increasing the mesh quality.
Figure (127) – Inlet Properties in FLUENT Software
Figure (128) – Outlet Properties in FLUENT Software
Definitely, that’s option has an expensive cost on the required time to simulate the miracle airfoil successfully. It can takes days to get CFD results even you are using low turbulence option like Spalart-Allmaras model.
Figure (129) & (130) shows the residual plot & iteration values of type “A”.
Figure (129) – Residual Plot of Type “A” by FLUENT Software
Figure (130) – Iteration Values of Type “A” by FLUENT Software
You may notice that, how the values of drag & lift coefficient seems approximately constant in range of 10^-3. That’s agree of what Prof. Baker said previously to obtain an accurate answer of our case as we see in figure (131). Lift & drag coefficient are important factors to decide that.
Figure (131) – Prof. Bakker’s Statement about accurate result
The detail of lift & drag force (pressure + viscous) is shown in figure (132).
Figure (132) – Lift & Drag Force of Type “A” by FLUENT Software
For making sure that the quality of mesh has not any effect on our CFD result, we used double precision (DP) option in fluent & we have these results shown in figures (133) & (134):
Figure (133) – Double Precision Option activated for Residuals Plot
As we see from figure (134), the values @ normal & double precision (DP) option in Fluent software are very close to each other. So, we are in good hand with Fluent & we can use normal precision to save time for all situations.
We have also tested our miracle airfoil – type “A” with another models to make sure that it’s doesn’t effect by changing the classical models which based on Reynolds Averaged Navier-Stokes (RANS) equations (time averaged). The main models in CFD Fluent Software are shown in figure (135). The number of equations denotes the number of additional Partial Differential Equations (PDEs) that are being solved.
Figure (135) – Turbulence Models in FLUENT
We have used only 2 model which are: RKE & K-Omega SST model. Below Figures shows the result of residuals & iteration values which contains the drag & lift coefficient @ normal precision.
Figure (136) – Residual Plot of Type “A” by using RKE model
Figure (137) – Iteration Values of Type “A” by using RKE model
Figure (138) – Residual Plot of Type “A” by using K-Omega model
Figure (139) – Iteration Values of Type “A” by using K-Omega model
Actually, I don’t use Reynolds stress model, because if those previous models S-A, RKE or K-Omega takes me several hours to find accurate result due to the high quality of meshing that I have made by using Adaption option. So, how do you think it will take time to simulate by using Reynolds Stress. Look to figure (141) & you will see how much.
Figure (140) – Standard RANS models
Figure (141) – Advanced RANS models
Now let us see how miracle airfoil may affect with angle of attack (AoA) & different velocities f air in range of incompressible flow regime.
Angle of Attack (AoA ) Effect:
We use the same velocity of previous example (e.g. V=60m/s) with normal precision option with Spalart-Allmaras turbulence model for Fluent software in our evaluation of how the miracle airfoil – type A may act on AoA for ±2, ±4 & ±6 degree.
Remember that sign of angle represent the rotation of angle. Positive sign means, the angle will be calculated with the clockwise dircetio9n & vice versa is true.
AoA = +2⁰ @ V=60m/s
Figure (142) & (143) shows the residuals & iteration results for angle of attack (AoA) in respect of speed 60m/s.
Figure (142) – Residual Plot of Type “A”
Figure (143) – Iteration Values of Type “A”
AoA = +4⁰ @ V=60m/s
Figure (144) – Residual Plot of Type “A”
Figure (145) – Iteration Values of Type “A”
AoA = +6⁰ @ V=60m/s
Figure (146) – Residual Plot of Type “A”
Figure (147) – Iteration Values of Type “A”
Now let see the effect of negative sign of angle of attack.
AoA = -2⁰ @ V=60m/s
Figure (148) & (149) shows the residuals & iteration results for angle of attack (AoA) in respect of speed 60m/s.
Figure (148) – Residual Plot of Type “A”
Figure (149) – Iteration Values of Type “A”
AoA = -4⁰ @ V=60m/s
Figure (150) – Residual Plot of Type “A”
Figure (151) – Iteration Values of Type “A”
AoA = -6⁰ @ V=60m/s
Figure (152) – Residual Plot of Type “A”
Figure (153) – Iteration Values of Type “A”
By collecting all the results of angle of attack effect in table comparison & draw a curve graphs, we will have what we see in below figures. Note, that angle of attack equal to Zero (AoA=0⁰ Deg) has been tested in first example before.
Figure (154) – Comparison table for AoA effect on miracle Airfoil type A
Figure (155) – AoA Effect on Lift Coefficient
Figure (156) – AoA Effect on Drag Coefficient
Figure (157) – AoA Effect on Lift/Drag Ratio
Speed Effect:
We have tested different speeds of air in the range of incompressible flow (e.g. 5, 50, 60 & 100m/s) to see if the lift or drag coefficient has been changed. But there is no change at all.
Here’s the results of our simulation for miracle airfoil – type “A”.
V=5 m/s @ AoA = 0⁰ Deg
Figure (158) & (159) shows the residuals & iteration results for speed = 5m/s in respect of AoA = 0⁰.
Figure (158) – Residual Plot of Type “A”
Figure (159) – Iteration Values of Type “A”
V=50 m/s @ AoA = 0⁰ Deg
Figure (160) – Residual Plot of Type “A”
Figure (161) – Iteration Values of Type “A”
V=100 m/s @ AoA = 0⁰ Deg
Figure (162) – Residual Plot of Type “A”
Figure (163) – Iteration Values of Type “A”
By collecting all the results of speed effect in table comparison, we will have what we see in figure (164). As you notice, we don’t need to draw a graph curve to see the relationship between speed & coefficient values as it’s constant for all situation either laminar or turbulence flow.
Note, that speed of 60m/s @AoA=0⁰ Deg, has been tested in first example.
Figure (164) – Comparison table for speed effect on miracle Airfoil type A
Thickness Effect: (Later)
Special Length Effect: (Later)
#2# Subsonic Flow (0.3< Ma < 0.8) Case:
Figures (165) & (166) shows our case properties parameter that has been used for our simulation for subsonic flows cases of type “A” in Fluent software & as we know air will be compressible fluid which means we will use the idea gas law to determine pressure, temperature & density.
Figure (165) – Solver & Viscosity Properties in FLUENT Software
For compressible flows, the solver needs to use the absolute values in the calculation, therefore, with compressible flows, it is sometimes convenient to set to operating pressure to zero, and input/output “absolute” pressures.
Figure (166) – Material & Operating Pressure Properties in FLUENT Software
Figure (167) – Solution Control Properties in FLUENT Software
The pressure-based solver with the Coupled option for the pressure-velocity coupling is a good alternative to density-based solvers of ANSYS Fluent when dealing with applications involving high-speed aerodynamics with shocks. Selection of the coupled algorithm is made in the Solution Methods task page in the Solution step. [Ref-9]
I have started with air velocity of 200m/s (Ma = 0.5671) s a base point of comparison with other velocities with Spalarat-Allmarasturbulence model. Figure (168) & (169) shows the inlet & outlet parameters of pressure & temperature by assuming that total pressure & temperature is 101.325 KPa & 300 K.
Figure (168) – Inlet Properties in FLUENT Software
Figure (169) – Outlet Properties in FLUENT Software
Figure (170) & (171) shows the residual plot & iteration values of type “A” for velocity = 200 m/s .
Figure (170) – Residual Plot of Type “A” by FLUENT Software
Figure (171) – Iteration Values of Type “A” by FLUENT Software
I will be honest with you, that you can’t only start simulation & get result immediately as we see in above two figures even it seems not accepted for regular engineer as fluctuation appear in some residuals line especially the parameters of momentum equation, but when I saw a simulation of NACA 0012 with approximately same fluctuations, they get an accurate result for drag & lift coefficient as we see in figure (172) & (173). As Prof. Bakker said before, we should monitor the interest parameter that we concerned such as lift or drag coefficient.
Look how it’s very steady in right graph of figure (173).
Figure (172) – Convergence of NACA 0012 airfoil by FLUENT
Figure (173) – Residuals Fluctuation exist in that case
So, you should apply some tricks & tips in FLUENT software to stabilize & accelerate the solution with accurate result as possible as it can. Such ideas is to use the 1st Order Upwind first until reach to converged situation, then switch to the 2nd Order Upwind.
Also, I nearly forget to mention that one of methods to ensure & assess that you get an accurate result is to check the value of net flux of mass & heat of all inlet & outlet sides. Figure (174) shows what I’m talking about related to subsonic case.
Figure (174) – Mass Flux Net Result of Subsonic Case
From this example, you may notice that there is no significant difference in the lift & drag coefficient between subsonic & incompressible flow as we see in figure (175).
Figure (175) – Comparison between incompressible & subsonic case @ AoA= 0⁰ Deg
It’s the scientific or said numerical evidence that our miracle airfoil is unique & have more secrets to be disclosed especial the effect of special length.
Now let us see how miracle airfoil may affect with angle of attack (AoA) & different velocities f air in range of incompressible flow regime.
Angle of Attack (AoA ) Effect: (Later)
Speed Effect: (Later)
Thickness Effect:(Later)
Special Length Effect:(Later)
#3# Transonic Flow (0.8< Ma < 1.2) Case: (Later)
#4# Supersonic Flow (1.2< Ma <5) Case: (Later)
#5# Hypersonic Flow (5< Ma < 12) Case: (Later)
#6# Hyper Velocity Flow (12< Ma) Case: (Later)
Miracle Airfoil – Type “B”(Later)
Miracle Airfoil – Type “C”(Later)
Miracle Airfoil – Type “D”(Later)
9) Conclusions:
Miracle Airfoil- Type “A”
The main feature of miracle airfoil –type “A” that it doesn’t change the values of aerodynamic performance in all situation.
In our conclusions section we will compare previous result of miracle airfoil with recent airfoil corresponding to the flow situation (e.g. incompressible, subsonic , …etc) to see if it’s revolutionary technology or not.
Comparison 1: Incompressible Flow Situation
W have select NACA 4412 as standard airfoil to compare it with the miracle airfoil @ velocity of 60m/s. Figure (176) shows the aerodynamic performance (lift, drag, momentum coefficient) of NACA 4412 which has been plotted by using X-Foil software. As you notice, the lift & drag coefficient are 1.5259 & 0.01350 @ AoA = 10⁰ Deg.
Figure (176) – Simulation Result of NACA 4412 by X-Foil Software
That angle of attack (AoA) is assumed to give higher lift coefficient for NACA 4412 according to the Abbott’s Report 824, as we see in figure (177). Maybe you will not see it Clearly unless you download the PDF report & zoom it.
Figure (177) – Practical Result of NACA 4412 by testing airfoil in Wind Tunnel
Anyway, it seems that miracle airfoil – Type A – can’t compete with the low speed applications as the lift-drag ratio of it was 4.3 which is lower than NACA 4412 which was 113 in maximum value of lift coefficient.
The road for discovering the secrets of miracle airfoil is too long as we should consider the effect of special length which I believe it will enhance the airfoil performance without forget that we are talking now only in type “A” .
So, we will continue our research in incompressible flow situation as soon as possible as I’m very excited for it & I hope that I have the time & high process CPU because it takes me long time to get results.
Figure (178) – The Journey Started
Let us see how really miracle airfoil effect the high speed application significantly.
Comparison 2: Subsonic Flow Situation
I have select Boeing as my standard comparison with miracle airfoil as it’s data available in many articles.
Figure (179) shows the curve graph of aerodynamic performance for “B787 Dreamliner” by using simulation software named as “PIANO”.
Figure (179) – Performance of B787 Dreamliner by PIANO Software
I found also a PDF file named as “Transonic Aerodynamics of Airfoils and Wings” which is contains a curve graph of performance for b747-100 as we see in figure (180).
Figure (180) – Comparison of approximate drag rise methodology with Boeing 747-100 – flight test data from Mair and Birdsall
It seems that they considered mach number of 0.6 or 0.7as a transonic flow, not subsonic as I mentioned before. Definitely, this matters related to the shape of airfoil.
Anyway, we will assume that Ma=0.7 is in subsonic flow, & as you notice from last curve that all lines are horizontally steady before Ma=0.75, so we can assume that speed of 200 m/s (Ma = 0.5671) has the same aerodynamic performance (lift & drag coefficient) of point located in red circle.
Definitely, we will neglecting the effect of body & engine of B747-100 plane.
So, according to what I found about B747-100 in Webs, the mass of wings approximately equal to 40.2 ton as we see in the right column of figure (181).
Figure (181) – Weight Breakdown for some Representatives Aircraft
Figure (182) shows the aerodynamic performance & dimensional values of B747-100 airfoil & we compare it with the miracle airfoil – type “A”.
Figure (182) – Comparison between B747-100 & Miracle Airfoil
As you noticed, the mass of airfoil has been decreased up to 14 ton which means we have reducing fuel consumption by percentage of 65%. It’s excellent option for economic of companies & environmental sides for humankind.
As I remember, I have started this scientific research in September 2019 when I simulated new airfoils that I have imagined with different design by CFD simulation software named as “Fluent-ANSYS”.
Suddenly, I found my treasure airfoil which can let us to reduce a significant amount of fuel consumption.
In that time, I wasn’t aware that this 3rd concept of flight can really give us more flexibility options to choose what suitable for our situation. That’s the reason why there are many types of miracle airfoil such as type “A”, “B”, “C” & so on.
It will takes long time to evaluate these types by CFD simulation software with regular & limited personal computer, without mention that we should know exactly how each type reacted in different flow regions (e.g. incompressible, subsonic , ….etc)
We will be patient & maybe this new technology will be one of the greatest scientific breakthrough in history of aviation. I will not deny that I have some mistakes but with time I correct them.
I understand the reason of 3rd concept exactly & it will takes time to establish it’s theory.
2) Wind Tunnel:-
Figure (184)- Exterior Part of Wind Tunnel
Numerical results (or CFD Simulation) is not enough for deciding to manufacture planes in commercial business line. We should test our design in what’s called “Wind Tunnel” to match the real life circumstances.
Figure (185) – Rocket placed in Wind Tunnel
Numerical results helps us to predict approximately preliminary behavior of what will happen in practical, but the final decision is coming from practical tests. So, the sequence of process is simple, starting with simulation, small prototype , then large prototype & finally the commercial manufacturing for safe use.
Boeing currently under contract with NASA to mature and develop the TTBW Concept. This is a continuation of previously-funded NASA Projects [Ref-6]:
SUGAR Phase I –TTBW Conceptual design and technology roadmap
SUGAR Phase II –TTBW Aeroelastic development (FEM and TDT test)
SUGAR Phase III –High-speed design and test of a TTBW for Mcruise=0.745
SUGAR Phase IV (in progress) which includes:
Development of high-speed lines for Ma_cruise=0.8
High-speed wind tunnel test
Low-speed (high-lift) system development
Low-speed (high-lift) wind tunnel test
Figure (186) & (187) shows the roadmap for NASA/Boeing Transonic Truss-Braced Wing (TTBW) project & I was wondering why testing prototype take many years to evaluate ?
Does it have a relation with priorities of funding budget?
Figure (186) – Project Plan
Figure (187) – Roadmap of Technology
Very few companies & institutions has this type of wind tunnel & we should wait until the professionals agree our numerical results & then we can move forward to test the 3rd concept in small prototype & I will publish the results one-day.
Failure of My Laptop:-
Before Tuesday 27/Feb/2020, I was try to fix a micro-SD for someone which shows files but it can’t be deleted.
Actually, I lifted as it seems impossible to do anything about it by any partition software. But in that worst day in my life, I tried again & suddenly the laptop hang out, then screen turn on to blue. It was Dump memory Errror. Sometimes it’s called “The Blue Screen of Death” [See figure 188]
Figure (188) – The Screen of Death
I said to myself “It happened before a lot & I should wait until the countdown finish”.
When the computer restart, the screen turn on black. [See figure 189]
Figure (189) – The Black Screen issue
Really I was shocked.
I was searching on internet to find the solution & I realized what happen.
My Laptop’s disk has been in RAW state. The machine can’t find the operation system of windows in disk as it’s not organized.
The worst nightmare that nobody like to hear/see it at all. Everything (files & scientific researches) worked since 2013 is gone now because I should format it.
Figure (190) – The Horrible Nightmare of People
All that happen due to small micro-SD card. small piece ruin my whole Laptop.
But the life may let us to find the hope by using bootable partition or recovery software.
On 5 March 2020, I solved the issue by converting the RAW to NTFS (e.g. FAT16 & FAT32) only without formatting & loosing data. I was really relaxed after this crazy week.
Thinking about the consequences of worst scenario if I don’t solved it properly, was all my concerns in that dark time. I will be desperate & disappointed after all these years works independently in scientific researches & suddenly disappear all what you have done.
That’s bad experience let to consider to put my important files & scientific researches in external disk for secure my works.
Anyway, thanks to The God “Allah” for that day & I hope that other people aware of what happen if you insert corrupted SD card & you don’t have any experience to deal with it. You should use independent PC to fix these kind of corrupted disk/USB Flash/pen drive.
This scientific article was really takes long time to write, collect photo & simulate the new airfoil.
I was extremely exhausted in this 6 months of hard working.
That’s all what we have for today & I will update this article periodically as there alot of works should be finished especially with high Mach number
11) References & Websites:
*References*
Ref-1: Fundamentals of Aerodynamics, 5th Edition by John D. Anderson [PDF]
Ref-2: Airplane design (Aerodynamic), Chapter-5, Wing design – selection of wing parameters, By Prof. E.G. Tulapurkara – Dept. of Aerospace Engg., Indian Institute of Technology, Madras 1. [PDF]
Ref-4: Principles of Flight, Ch4 – Lift/Drag,(2008). [PDF]
Ref-5: Some High Lift Aerodynamics, Part 1 – Mechanical High Lift Systems, , By W.H. Mason. [PDF]
Ref-6: Advanced Aerodynamic Design Center for Ultra-Efficient Commercial Vehicles, ARMD Strategic Thrust: Ultra-Efficient Commercial Vehicles (Thrust 3A), By Dr. Jim Coder, PI [PDF]
Ref-7: Introduction to Computational Fluid Dynamics, By Instructor: Dmitri Kuzmin, Institute of Applied Mathematics, University of Dortmund. [PDF]
Ref-8: Workshop 04 – Fluid Flow Around the NACA0012 Airfoil, By Dimitrios Sofialidis, Technical Manager, SimTec Ltd. Mechanical Engineer, PhD. [PDF]
Period for finding Ideas & Preparing the Article : 5 Weeks (Nov 2018)
BreakthroughPromisingTechnology for AerospaceIndustry
Before we start, we should give some notes:
1) I have wrote an article about fuel consumption of rocket launch in 2016 with photos ideas (No CFD simulation test). It’s funny & exciting. So, you may check it here [Web-1] if you like imagination.
2) Understanding really how natural phenomenon or machines works is very important to develop it to be more efficient, economical & applicable amazing solutions .
When I intend to wrote this article, I wasn’t know exactly know how rockets move upwards. In my university’s study, they gave us a general principles of thermodynamic & turbo machinery but not in detail as it s concerned with high education studies (e.g. Master & PhD holders). So, I read some article, e-book & watch videos related to rocket launch, which let me to see the big picture of paint. You can download an article from internet but you will discover it doesn’t give the answer of your questions, so you will search again & again until you reach to point of knowledge that you was ignored about it.
3) There are more than 50 hypothetical ideas in my notebook, They are either related to nozzle design, exterior body of rocket shape, new reusable technologies & merged technologies photos.
i decided to publish 4 ideas as I think it’s valuable & worth to let people know about my hard work rather wait 50 ideas. It will takes long time.
3) Thank for Mr. Robert O’keeffe (CEO & Founder of Tachyon Aerospace Co.) who was acknowledgement of my article of reducing fuel consumption of planes No.4 [Exotic Wings] [LINK].
He commented also by saying::
“In Rocket, There Is No Wings”.
He encouraged me indirectly to find ideas related to aerospace industry & there are more than 30 ideas in mind.
So, thanks for him
Actually, I wasn’t intend to focus on aerospace that time, and there was 2 ideas related to planes want to simulate it. But I said to myself :
“ Why I don’t stop now & take care about rocket launch as we have published many ideas related to planes”.
I was enjoyed from my heart after these horrible & exhausted month (Nov 2018).
Feeling relax after hard job is something make you happy that you make a little change in your life.
4) In the end of notes, enjoy reading & share it with people who cares about aerospace industry. Maybe one-day your little action of sharing, will change everything related to it by magic & unexpected events.
Quote of Article
Let Us Start Our Exciting Journey
INDEX
1. Introduction.
2. Market Potential of Space Industry in Future.
3. What’s the Rocket ?
4. Physical Laws of Rocket Launch.
5. Specifications of Launch Sites (Rocket Platforms).
6. Reusable Rockets.
7. Safety & Environmental Side Effect of Rocket Launch.
8. The Economical Feasibility Study of Rocket Launch.
9. My Astonishing Ideas:
Idea No.1:Winged Head of Rocket. (Activated: CFD Test – Fuel Usage 97% @ V=100m/s)
Idea No.2:Curved Nozzle. (Deactivated: CFD Test – Fuel Usage 58% & 26%)
Idea No.3:Dual Vertical Nozzles. (Deactivated: CFD Test – Fuel Usage 62% & 38% )
Idea No.4:Secret Rocket Engine. (Activated: CFD Test – Fuel Usage 76%)
Idea No.5:Propellants Tower Technology.
Idea No.6:Aerial Refueling Technology for Rockets.
Idea No.7:Wireless Electricity Technology for Rockets.
Idea No,8:Space Elevator Technology for Rocket.
10. Conclusion
11. My Last Words,
12. Amazing Photos & Videos of Rocket Launch.
13. References & Websites
1. Introduction:
Our entire life has been changed totally in many aspects for civilization’s welfare with collecting scientific & intelligence data after we succeed to put a first satellites on the orbit of earth.
Today there are thousands of satellite which is able us to send & receive telecommunication signals which are used in many industry from entertainment, communication, scientific intelligence & military purposes.
The biggest & expensive project in the world was international space station which cost approximately 150 Billion USD.
Figure (1) – International Space Station
That’s couldn’t be done without using a creative device called “Rocket” which is credited to American Engineer, Professor , Physicist & Inventor “Robert Goddard” who succeed to make & launch the first liquid fueled rocket in 1926. He was being named as “The Man who Ushered in the Space Age”. [web-2]
Figure (2) – Prof. Robert Goddard (B:1882-D:1945)
One of the biggest challenges in launching rockets & definitely the aerospace industry is the mass of fuel which is required to carry a small payload compared to massive mass of fuel.
As example, the Saturn V rocket which is used by NASA between 1967 & 1973, was capable for carry payload mass of 140 Ton (SI Units) to Low Earth Orbit (LEO) compared with the fully fuelled mass of Saturn Vrocket which was approximately 2950 Ton. So, the ratio of mass fraction of payload from total mass is 4.7%.
Rockets are carrying payloads (e.g. satellite as example ) on the top of rocket head.
Figure (3) – The launch of Apollo 10 on Saturn V AS-505, May 18, 1969
The cost per launch for NASA Rocket “Saturn V” was $185 million in 1969–1971 ($1.16 billion in 2016 value) [web-3).
Nowadays the average cost of launch by all private aerospace companies is approximately 230 Million USD (if we neglect the cost of heavy payload of SLS Block operated by NASA ).
The lowest & highest cost was 62 & 400 million USD respectively.
Figure (4) – Comparison of Launch Cost of Some Private Aerospace Companies
Without forget to mention how this massive fuel are affected negatively in our beautiful of environment by releasing too much harm GHGs & definitely climate change will increase.
Figure (5) – Extreme gaseous releasing from launching process
In this scientific article we will give some astonishing ideas for solving the issue of high fuel consumption per launch.
Some ideas has been proved by using CFD Engineering simulation program “ANSYS Fluent” & other ideas are only proposed technologies which some of them can’t be applied in short term for many reasons (either scientifically or economically reasons.
Anyway, these ideas which proved numerically by simulation program will decrease the operation & asset cost of rocket launch process.
So, let us start discovering our article space.
2. Market Potential of Space Industry in Future.
Figure (6) – US Space Station “Skylab”
The space orbit of earth are used extensively for installing satellites for many reasons by many leading & developed countries.
“ About 1,100 active satellites, both government & private. Plus there are about 2,600 ones that no longer work.
Russia launched the first satellite , Sputnik 1, in 1957. The oldest one still in orbit, which is no longer functioning, was launched in 1958”
The sizes of satellite varies. Communication satellite can be as big as a small school bus and weigh up to 6 tons, the Federal Communications Commission (FCC) says that weigh a few tons or less. Some that are used briefly are 4 inch cubes and weigh about 2 pounds (0.91 Kg).
Figure (7) – Satellite on Earth’s Orbit
They have a wide variety of roles:
GPS Satellites aid navigation, other relay telephone and television signals, others aid in weather forecasting, national defense, science and agriculture, as in monitoring crops & areas of drought. The union of concerned Scientists, a private organization that maintains a database of satellites, says about 60% are used for communication“ [Web-4]
The market of global space industry is really big more than you thinking.
“ The Space Industry is emerging as one of the most lucrative industry globally. The Space Industry, is valued at US$ 360 billion in 2018, is projected grow at a CAGR of 5.6%, to value US$ 558 billion by 2026.
Demand for Nano-satellites and re-usable launch vehicle systems is anticipated to be driven by the massive investment made by countries like US, China, Russia and the European Union in the development of next generation satellite systems and the large scale procurement of such systems by countries like Saudi Arabia, India, Japan and South Korea. The United States is the largest spender in the domain with China, European Union, India, Russia, Japan and South Korea anticipated accounting for the bulk of spending.
In terms of categories, Nano satellites is expected to account for the highest proportion of spending, followed by markets for reusable launch vehicles, especially those vehicles that can place payloads in LEO orbit. The market for Satellites is anticipated to be the largest category primarily due to the ongoing procurement of such systems by countries of the Asia Pacific, North America and European regions.
North America is expected to account for the largest share of the total global expenditure followed by the Asia Pacific Region where countries like China, India, South Korea and Japan are investing billions to procure such systems.
The report “Global Space Industry Market and Technology Forecast to 2026” offers detailed analysis of the global Space Industry and provides market size forecasts. Furthermore, it covers key technological and market trends in the industry and analyzes factors influencing demand for such Systems.” [Web-5]
But, the purpose of Launching rockets is not limited on installing a big satellite for digital communication & collecting intelligence or scientific data.
You are only see the small picture of all corners of space market.
Figure (8) – Journey to Mars Planet
Our natural resources are consumed extensively after the industry revolution in 1881, due to increasing of our population growth & our daily needs for welfare life. Creating new market meaning jobs for citizens which is main factor in sustainable development of any country.
Figure (9) – Modern Development of Country has A Cost
The space is very & very wide unknown place which until today we have very limited information about what is there actually.
Different chemicals element & compound are definitely suffering from un-usual conditions which is not occur in earth which may lead to create new & strange chemical compounds or finding new metals which help us to in specific industry for it’s unique physical/chemical properties .
Figure (10) – Our Solar System is very small part on Galaxy
Recently many private companies are seeking strongly for either colonization planets to posses the rights of mining/collecting the metal which found in that planet OR to establish a network solar planet for generating power to earth by smart & innovative method as shown in figure (11).
Figure (11) – Discovering our Solar System
I don’t know why some people like to leave our beautiful earth to colonize MARS planet. If the place is crowded why we built a city under or above city “buoyancy)
Figure (12) – City under Water
Anyway, that’s missions of space possession is not easy as we (investors) faced an financial issue of high cost of launch. As it doesn’t make any sense to pay 230 Million USD for only carry5 ton of payload.
Figure (13) – Spacecraft on roof of Big Plane for launching (Russia)
Who posses a very Innovative Launch System of Rockets by minimum & unexpected cost, he/she will dominated the all shares of space market potential alone without any competition.
3. What’s the Rocket ?
Figure (14) – One Space Technology Rocket (China)
A rocket is an innovative aero-impulse system which contains many devices to let us to carry payload to very long distance either in horizontal or vertical path.
The 4 pioneering scientist people who considered as the founders & fathers of modern rocketry are:
Konstantin Tsiolkovsky (Russian, B1857***D1935)
Hermann Oberth (German, B1894***D1989)
Robert Pelterie (French, B1881***D1957)
Robert Goddard (American,B1882***D1945)
Figure (15) – The Famous Founders of Modern Rocketry
Those famous people have made great contribution for our future of space flight & we should appreciate them for their hard & great works that they have done for civilization & definitely there are a lot of people which we should thanks them.
The components of rocket are shown in figure (16) & as we see it comprised of main parts which are:
Propulsion Engine.
Oxygen & Fuel Tank.
Payload.
Exterior body of Rocket.
Figure (16) – Components of Rocket
We will talk briefly about each parts of rocket.
1) Propulsion Engine:
Figure (17) – Engine in Rocket
Propulsion engine is Aero-Thermal-Mechanical device which help us to reduce the high pressure of exhaust gases with increasing the velocity of air at the exit of engine. The high exit velocity indicated an index of high thrust of engine.
Engine is contained of 3 main parts which they are:
Turbo-machinery Unit.
Combustion chamber (CC) Unit.
The Nozzle Unit.
Figure (18) – Components of Rocket Engine
Turbo-machinery (turbo-pump) unit is generally a hydro-mechanical device able to pressurize of propellant (fuel + liquid oxidized ).
It’s like water pump if you want to understand it well. The power of turbo-pump comes from a partial leakage from exhaust gas of nozzle after burning. It’s like turbine & compressor unit which the exhaust gases rotated the turbine, then the compressor will pressurize the propellant. Definitely there is an efficiency of this operation but not too high as I was guessed.
Figure (19) – Turbo Pump in Rocket
There are many cycles for powering turbo-pump.
“The selection of power cycle of turbo-pump can be driven by many factors” [Ref-1]:
Propellants
Performance (thrust, specific impulse)
Safety / Reliability
Reusability
Technical Risk
Cost / Schedule
etc..
After pumping propellants, we transfer this highly pressurized substances into the combustion (CC) unit.
Combustion chamber is a thermal & chemical unit & it’s considered the heart of rocket engine which the mixing process (chemical interaction process )of both fuel & oxygen are happen inside it & gives very high temperature & pressure of exhaust gases. It’s like car engine combustion cylinder or kitchen cooking cylinder.
Figure (20) –The Location of Injection for Combustion Process
Figure (21) – Injection Plate of F1-Engine of Saturn V
The Nozzle unit is very important mechanical device which able us to increase the exit velocity from rocket.
Figure (22) – longitudinal section of RD-107 rocket engine (Tsiolkovsky state museum of the history of cosmonautics)
The famous design of nozzle is called “de Laval Nozzle” which is referred to inventor Swedish “Gustaf de Laval”.
The nozzle was developed (independently) by German engineer & inventor Ernst Korting 1878 & Swedish inventor Gustaf de Laval in 1888 for use on a steam turbine. [Web-6]
The high pressure coming from combustion chamber (CC) unit will decrease in the convergence part of nozzle with increase of velocity simultaneously.
When it reach to critical point (throat of nozzle) which indicated that Mach number is One (Ma=1), then we change the shape of nozzle to be like divergent cone to increase the velocity & decrease the pressure until we reach the limit of our allowed pressure which is always be the ambient pressure on sea level (SL). The design of nozzle is depend on that issue, but in high altitude or vacuum, the surrounding pressure around the rocket is very low, so the thrust in that high location is very high.
The thermodynamic mechanism of how such convergent & divergent shape work & it’s manipulation is shown in figure (24).
Figure (24) – Thermodynamic of Convergent & Divergent Shape
There are two famous type of CD nozzle are used in rocket engine which they are Conical & Bell nozzle as we see in figure (25). Bell nozzle give us a bit more thrust than conical nozzle for trigonometric & mathematical reasons of that engineering geometry.
Figure (25) – Conical & Bell Nozzle
2) Fuel & Oxidizer Tanks:
Figure (26) – NASA investigating damaged SLS LOX Tank section @ Michael Assembly Facility in 2016
There are many types of propellant (fuel+ liquid oxygen), but the famous one which using extensively today are Liquid Oxygen and Highly Refined Kerosene (LOX/RP-1) & LOX-Hydrogen (LOX/LH2).
Figure (27) shows some of propellants types for Rocket.
So, maybe we are asking our self, whyare we using liquid oxygen rather using surround air like what we do in our life on earth?
Good question.
As we know, in any combustion process we need Oxygen for oxidizing the fuel for gaining high energy of propulsion. So, the abundant of Oxygen is vital matter & essential for our rocket effectiveness & continuing operation. Without it, the rocket flame will die.
The low concentration in high altitude is the main reason for using liquid oxygen & also in space, there is no air at all. Figure (28) shows the concentration of oxygen for various altitudes.
Figure (28) – Variation of Oxygen Concentration with Altitude
You can suck some oxygen from outside environment for low altitudes & definitely that will reduce some weight force (mass) of used LOX tank, but remember that outside air is contains only by Nitrogen (79%). It’s a waste of power for turbo-machinery to compress this nonsense element unless that we invent a gaseous filtration to take oxygen only & then compress it by turbo-pump alone without Nitrogen & other tiny gases (e.g. CO2 & water vapor especially in cloud location).
The propellant tanks when it be in full status, it consider the highest part of rocket
As we mention earlier in introduction section, the Saturn V rocket which is used by NASA between 1967 & 1973, was capable for carry payload mass of 140 Ton (SI Units) to Low Earth Orbit (LEO) compared with the fully fuelled mass of Saturn V rocket which was approximately 2950 Ton. So, the ratio of mass fraction of payload from total mass is 4.7%
The cost per launch for NASA Rocket “Saturn V” was $185 million in 1969–1971 ($1.16 billion in 2016 value) [web-3).
3) Payloads:
Payloads is only a general term for a body which we are interested to carry for our mission. Rocket are called vehicles as they carry payloads on it.
Rockets are carrying payloads (e.g. satellite & space shuttle as example ) on the top of rocket head.
Mainly, if the mission was for communication purposes, payload will be an artificial satellite if we want to put a communication device.
There are 3 famous orbit location for positioning an artificial satellite on it.
LEO: Low Earth Orbit(H: 200-3000 Km)
MEO: Medium Earth Orbit (H: 5,000-12,000 Km)
GEO: Geostationary Earth Orbit (H: 36,000 Km)
Figure (29) – Satellite’s Locations in Different Orbital Paths
Definitely, there are advantages & disadvantages for each orbit which be summarized in figure (30).
Figure (30) – Comparison of Earth’s Orbits
Sometimes, the mission maybe for discovering the space. So, the payload will be for space shuttle which must it have special self-impulse (propulsion) system after separation from last stage of rocket.
Figure (31) – Traveling cross Planets
\4) Exterior Part of Rocket:
Figure (32) –The British are coming for the Rocket Launching Industry
The body of rocket is like a protection shield for internal components from outside.
Also, the nose shape has a useful effect on decreasing/increase the drag force which always act on the front of rocket.
Cone nose are preferred choice in aerodynamic application as it has low value of drag coefficient. Definitely, the force drag are also has a direct proportional relationship with velocity of rocket. Figure (33) shows the drag coefficient for various shape.
Figure (33) – Drag Coefficient of Shapes
The exterior part may be separated depend on the stages number of rocket to rid of unnecessary mass. So, we will are saving some fuels compared if we still flight with empty tanks of previous stage.
I think next section will be very useful for engineers as we may talk about governed laws in rocket launch.
4. Physical Laws of Rocket Launch.
Figure (34) – Initial Launching for Falcon Heavy (SpaxeX – USA)
General Equation of Launch:
The Second & third Law of Newton are responsible of launching rockets to the space.
The 2nd law of Newton stated that:
When viewed from an inertial reference frame, the acceleration of an object is directly proportional to the net force acting on it and inversely proportional to its mass: [Ref-2]
Where :
F: is the force (vector)
m: mass of object (scalar)
a: acceleration of object (vector)
The 2nd law of Newton may be written by alternative way:
Where :
ΔV: change of object velocity (vector)
Δt: change of time (scalar)
The 3rd law of Newton is summarized as:
“If two objects interact, the force F exerted by object 1 on object 2 is equal in magnitude and opposite in direction to the force F exerted by object 2 on object 1: [Ref-2]
Know let us to know an important definition of what it called “momentum”
The linear momentum “p”of a particle or an object that can be modeled as a particle of mass m moving with a velocity v is defined to be the product of the mass and velocity of the particle [Ref-2]:
Where:
p: momentum of particle @ X-axis
In rocket, we are dealing with linear motion. “X” letter is denoted for x-axis.
The momentum conservation law has been derived from third law of Newton.
As two particle will have the same change of time ( Δt) before & after interaction (collision), so equation will be:
Where:
p1: X-Momentum of particle 1
p2: X-Momentum of particle 2
The last equation is called “ Law of Momentum Conservation ”.
Rockets & Accident of cars (crashing) are depend on the momentum change.
Figure (35) – Car Accidents is translation of Momentum Conservation
Now, Let us play with above equations to understand how rocket work exactly.
Suppose that we have this data for a specific type of rocket:
Data:
Total Mass of Rocket = 500 Ton.
Mass rate of exhaust gases = 600 Kg/s
Exit velocity from nozzle (escape velocity)= 11,2000 m/s ( 40,230 Km/h).
Altitude of LEO Orbit = 3000 Km
Required:
The Thrust (exerted force)
Time for reaching LEO position.
Assumption:
Initial velocity of gas = Zero
No drag force.
No atmospheric pressure.
Solution:
A) From second law of Newton , we will calculate the thrust force from the flow of exhaust gas:
B) In the rest situation), the momentum of each rocket & exhaust gas is zero (velocity is zero in both object before beginning). So the total momentum is Zero:
The symbol of 1 & 2 is represented to rocket & releasing gas respectively.
After launching (final), the total momentum will be conserved, but the the change will happen for each object as follows;
Now, divide both sides of equation by time:
The acceleration on rocket (heavy mass) will be 13.44 m/s2 .
By put that acceleration of rocket in one forms of 2nd law of Newton which give us the arriving time to LEO based on the height of flight. Equation (14) describe the result.
So, the arrival time was 11.4 minute for our rocket’s data.
The back pressure of nozzle is very important & there 3 situation which is described in figure (36).
Figure (36) – Under-Expanded, Over-Expanded, and Perfectly Expanded Nozzles
If we assume that back pressure is greater than atmospheric pressure , the thrust will be:
Figure (37) –Thrust Law of Rocket
Sometimes, the effect of pressure difference are small, so it may be canceled from our calculation.
The last important equation in gas thrust is called Specific Impulse which is stated mathematically as :
Figure (38) – Specific Impulse Definition
Actually I don’t know why it’s so important this term of specific impulse.
Frankly, I was totally lost when I was searching for references /article in my beginning of finding ideas for reducing fuel consumption related to that article.
Downloading many articles & references without any benefit until I found that article named as “ Liquid Propulsion Systems – Evolution & Advancements Launch Vehicle Propulsion & Systems – NASA, by/ Rick Ballard ” which the figure (38) & (39) has been taken from it .
Actually I was relaxed in that time & let me to understand why nozzle can have ability to move things upward against gravity & gases direction.
Figure (39) – Understanding the Thrust of Rocket
but………. That thrust equation was only special case which may applied for specific rockets design.
Anyway let us talking about something important related to downward force.
The total downward force (acting against the motion direction of rocket) are 2 forces;
The weight force.
The drag force.
Figure (40) – Negative Forces acting on Motion of Rocket
The weight force is obvious as it depend on the mass of rocket (m) according to the value of gravitational acceleration (g) which is change with altitude (h).
The drag force is expressed by following
Where:
f: drag coefficient & it depend on shape (non-dimension).
ρ: Density of air (Kg/m3)
A: frontal area of shape (m2)
V: speed of fluid (m/s)
Figure (41) shows the drag coefficient for various shape.
Figure (41) – Drag Coefficient of Some Shapes
So, the total downward force acting on rocket is:
There are an ideal equation of launching rockets which described the relationship between the required mass of fuel to the mass of payloads. The equation is show in figure (42) :
Figure (42) – Ideal Equation of Launching Rocket
Where:
∆V_R : The difference velocity between initial & final velocity of rocket in specific time.
V_1R : The initial velocity of rocket.
V_2R : The final velocity of rocket.
v_exh : The velocity of exhaust gases which coming as a result of fuel combustion.
m_P : The mass of payload.
m_f : Mass of fuel.
It’s called Tsiolkovsky Rocket Equation & its referred to Russian Scientist “ Konstantin E. Tsiolkovsky (B1857-D1935).
Today, it’s still remain the basis of all rocket dynamic.
General Case: Orbital & Escape Speed:
To let an object rotated continuously on specific radius of orbit, the centrifugal force of that object must be equal to the gravitational force of object’s weight. The speed of object which may achieve that condition called “Orbit Speed”.
The required equations for evaluating “Orbit Speed” that is shown in figure (43).
Figure (43) – Orbital Speed Equation
Where:
G: 6.672 X10⁻¹¹ N.Kg2/m2
R= 6.37×10⁶ M
Mass of Earth = 5.972X10^24
So, required Orbit speed for satellite as example must be 7,900 m/s (28,440 Km/h) .
There is another practical speed of rockets called “Escape Velocity”.
“ Escape velocity is the minimum speed needed for a free object to escape from the gravitational influence of a massive body.
The escape velocity from Earth is about 11.186 km/s (6.951 mi/s; 40,270 km/h; 36,700 ft/s; 25,020 mph; 21,744 kn) at the surface.
More generally, escape velocity is the speed at which the sum of an object’s kinetic energy and its gravitational potential energy is equal to Zero an object which has achieved escape velocity is neither on the surface, nor in a closed orbit (of any radius).
With escape velocity in a direction pointing away from the ground of a massive body, the object will move away from the body, slowing forever and approaching, but never reaching, zero speed. Once escape velocity is achieved, no further impulse need be applied for it to continue in its escape. In other words, if given escape velocity, the object will move away from the other body, continually slowing, and will asymptotically approach zero speed as the object’s distance approaches infinity, never to come back.
Speeds higher than escape velocity have a positive speed at infinity. Note that the minimum escape velocity assumes that there is no friction (e.g., atmospheric drag), which would increase the required instantaneous velocity to escape the gravitational influence, and that there will be no future sources of additional velocity (e.g., thrust), which would reduce the required instantaneous velocity. [web-7]
The value of escape velocity (V=11,200m/s)has been evaluated by using energy conservation law which we have assume that altitude is infinity (R=∞ ), so the potential energy will be zero.
For kinetic energy, we will assume it will be also Zero (velocity =0).
Figure (44) shows the result & how we evaluate the escape velocity.
Figure (44) – Escape Velocity Evaluation
Practical considerations:
In most situations it is impractical to achieve escape velocity almost instantly, because of the acceleration implied, and also because if there is an atmosphere, the hypersonic speeds involved (on Earth a speed of 11.2 km/s, or 40,320 km/h) would cause most objects to burn up due to aerodynamic heating or be torn apart by atmospheric drag.
For an actual escape orbit, a spacecraft will accelerate steadily out of the atmosphere until it reaches the escape velocity appropriate for its altitude (which will be less than on the surface). In many cases, the spacecraft may be first placed in a parking orbit (e.g. a low Earth orbit at 160–2,000 km) and then accelerated to the escape velocity at that altitude, which will be slightly lower (about 11.0 km/s at a low Earth orbit of 200 km). The required additional change in speed, however, is far less because the spacecraft already has significant orbital velocity (in low Earth orbit speed is approximately 7.8 km/s, or 28,080 km/h). [web-7]
I think these are important equations in rocket’s launch study.
Special Case: Multi-Stages of Rocket
Rockets may be have 2 or 3 stages depend on the mission of what we want to achieve.
The purpose of stages is to decrease the dry mass & unnecessary part of rocket when we don’t want to use it anymore like boosters & propellant tanks. This may happen by removing the parts from the body of rocket & let it fall.
Figures (45) to (51) shows how we separate each stages stage until we reach the targeted velocity which is required to orbital motion of satellite.
Figure (45) – Boosters & 1st Stage will fired both.
Figure (46) – Separation Boosters from Rocket due to consuming all fuel of it (make rocket less weight)
Figure (47) – 1st Stage will remain firing until reach specific speed
Figure (50) – Releasing the Payload from Rocket @ Speed 28,000 Km/h
Figure (51) – The Payload (Satellite) has been positioned in appropriate Orbit & expanded it is solar panels
Let us talking now about de Laval Nozzle & see how we can get high speed air with highly pressurized gas from combustion chamber.
Special Case: de Laval Nozzle
Figure (52) – Relationship Graph of Temperature, Pressure, Velocity & Mach Number for CD Nozzle
Figures (52) shows the basic laws & equation which are used for calculating the pressure, temperature, velocity, area & mach number for any part of Convergent-Divergent (CD) nozzle or it called alternatively “de Laval nozzle”.
Figure (53) – Thermodynamic Laws of CD Nozzle (1)
Figure (54) – Thermodynamic Laws of CD Nozzle (2)
Let us make an example for evaluating our previous equations.
Figure (55) shows a corresponding inlet, throat (critical) & exit values for all parameters.
Figure (55) – An Example of Applying Above Laws of CD Nozzle
As we mentioned earlier, there is a limit about the back pressure of exit nozzle which must be bit higher than atmospheric pressure (i.e. P=1 Bar). In our example, it has been assumed 16.5 KPa.
Increasing inlet pressure or maximum pressure of combustion chamber will definitely increase the thrust of nozzle, but we should consider other factors such as the size of turbo-pump which will be larger if we want to increase the pressure which is not practical for cost reasons.
Also, the temperature are a limitation to choose a specific properties of material (without forget the cost) to withstand the melting point.
In modern rocket engine they are using a which can be said a thermal exchanger for cooling the engine & increasing the temperature of liquid fuel by passing around nozzle before entering the combustion unit as we see in figure (56).
Now I will give my strange opinions according to what I have read & learned of how we got the thrust force.
Strange Emoticon
Opinion 1:
You may remember that I told you that thrust law was a special case for traditional rockets design.
The general form of the thrust equation which I think, is shown in figure (57) .
Figure (57) – General & Special Law of Thrust
Where :
P: Pressure @ Critical & Exit Point.
A; Area @ Critical & Exit Point.
V: Velocity @ Critical & Exit Point.
M: mass rate of exhaust gases (Kg/m3)
Now, I understand exactly why parameter of number 1,2,3 are cancelled from our general equation of thrust in control volume & I take a lot of times (almost weeks) with an idea which let me to figure this absent fact that I don’t know about it.
But ……………
Although It let me to open my minds by increasing my knowledge, and after that I ask myself if we can find a creative ideas to return those omitted parameters to be a real factor in calculating thrust.
Definitely, that’s mean we should design new rocket engine not based on reaction impulse.
Opinion 2:
If you notice about the general form, that maximum force may be in equation (18):
So, if we can make an index (IX) or utilization usage of force which has been used in specific type of nozzle , that will be great.
What I mean like equation (19).
Let us talking frankly.
If there is a part of original energy has been used for operating/impulse an object, so it should that loss energy has been gone with wind of atmosphere.
That’s my 2 thought/opinion/point of view. Maybe it’s right or wrong.
Let us go forward to next section to discuss why there are a specific location on earth for launching rockets..
5. Specifications of Launch Sites (Rocket Platforms).
Figure (59) – Launching Rocket from Sriharikota PTI, (India)
“ The term Rocket Launch Sites is used for any facility from which rockets are launched. It may contain one or more launch pads or suitable sites to mount a transportable launch pads.
Figure (60) – Cape Canaveral Air Force Launch Site (Multi), Florida State (US)
Its typically surrounded by a large safety area, often called Rocket Range or Missile Range. The range includes the area over which launched rockets are expected to fly, and within which some components of the rockets may land.
Figure (61) – Range of Launching Site for Launching Rocket
Tracking stations are sometimes located in the range to assess the progress of the launches.[Web-8]
Figure (62) –Tracking Data Station
There are many sites for launching rockets in the world as we see in figures (63) & (64) which are describe some known locations of launch.
Figure (63) – Map of Launch Site (1)
Figure (64) – Map of Launch Site (2)
Maybe you notice from above maps that concentration of launch sites are on equatorial range.
So, WHY ????!!!
Emoticon Question
“When a spacecraft is launched into orbit, it should end up spinning around the Earth quickly enough not to be pulled back in by the Earth’s gravity.
The huge rockets used in launching a spaceship help this to happen by giving a huge amount of thrust, enough to achieve escape velocity.
However, the spin of the Earth itself can help give it a push as well. Anything on the surface of the Earth at the equator is already moving at 1670 kilometers per hour. If a ship is launched from the equator it goes up into space, and it is also moving around the Earth at the same speed it was moving before launching. This is because of Inertia. This speed will help the spacecraft keep up a good enough speed to stay in orbit.
Why the equator?
Believe it or not, the surface of the Earth is traveling faster there. If you look at two spots on one line from pole to pole, one spot on the equator and the other halfway to the pole, each will make a complete revolution in 24 hours and return to where it was. But since the Earth’s shape is round, and the widest point is at the equator the spot on the equator would have to go more miles in that twenty four hours. That means that the land is moving faster at the equator than any other place on the surface of the Earth.
Figure (65) – Why Launching from Equator is better?
The land at the equator is moving 1670 km per hour, and land halfway to the pole is only moving 1180 km per hour, so launching from the equator makes the spacecraft move almost 500 km/hour faster once it is launched.” [web-9]
There is also some consideration rather than equatorial reasons (although it’s important factor) which may be summarized as:
Near the equator, to facilitate launches to geostationary orbit.
With an unpopulated area to the East of it, preferably the sea, to be safe against debris.
Not directly under any busy air traffic lines.
Somewhere where real estate is cheap.
Somewhere with easy access to a railroad network and a seaport. It helps if there is an existing airport or an air-force base.
Not far from a city big enough to cater for the sophisticated needs of the spaceport’s personnel.
Florida and French Guiana are indeed locations that fulfill those criteria. Other possible locations:
Places in Sumatra or Malaysia close to Singapore.
The coast of Kenya.
Costa Rica.
Belem, in Brazil.
Sao Tome and Principe (doubtful – see comments), or the coast of Ghana, in the gulf of Guinea.
The south of Sri Lanka, or Kerala, India. [web-10]
There is a slightly difference between phrase “Launch Site” & ”Space-port”.
Figure (66) – Imagination of Space-port in Future
“ A spaceport or cosmodrome is a site for launching (or receiving) spacecraft, by analogy to seaport for ships or airport for aircraft. The word spacecraft and even more so cosmodrome, has traditionally been used for sites capable of launching spacecraft into orbit around Earth or in interplanetary trajectories.
However, rocket launch sites for purely sub-orbital flights are sometimes called spaceports, as in recent years new & proposed sites for suborbital human flights have been frequently referred to or named “spaceport”.
Space stations and proposed future bases on the moon are sometimes called space ports, in particular if intended as a base of further journeys.” [web-8]
6. Reusable Rockets.
(Very innovative idea. I Liked It from my heart)
Figure (67) – Incredible Simultaneously Returning of Two Booster of Heavy Falcon Rocket to ground,2018, (SpaceX – US)
Making a rocket reusable (recycled by other words) is such exciting development in space era.
In the past, when we launch a rockets into space, it didn’t return it backs to the surface earth.
Why ???
Because the difficulties of overcoming the extreme high temperature & heating when a rockets entering the atmospheric field of earth similar to the meteors due to aero-friction (drag). The high velocities will compress the air particles strongly & quickly (Adiabatic status), which will lead to increase temperature simultaneously. The maximum temperature are estimated at around 2927 ⁰C (T= 5300 ⁰F = 3200 K).
But I think this value of temperature will be increased proportionally with increasing the speed of rockets.
Figure (68) – Asteroids burning when entering the Atmospheric Orbit
So, They left the rockets in the space rather than takes the option of burning it & reach populated area which is a risky.
“ The last efforts to make space travel reusable and more cost efficient were the shuttle programmes in the United States and Soviet Union, known as the Space Shuttle and the Buran respectively.
NASA’s five Space Shuttles are the best known; Columbus, Challenger, Discovery, Atlantis, and Endeavour were seen as the next big step in making space travel more affordable. The theory was similar to the self-landing rockets, in that each of the Space Shuttles could fly up to a low-earth orbit, drop off their payload, and then return to Earth, landing safely on a runway.
Figure (69) – Atlantis Spacecraft carried by Aircraft (NASA-US)
The only part of the Shuttle that would have to be replaced was its large external fuel tank. The Soviet Union’s Buran shuttle looked remarkably like NASA’s Space Shuttle. It only flew one unmanned mission before the Soviet Union collapsed and the project was cancelled.
Sadly none of the shuttle programmes were as effective as the developers had hoped. The cost of flying and repairing the shuttles dominated NASA’s whole budget.
Part of the extra cost came from the heat-resistant tiles that protected the Shuttle as it re-entered Earth’s atmosphere. After each landing, each of the Shuttle’s 35,000 tiles had to be individually checked for damage and replaced if need be. As each tile was specifically designed for a certain location on the shuttle, this made any replacements even more tedious.
The Soviet’s Buran shuttle is said to have been much more cost effective than the NASA shuttles, but after only one flight, it’s hard to know for sure” [web-11]
Figure (70) – Buran Shuttle on Big Plane Launcher (Russia)
But few years ago, everything has been changed by logical reasons & innovative minds.
Figure (71) – Lockheed Martin Largest-ever Heat Shield is installed on Orion (Lockheed Martin & NASA. US)
“ We can’t reuse the old design. He says. The engineers who created materials such as Apollo heat shield left documentation, but few of them are around anymore.
It’s like trying to make a cake from your grandmother’s recipe” he says. “She could leave you all the ingredients and all the steps, but you’re not going to make a cake as your good grandmother made.
There is not all. In the decades since Apollo missions, new materials, such as high-temperature ceramics, have been invented and some old materials have been improved. Other components used years ago, such as asbestos, were found to be toxic. For Orion’s shield NASA redeveloped Avcoat. A combination of fiberglass and high-tech plastics, that was used, in an earlier form, for Apollo’s heat shield’ [web-12]
A reusable launch system (RLS, or reusable launch vehicle, RLV) is a space launch system intended to allow for recovery of all or part of the system for later reuse. To date, several fully reusable sub-orbital systems and partially reusable orbital systems have been flown. However the design issues are extremely challenging and no fully reusable orbital launch system has yet been demonstrated.
A wide variety of system concepts have been proposed, and several are represented in those which have actually flown.
Figure (72) – Idea of Recovering the Engine Part of Rocket 1 (Airbus-France)
Figure (73) – Idea of Recovering the Engine Part of Rocket 2 (Airbus-France)
The first aircraft to attain sub-orbital flight was the North American X-15. The first reusable vehicle to reach orbit was NASA‘s Space Shuttle. It was intended to reduce launch costs below those of expendable launch systems, but instead ended up being more expensive. The last Shuttle was retired in 2011.
Following the announcement of the Ansari X Prize, commercial interest in reusable launchers has grown. The SpaceXFalcon 9 rocket has a reusable first stage and expendable second stage, and is currently in use for the NASA Commercial Orbital Transportation Services program and commercial satellite launches. Scaled Composites have flown two prototype sub-orbital spaceplanes for Virgin Galactic, while the Blue OriginNew Shepard rocket has recoverable first and second stages but is still in development and is only capable of suborbital flights. Several other reusable vehicles or whole systems are in development. [web-13]
There are 3 famous private companies which applying different technologies of reusable rockets. That’s wouldn’t be happen unless by considering the vital role of research & development (R&D) department in progress of space industry.
These private company are :
1) United Launch Alliance (ULA) – [Cooperation Business between: Lockheed Martin- Boeing Company]
MUOS-5 prior to launch. June 23, 2016
Figure (74) – Atlas V Rocket carried MUOS-5 Satellite @ Night (ULA-US)
“ Since the dawn of the space age, Rocket Science has been synonymous with innovation. United Launch Alliance (ULA) has revolutionized reliable, global space access with our Atlas V and Delta IV rockets.
The long history of innovation that resulted in these vehicles continues today at ULA as we invest in product line innovation to provide increased performance, additional capability and flexibility, and open up new and exciting markets.
At the core of innovation are the people involved. Enabling an innovation culture at ULA creates boundless opportunities for innovation throughout the enterprise. Focusing on the nearer term, our Vulcan booster incorporates numerous new technologies including Methane/Oxygen propulsion, efficient structures, and additive manufacturing to make launch services more affordable and accessible.
Next comes our newest upper stage known as ACES (Advanced Cryogenic Evolved Stage).
This revolutionary design will incorporate highly innovative concepts to generate power, provide tank pressurization and reaction control, and enable long term cryogenic commodities storage. The resulting capabilities significantly expand performance and mission duration from hours to days, even weeks and months. Future concepts for reusability, distributed lift, and on-orbit refueling enable growth in an entire Cis-Lunar Econoshere.
Exciting new markets for propellant (i.e. water) and material mining and solar power can become science fact instead of science fiction. This paper will explore a variety of the newest technologies being implemented on our next generation of launch systems. [Ref-3]
They have SMART Reuse technology.
Figure (75) – How Engine Part of Rocket become Heat Shield
SMART Reuse: ULA has constructed an innovative approach to reusing launch vehicle components we call Sensible Modular Autonomous Return Technology (SMART).
Our SMART approach focuses on recovering the most expensive part of any launch system, the rocket engine.
Much of the other components such as large structure are relatively inexpensive to produce but have a very large impact on performance with other approaches involving returning the entire booster.
Returning just the engine portion preserves performance by not requiring the system to use substantial propellant as part of the re-use approach. The cost of refurbishing components after high speed re-entry and exposure to salt water (in the case of a Shuttle SRBs) can also be substantial. The ULA approach mitigates these issues with a simple, yet inventive solution.6
Figure (76) – SMART Reusable System (ULA-US)
Our concept of operations starts when the 1st stage engine is detached after completion of that portion of flight.
Reentry is accomplished by utilizing the atmosphere to decelerate the engine via aerodynamic drag.
In conjunction with NASA, ULA’s method for aero-drag uses the Hypersonic Inflatable Aerodynamic Decelerator (HIAD) design.
The HIAD design is based primarily on an innovative inflatable structure that is densely packed during ascent then inflated exo-atmospherically to create a large heat shield for re-entry.
Soon after max deceleration, the HIAD is ejected and a parafoil is then deployed to slow descent further. The final step is for Mid-Air Recovery and return to ground. Utilizing a large helicopter, the parafoil and engine components are gently captured and returned to a precise location.
Each of these technologies have been tested in subscale and are mature and scaleable. This approach also benefits from limiting any major impacts of deceleration or salt water contamination.
Without going into extensive detail, the economics of this approach are much more appealing than other methodologies that significantly impact performance and cost. Looking even farther into the future, ULA has concepts for autonomous engine recovery which is similar in concept to this simple but innovative approach but will take further development. [Ref-3]
Figure (77) – Launching Rocket of Blue Origin (US)
On 23 November 2015, Blue Origin demonstrated the first successful flight and landing of a reusable rocket with the launch of its New Shepard spacecraft. The rocket reached a maximum altitude of just over 100 kilometers, detached from its payload.
Instead of crashing back down to Earth, the New Sheppard rocket was guided towards a landing pad where its engines were re-ignited, slowing it down to a hover above the ground, before finally completing a ‘soft landing’, completely intact.
Examination of the rocket afterwards showed that it was perfectly ready to fly again. This made it the first ever reusable spacecraft to cross the Kármán line (the official altitude where space begins, used by NASA) and land safely back onto the ground.
Since then Blue Origin has successfully launched and re-landed the same New Shepard rocket four times.[web-11]
The reusable technology named as “New Shepard” refereed to Alan Shepard , the first American go to space.
Figure (79) – Reusable Technology of Blue Origin Company (US)
It designed to take astronauts and research payloads past the Karman line – the internationally recognized boundary of pace.
The New Shepard system is a fully reusable, vertical takeoff, vertical landing (VTVL) space vehicle.
The system consists of a pressurized capsule atop a booster. The combined vehicles launch vertically, accelerating for approximately two and a half minutes, before the engine cuts off. The capsule then separates from the booster to coast quietly into space. After a few minutes of free fall, the booster performs an autonomously controlled rocket-powered vertical landing, while the capsule lands softly under parachutes, both ready to be used again.
Reusability allows us to fly the system again and again. With each flight, we’ll continuously improve the affordability of space exploration and research, opening space for all. [web-14]
Videos Link Blue-Origin Reusable Technology: [LINK]
3) SpaceX (Space Exploration Company)
Figure (80) – Launching of Heavy Falcon Rocket (SpaceX – US)
Figure (81) – Separation of Two Boosters of Falcon Heavy in the Orbit (SpaceX – US)
Figure (82) –Two Boosters were Returning Back to Earth (SpaceX – US)
But now SpaceX arguably has the more advanced programme, landing five reusable Falcon 9 rockets this year alone, sometimes on floating platforms in the sea.
The most impressive of these launches was earlier this year, on 14 August 2016. The Falcon 9 launched a Japanese communications satellite into a particularly difficult elliptical orbit, which meant that the re-entry speeds and temperatures were even more extreme during the rocket’s descent back to Earth. Despite these harsh conditions the rocket successfully landed on SpaceX’s floating platform in the middle of the Atlantic Ocean.
Sadly, less than a month later on 1 September 2016 all SpaceX Falcon 9 launches immediately ground to a halt following the huge explosion of one of the rockets on the launch pad while pre-launch testing was taking place.
The rocket and the 200 million US dollar payload were completely destroyed in the blast and for several weeks it was unknown exactly what had gone so wrong, casting serious doubts on the reliability of the Falcon 9 rockets. It was eventually confirmed that the explosion was due to a faulty interaction between the liquid helium bottles, carbon composites, and solidification of the liquid oxygen propellant.
With the launch planned for this Sunday, investors and commercial interests will undoubtedly be holding their breath, hoping that this sort of disaster does not re-occur. [web-11]
“The SpaceX reusable launch system development program is a privately funded program to develop a set of new technologies for an orbitallaunch system that may be reused many times in a manner similar to the reusability of aircraft. The company SpaceX is developing the technologies over a number of years to facilitate full and rapid reusability of space launch vehicles. The project’s long-term objectives include returning a launch vehicle first stage to the launch site in minutes and to return a second stage to the launch pad following orbital realignment with the launch site and atmospheric reentry in up to 24 hours. SpaceX’s long term goal is that both stages of their orbital launch vehicle will be designed to allow reuse a few hours after return.[1]
The program was publicly announced in 2011. SpaceX first achieved a successful landing and recovery of a first stage in December 2015. The first re-flight of a landed first stage occurred in March 2017[2] with the second occurring in June 2017, that one only five months after the maiden flight of the booster.[3] The third attempt occurred in October 2017 with the SES-11/EchoStar-105 mission. Second flights of refurbished first stages then became routine.
Several new technologies needed to be developed and tested to facilitate successful launch and recovery of both stages of the SpaceX reusable rocket launching system. Following the completion of the third high-altitude controlled-descent test, and the completion of the third low-altitude flight of the second-generation prototype test vehicle (plus eight flights of the first-generation Grasshopper prototype flight test vehicle), SpaceX indicated that they are now able to consistently “reenter from space at hypersonic velocity, restart main engines twice, deploy landing legs and touch down at near zero velocity.”[37]
The technologies that were developed for this program, some of which are still being refined, include:
Restartable ignition system for the first-stage booster.
New attitude control technology—for the booster stage and second stage.
Hypersonic grid fins were added to the booster test vehicle design.
Throttleable rocket engine technology.
Terminal guidance and landing capability,
Navigation sensor suite for precision landing.
Large floating landing platform.
Large-surface-area thermal protection system to absorb the heat load of deceleration of the second stage from orbital velocity to terminal velocity.
Lightweight, deployable landing gear for the booster stage. [web-15]
When aero-planes were first developed, it was private development and investment that drove flight prices down and down, first making planes affordable for the rich, and then readily available for everyone. The same thing may now be happening for space travel. Industrial competition is making the technology more efficient, driving down the prices, until eventually it may be readily available for the world. As it is, you can already pay a deposit to reserve your spot on a ‘Space Holiday’ with companies such as Virgin Galactic. While still very expensive, it proves that regular space tourism is on the horizon. [web-11]
In my point of view, even any reusable technology has advantages & disadvantages, the judgment is now not on the creativity of idea, but how it may lowering the launch cost with maintain the validity of material as long as possible for launching hundreds times .
7. Safety & Environmental Side Effect of Rocket Launch.
Safety Side:
Launching rockets must be in un-populated area to prevent any damages may happen if the rocket is exploded or fall down for any unexpected technical reason.
Figure (88) – Explosion of SpaceX’s Rocket in early Beginning of Starting A Company
That’s if the payload are material, so what’s the situation when the payload included humans (astronauts) ? It must be a protection system of space .crew
On 26th September 1983, there was an horrible accident of Soyuz rocket spaceflight (age of Soviet Union) in Baikonur (formerly known as Leninsk) in Kazakhstan.
Figure (89) – Soyuz TMA-9 Launch (Russia)
“Soyuz T-10a was unsuccessful Soyuz mission intended to visit the Salyut 7 space station, which was occupied by the Soyuz T-9 crew. However, it never finished it’s launch countdown: the launch vehicle was destroyed on the launch pad by fire on September 26, 1983.
Figure (90) – Explosion of Soyuz Rocket in 1983
The launch escape system of the Soyuz spacecraft fired two seconds before the launch vehicle exploded, saving the crew. It is the first case in which a launch escape has been fired with crew in board” [web-16]
Figure (91) – Two Cosmonauts has been Saved by Emergency Escape System
Figure (92) – Releasing Too much exhaust gases from Atlas V Rocket for Launching from Cape-Canaveral site
There are some article has been show the negative effect to our environment.
I choose 3 posts as it’s good for understanding the environmental issue which definitely may effect on climate change (global warming)
1) Dirty Rockets: What’s the environmental impact of going into space?
By Nina Rastogi (Writer & Editor – VP for content @ Figment)
Figure (93) –
We hear so much about the environmental impacts of transportation.
What about space travel?
How do rockets affect the atmosphere?
There’s a simple reason why we hear a lot more about cars, ships, and planes than we do about rocket ships: There are lot more of them. Each flight into space does have a small impact on the planet it leaves behind, but—for the moment, at least—these launchings are very rare. Only a couple of rockets blast off every week around the world. As a result, space travel doesn’t register on most environmentalists’ radars.
One issue that might deserve some attention has to do with the depletion of stratospheric ozone, a topic we discussed a few months back. Rocket engines emit reactive gases that cause ozone molecules to break apart.
They also discharge microscopic particles of soot and aluminum oxide, which may increase the rate at which those gases wreak havoc.
Each variety of rocket propellant delivers its own blend of ozone-depleting substances: Solid propellants, for example, are more damaging than liquid ones, though exactly how much is unclear. Engine design matters, too. To make matters worse, spacecraft dump some of these pollutants directly into the upper and middle stratosphere, where they can start causing damage immediately.
Despite all this, spacecraft contribute very little to the global ozone problem. In a recent paper on the topic, researcher Martin Ross and three co-authors estimated that rocket launches are responsible for roughly 1 percent of the total ozone depletion that can be attributed to human causes.
That percentage may rise, however, as more traditional pollutants, like CFCs, start to fade from the atmosphere (thanks to the 1987 Montreal Protocol). At the same time, the number of launches—for purposes of exploration, tourism, and space-based solar power (PDF)—is expected to increase.
One of the study’s co-authors has been quoted as saying, “If left unregulated, rocket launches by the year 2050 could result in more ozone destruction than was ever realized by CFCs.” ……Continue [Web-17]
2) Spaceflight Pollution: How Do Rocket Launches and Space Junk Affect Earth’s Atmosphere?
Nobody knows the extent to which rocket launches and re-entering space debris affect Earth’s atmosphere — but such ignorance could be remedied soon.
The issue of rocket emissions — which deliver gases and particles directly into the middle and upper atmosphere — will be included in a forthcoming United Nations 2018 Quadrennial Global Ozone Assessment that delves into the substances responsible for ozone depletion.
“The 2018 assessment is really the first one to have a substantial section on rocket emissions, not just a passing thought,” said Martin Ross, a lead author of the relevant section in the upcoming report. [The World’s Tallest Rockets: How They Stack Up]
“The climate impact of rockets has not really been seriously addressed as yet,” Ross, a senior project engineer for civil and commercial launch projects at The Aerospace Corporation in El Segundo, California, told Space.com.
“But with respect to ozone, we now understand that the climate and ozone impacts of rocket exhaust are completely intertwined. ……. Continue [web-18]
3) What is the environmental impact of the SpaceX Falcon Heavy launch?
By/ Dr. Ian Whittaker (Nottingham Trent University)
Figure (95) – Extreme Exhaust Gases Releasing from Heavy Falcon Rocket @ Launching (SpaceX – US)
From damaging the environment to contaminating the solar system, Space X’s successful launch of the Falcon Heavy rocket also poses risks.
SpaceX has now launched the most powerful spacecraft since the Apollo era – the Falcon Heavy rocket – setting the bar for future space launches. The most important thing about this reusable spacecraft is that it can carry a payload equivalent to sending five double-decker London buses into space – which will be invaluable for future manned space exploration or in sending bigger satellites into orbit.
Falcon Heavy essentially comprises three previously tested rockets strapped together to create one giant spacecraft. The launch drew massive international audiences – but while it was an amazing event to witness, there are some important potential drawbacks that must be considered as we assess the impact of this mission on space exploration.
But let’s start by looking at some of the many positives.
Falcon Heavy is capable of taking 68 tonnes of equipment into orbit close to the Earth. The current closest competitor is the Delta IV heavy which has a payload equivalent of 29 tonnes.
So Falcon Heavy represents a big step forward in delivering ever larger satellites or manned missions out to explore our solar system. For the purposes of colonizing Mars or the moon, this is a welcome and necessary development.
The launch itself, the views from the payload and the landing of the booster rockets can only be described as stunning.
The chosen payload was a Tesla Roadster vehicle belonging to Space X founder and CEO Elon Musk – with a dummy named “Star-man” sitting in the driver’s seat along with plenty of cameras.
This sort of launch spectacle gives a much needed public engagement boost to the space industry that has not been seen since the time of the space race in the 1960s.
8. The Economical Feasibility Study of Rocket Launch.
Figure (96) – Ariane Rocket in Launch Site (ESA – Europe Uniton)
On Tuesday 6th Feb 2018, SpaceX (Space Exploration Technologies) company has made an historic event by launching one of a powerful & operational rocket in the world.
Figure (97) – Launch Preparing of Falcon Heavy Rocket for First Time in 2018 (SpaceX – US)
It’s named as “Falcon Heavy” which can carry payload of 63.8 Ton of payload to Low Earth Orbit (LEO) by incredible launch cost of 90 Million USD per flight if rocket is reusable (Expendable cost 150 Million USD).
Figure (98) – Imagination Flight of Falcon Heavy Rocket (SpaceX – US)
It’s payload capability 2.7 times of space shuttle which may carry 24 Ton as we see in comparison in figure (97).
Figure (99) – Payload Comparison between Different Types of Rockets
“The success is a major step toward cheaper, more frequent spaceflight, making it easier for government and businesses to lift massive projects into space missions. SpaceX’s Falcon Heavy is estimated to cost $90m peer launch; NASA’s planned SLS rocket, a comparable system, is expected to cost about $1bn per flight” [web-20]
But that, won’t last long with my ideas in this article
Figures (99) to (101) shows some technical & economical specification of some famous rockets in the world. Maybe some of them are old data.
Figure (100) – Technical & Economic Comparison 1
Figure (101) – Technical & Economic Comparison 2
Figure (102) – Technical & Economic Comparison 3
Figure (103) shows a comparison of cost launch for many aerospace companies by simple concept.
Figure (103) – Simple Comparison of Launch Cost
In 2018, SpaceX company has been awarded global commercial launch by market share.
It’s obvious & expected as it has low cost of launching compared with other competitors.
If they still in progress in doing hard job with encourage the R&D field’s teams, in few years, they will take a control on aerospace market potential alone unless happen something unexpected for them by appearing new players in the beautiful space yard.
SpaceX company was colored by light blue color in bar graph of figure (104)
Figure (104) – Market Potential Share Distribution Columns of Launching Rocket Industry in the World
Let us make some fun calculation
Suppose that we have 2 companies “A” & “B”.
Company “A” claimed that launch cost of their rocket is 100 Million USD for payload of 10 Ton.
In contrast, company “B” claimed that cost will be 70 Million USD for the same payload.
So, let us analyze how they estimated it approximately & know why some people will prefer to deal with A company rather than B company (especially for long term contracts)
Strange isn’t ? We should choose company B, right ?
Company A Economical Analysis
In any feasibility economic study for any company or project, there are 4 elements which are forms the decision either ongoing forward or cancel the implementation of project. They are:
Fixed Cost.
Variable cost.
Sales (Launch Cost).
Net Profit.
Economical Figure (1)
There is an famous economical index named as Return on Investment (RoI) which is a performance measure used to evaluate the efficiency of an investment or compare the efficiency of a number of different investments. ROI tries to directly measure the amount of return on an particular investment, relative to the investment’s cost.
ROI may be calculated by ratio described in equation:
Company “A” said that the launch cost (sales ) will be 100 M USD. So, we have made approximation values for all parameters in feasibility economical study of company “A”& we got this summary:
Table A-1: Economical Summary of Normal Rockets “A”
The details of this result for company “A” are shown in economical tables (A-2) to (A-7).
Economical Table (A-2)
Economical Table (A-3)
Economical Table (A-4)
Economical Table (A-5)
Economical Table (A-6)
Economical Table (A-7)
You may notice that higher percentage of investment is going to the variable cost (58%) especially operational cost & staff salaries which were 36.3% & 35% respectively in respect to the total variable cost.
Now let us see what company “B” did to solve this economical issue with high cost for launching by reusing the same rockets several times.
Company B Economical Analysis:
In normal situation (without reusing), the high cost of rocket engine (2.5 Million USD) was mainly a problem as it must manufactured 12 times per year & that lead to be the yearly cost reach up to 360 Million USD.
Now by using some technology for returning back that rockets safely to the earth, there will be reduction on the operation cost of rockets.
We will assume that our reusable rockets will be used for 12 times before it becomes a scrap.
So, the economical summary of company “B” will be like what shown in economical table (B-1).
Economical Table (B-1)
The details of fixed & variable cost is shown in figures (B-2) to (B-7) with mentioning that change has been happen to the operation cost & Research & development costonly.
Economical Table (B2)
Economical Table (B-3)
Economical Table (B-4)
Economical Table (B-5)
Economical Table (B-6)
Economical Table (B-7)
The comparison between company “A” & “B” is shown in Economical table (AB).
Economical Table (AB)
The increasing percentage of profit has been reach up to 97%. That’s good news for CEO, owner & shareholders, but…..
Definitely few of this money will be invested more in the R&D section to improve & competite other aerospace companies.
Also, the maintenance may raise a lot as for reconnecting parts of reusable rockets & maintaining any technical troubles.
So, fixing & check the reusable rocket will take a long time & that’s one of the disadvantages of company “B”.
Why ??
When a client come to company “B”, definitely he/she will like to carry his payload quickly to utilize from low price of launching, but the customer service will told him to wait as there are another clients came before you & they (company B) made an schedule timeline which decide to carry your payload after 2 years.
Without mention that there are another factors may delay your request such as the availability of launching based on weather, air traffic & permission from local & military authority.
Also, the important issue is fixing our reusable rockets as soon as possible because without it, there is no mission. So, no profit.
There is a long wait-list.
Figure (105) – No Time for Waiting
You are upset as you don’t have any patients related to other future business related to your payload.
So, you decide to go to the Company “A” as they will offer you a launch in 2 month as they have several launch pads in the world.
Although you will pay much more money but that’s not comparing with personal profits that will gain when see your payload on orbit. So, you will be happy as the work will done perfectly in short time.
I don’t know what’s the fast process ?
Manufacturing new rockets (definitely company A will have many backup normal rockets as precaution plan if any client came up suddenly to not lose the clients due to waitlist issue).
Or
Fixing & check reusable rockets. (they also may have a backup reusable rockets, but the requests of launching is too much & there will be a waitlist)
Anyway, Company B has one solution to solve that issue of waitlist effect by utilizing from the advantage of higher value of Return On Investment (RO) to attract more investors & shareholders, but it wants time to constructing new factories & launch sites.
Figure (106) – New Rockets Factory of Blue Origin Company (US)
You notice that in operational cost, that percentage rocket engine cost item is really very high (85%) compared to the other part of rocket.
Maybe that the reason why United Launch Alliance (ULA) company prefer to regain the main engine rather that whole parts of rockets as it will cost less by using SMART innovative reusable technologies.
I think this made them very clever team in economical & engineering sideas they rid of from unimportant heavy part of rockets. The required Power of controlling falling object with of 3 Kg is surely not like deal with 3 Ton.
Figure (107) – Cycle of Launching & Returning Engine Part of Rocket to Earth (ULA – US)
We have done from this crucial section.
Now we will go to exciting section which will talking about my creative ideas to reduce fuel consumption & definitely the launch cost.
9. My Astonishing Ideas.
Figure (108) –The Innovation Power of Human Brain
Before I talk about my ideas which related to how reducing the consumption of rocket’s fuel, I would like to admit something.
Frankly, I feel that launching a small payloads by using huge amount of propellants (Liquid Oxygen + Fuel) is illogical decision & extremely stupid idea over the world as we will consume too much fuel which will decrease our energy resources day after day especially fossil fuel type.
Without forget how may the exhaust gases may effect on our beautiful environment & ozone layer in future if there are many companies intend to establish their own launch facility.
Figure (109) – Launching Rocket from Site
But, sometime we should choose the bad & worse decision if there are a great & good of our development of civilization. It’s matter of comparing with advantages & disadvantages with our options relate to human & environment.
Figure (110) – Spectacular View of Earth & Moon
Discovering the Secret of Earth’s Gravity (and planets) is one of my old ideas few years ago, which I was believing that if we know how earth pull down the objects towards it’s center, then we can build machine help us to release from this attraction force without need for burning massive of fuel.
Figure (111) – Traveling to Mars without Fuel, but Only by Anti-Gravity Technology
Scientist “Albert Einstein “ was predicted about existence of gravitational waves in 1916 & he didn’t think that we are able to detect such waves [Web-21] , and after 100 years later, scientific community announced in massive achievement of human ingenuity & patience, that they are detected these waves in 2016 by Laser Interferometer Gravitational-Wave Observatory (LIGO-NSF) lab.
Figure (112) – Gravitational Waves effect on other Planets
It’s a remarkable sign & incredible evidence of how Sci. Einstein was very very talent & unique person over the history of humankind after 100 years of his discovery without any experiment.
Figure (113) A computer simulation showing gravitational waves during a black-hole collision
When I heard that news in that moment of 2016, I knew that I will be close to discover the secret of gravitational force of earth one-day.
This will help us to overcome their downward force by unique technique & revolutionary technology which may be a unprecedented gate for new & exciting future of transpiration & space flight system . It’s matter of time to take care of it when I have a leisure time to read everything about that matter.
Finding an Powerful Anti-Gravity Technology (Not magnetic levitation) & everything in our world will change.
Figure (114) – Lifting Thing without Appear Force
Anyway, let us start our 1st idea in this amazing article.
Idea No.1 : Winged Head of Rocket (CFD Test)
Figure (115) – Winged Head of Rocket Idea
Purpose :
This idea is based on reducing the drag force of air due to high speed motion of air in respect to the rocket. As we know the pressure on head of rocket is high & that’s they (manufacturing of rocket’s body) make it as curved shape to decrease the coefficient of drag (cd) especially in very high speed up to 1000 m/s (3600 Km/h) according to equation :
** Usage Procedure (Mechanism):
Ti idea is very simple as we see in figure (116).
The air will enter the hole of cone (two upper & lower inclined lines) which may be named as wings & will exit from very small paths.
The pressure inside the cone will be high due to the lowering the velocity of air (area is wide). The outside of cone will be exposed to low pressure as the velocity is increased due to reduction of area.
The difference of high & low pressure on cone will produce a similar phenomenon of lift for plane’s wing but in our situation will be by acting forward (vertical force).
Figure (116) – Mechanism of Winged Head of Rocket
This lift-vertical force may reduce the drag force by little percentage.
*** Application:
Actually, drag force is not considered as big issue in aerospace industry for low velocities (less than 200 m/s) as it contributes to the total downward force is very little compared with the huge wet mass of rocket. Maybe 5% of total downward force, but in high speed above 500m/s, it’s crucial factor which can’t be ignored at all.
Figure (117) shows a data for a specific rocket for low & high speed rocket.
Figure (117) – Effect of Drag Force on Rocket Flight
Definitely, the speed of rocket will vary decently depend on many factors of design & thrust of engine.
I suppose, this idea may be used also in other application which has high drag force such as planes, submarines & ships.
Figure (118) – Applying Winged Head’s Idea on Many Applications
Now, Let us see what the opinion of CFD Simulation program “Fluent” about our 1st Idea.
We will make 2 case for our simulation comparison which are normal & winged head rocket.
Gambit & Fluent for 1st Idea
Case 1: Traditional Rocket Case
Suppose that we have this exterior design of rocket which made by Gambit program.
Figure (119) – Dimension of Traditional Rocket in Gambit Program
Figure (120) – Dimension of Air Tunnel in Gambit Program
Figure (121) – Meshing of Our Design by Gambit Program
Now, we will use simulation program “Fluent” to test numerically our design to see how much drag force will be exerted on the head of rocket when the velocity of air is 100m/s & according to those options in Fluent program which is shown in figures (122 ) to (126).
Figure (122) – Solver Option in Fluent Program
Figure (123) – Material, Operating Condition &Viscous Options in Fluent Program
Figure (124) – Inlet Boundary Option in Fluent Program
Figure (125) – Outlet Boundary Option in Fluent Program
Figure (126) – Residuals Option in Fluent Program
We should mention that air is assumed incompressible as Mach number of our situation is less than 0.3
Now let us see the results of our case.
Figure (127) – Plot Residual Result in Fluent Program
Figure (128) – Contours of Static Pressure in Fluent Program
Figure (129) – Contours of Velocity in Fluent Program
Figure (130) – Vectors of Velocity in Fluent Program
According to the Report Option of Forces, the X-Force is approximately 7600 N . The Coefficient of drag (Cd) equal to 1.38 on the rocket body (Evaluating by the turn on Monitor Force Option before starting Iteration) .
Figure (131) – Report Option of X-Force in Fluent Program
“r-hor” value has been canceled as we interest in the drag force on front part of rocket (i.e. r-core). It will not effect too much on our study.
Let us compare our unique design of winged head & see what it can affect on drag force.
Case 2: Winged Head of Rocket Case
The design on Gambit program is shown in figures (132).
Figure (132) – Winged Head of Rocket in Gambit Program
Figure (133) – Dimension of Winged Head part in Gambit Program
Figure (134) – Close View of Front side of Winged Head part in Gambit Program
Figure (135) – Dimension of Air Tunnel for Winged Head of Rocket in Gambit Program
Figure (136) – Meshing of Winged Head part by Gambit Program
We will do the same Options of Fluent program which we have applied to the case of traditional rocket.
Figure (137) – Options in Fluent Program for Idea No.1
Note: You maybe notice that operating pressure in second case was Zero.
Ok, I wasn’t aware of that when I test it early, but when I re-simulate the same case with 101.325 KPa, the result was same. So, it’s doesn’t make any difference.
The results of our new idea of winged head is shown in figures (138) to (143) .
Figure (138) – Plot Residual Result of Winged Head’s Idea in Fluent Program
Figure (139) – Contours of Static Pressure for Winged Head’s Idea in Fluent Program
Figure (140) – Contours of Static Pressure for Wing in Fluent Program
Figure (141) – Contours of Velocity for Winged Head’s Idea in Fluent Program
Figure (142) – Contours of Velocity for Wing in Fluent Program
Figure (143) – Vectors of Velocity for Winged Head’s Idea in Fluent Program
The X-Force of winged head of rocket is approximately = 5567 N & and the Coefficient of Drag (Cd) is 1.07
Figure (144) – Report Option of X-Force of Winged Head of Rocket in Fluent Program
The reduction of drag force was approximately 26%. (Recall, drag force on traditional rocket – case 1 – was 7600 N).
But, how much fuel consumption in rocket will be affected positively ?
See below comparison figure (145) to discover it & we will assume the Wet Mass of rocket was 500 ton & thrust of engine was 5000 N . (Assuming gravity is 9.81 m/s2)
Figure (145) – Fuel Usage Comparison between Traditional & Winged Head of Rocket
We have take approximately 2.3% from our fuel tank of normal rockets.
Rocket will be launched by 97.7% of fuel capacity than 100%.
That’s good, isn’t ??
Now, if we make the mass of rocket & thrust as constant, then we increase the speed of air, definitely the drag force will increase too.
So, I have made a 3 cases of CFD comparison for different values of air velocity as 50, 200 & 300 m/s & they give us approximately the same reduction percentage 26% of drag force.
The CFD comparison results of all 4 cases is shown in figure (146).
Figure (146) – Effect of Increasing the Velocity of Air on Drag Force
Note: We have assumed that velocity of air 200 & 300 m/s is considered as incompressible fluid situation & I know that’s wrong scientifically a it’s above Mach Number of 0.3 (if temperature of air is 300K),
But in our study of this article, it is only a matter of evidence to prove that Winged Head of Rocket may reduce the fuel consumption by somehow percentage.
We have end this idea No.1, so what’s our decision ??
The Technical Decision
Status of Idea No.1: Activated.
Reason; Applicable in Traditional Rocket.
Decision: Lab experiment must be done for evaluating the CFD simulation Results.
Idea No.2 : Curved de Laval Nozzle (CFD Test)
Figure (147) – Curved de Laval Nozzle’s Idea
*Purpose :
Idea No.2 is considering very strange idea because we will bend the traditional nozzle.
The aims of this method of bending, that it will give us more forces either in X or Y axis on the point of bending due to change of momentum similar to what happen in water pipe.
The velocity in nozzle’s exit will not change at all, but the thrust will increase dramatically because the bending effect. This additive force of X force or Y axis is responsible of thrust. We will explain this later in CFD part of this idea.
**Usage Procedure:
The idea is very simple as we see in figure (147). So, I don’t think I should give any explanation. Air comes from nozzle’s inlet will go out via the exit. It’s like flow of water inside bending pipe.
*** Application:
It can be used in any applications related to de Laval Nozzle. I don’t remember any application except rocket.
Now, our exciting simulation part
We will make 3 cases in our simulation comparison. They are Conic, Bell & Curved nozzle
Gambit & Fluent for 2nd Idea
Case 1: Conic Nozzle
Suppose that we have this design (figure – 148) of conic nozzle which made by Gambit program.
Figure (148) – Dimension of Conical Nozzle in Gambit Program
Figure (149) –Meshing of Conical Nozzle by Gambit Program
The maximum static pressure & temperature @ inlet of nozzle has been assumed as 1200 KPa,2273 K (2000 ⁰C) respectively. The velocity at inlet is 250 m/s.
So, the stagnation pressure & temperature are been calculated & found as 1258 KPa& 2304 K respectively.
The outlet pressure has been assumed as 16.5 KPa (In real life it must be 100 KPa but we can ignored that in our recent study as we want only to prove strange behavior of our ideas).
Now, we will use simulation program “Fluent” to test numerically our design to see how much thrust that we will got according to those options in fluent which is summarized in figures (150).
Figure (150) – Options in Fluent Program for Conical Nozzle
As you notice, we will use Density-Based solver as we are dealing with compressible flow.
Now let us see the result of our case.
Figure (151) – Plot Residual Result of Conical Nozzle in Fluent Program
Figure (152) – Contours of Static Pressure Conical Nozzle in Fluent Program
Figure (153) – Contours of Velocity Conical Nozzle in Fluent Program
The average static pressure @ inlet & exit are 1204.6 & 17.51 KPa respectively.
The average velocity @ exit was 1769 m/s & average mass flow rate is 528.7 Kg/s.
So, the thrust by definition of thrust law () will be T=m.V_exit=1769*528.7 = 935.3 KN.
We can also calculate thrust of conic nozzle in Fluent program from option [Report-Surface Integral-flow rate] of velocity and it gives us 944.7 KN.
It’s different slightly from our theoretical calculation. All these results are shown in figure (154)ز
Figure (154) – Report Option of Surface Integral Result for Conical Nozzle in Fluent Program
Now let us talking about new concept of thrust by finding the X-Force on the divergent part.
It will help us for to understand many thing related to Bell & Curved Nozzle
Special Analysis of Thrust
According to the Report Option for Forces, the X-Force on Convergent & Divergent wall part is approximately 777 KN & 209.7 N respectively.
The angle of hypotenuse side in divergent part was 10.9 Deg
Figure (155) – Report Option of Forces Result for Conical Nozzle in Fluent Program Now,
1) If we make the value of X–Force of convergent part is constant & change the angle of hypotenuse side of divergent side by assuming it’s is 10,20 & 30 Deg, what will be the result of Thrust (by neglecting the limitation of outlet pressure which must be above ambient pressure )?
So, the length of convergent part will be constant.
I have made 3 cases in CFD simulation program “Fluent” for angle of 10,20 & 30 Degree for the same inlet data in nozzle as we see in figures (156)
Figure (156) – Grid of 3 Cases of different Angles for Conical Nozzle in Fluent Program
The results was shown in table & graph in figures (157) & (158).
Figure (157) – Technical Comparison of Angel Effect on Thrust
Figure (158) – Curve Graph of Angle Effect on –Force & Thrust Value of Conical Nozzle
From these result, we notice that there are a direct proportional relationship between ‘Angle” & “Thrust” OR “X-force” values.
(
Now,
2) What’s the relationship between “Angle” & “X-force” on divergent wall when the outlet pressure is equivalent to ambient pressure (in our previous case, it’s value is 16.5 KPa rather than 100 KPa )
I have made 2 cases for angle of 10.31 & 20 Degree by increasing the length of divergent side from 7.5m to 15m exactly as we see in figure (159). The ambient pressure is 7.5 KPa.
Figure (159) – Grid of 2 Cases of different Angles for Conical Nozzle in Fluent Program
The result was shown an inverse relationship between “Angle” & “X-Force” as we see in figure (160) & we notice that thrust has not been changed too much which can be negligible.
Figure (160) – Technical Comparison & Curve Graph of Angle Effect for 2nd Conclusion
(((( So, what’s the explanation for what happen in both conclusion 1 & 2 ?? ))))
In Conclusion 1, we have this proportional relationship:
On the divergent part, there are a part of fluid (air) will touch the wall parallel as we see in figure (161).
An Static Average Pressure on wall will act in perpendicular direction on the wall & cause an X component of pressure on -Axis according to this equation;
Then, from equation (23), we get the X-Forces which can be evaluated by:
“t” & “C” are the depth & length of divergent wall either upper or lower. Definitely, there are 2 sides in divergent side, so the total X-force on divergent part will be:
Figure (161) – Evaluating X-Force for Conclusion One
Also, we know from our knowledge, that when we increase the thrust by lowering outlet pressure. The difference of throat & outlet pressure of divergent part in nozzle will increased & that’s why we have high thrust in vacuum.
You can accept that mathematical facts by saying:
“Thrust are represented by X-Force by some of delegation with respect to angle by some relationship ”
In Conclusion 2, we have this proportional relationship:
In constant value situation of outlet pressure, if we want to change the angle of hypotenuse side, we should change the length divergent part as we did in our previous simulation example of 10.31 & 20 degree as we see in figure (162).
Figure (162) – Technical Comparison & Curve Graph of Angle Effect for 2nd Conclusion
So, what’s the difference when we elongate the divergent part of de Laval nozzle ??
The issue is concerned with finding the length of hypotenuse for a given angle & that’s may be done by using below equations in figure (163):
Figure (163) – Evaluating X-Force for Conclusion 2
As you notice from last equation, there is no obvious relationship between “Angle” & “X-Force” , isn’t ??
Actually, there is a relationship but we don’t see it.
It’s the Average Pressure which is depend on the length of divergent part by solving this integral equations which explained how we got it in figure (164):
Figure (164) – Relationship Between Hypotenuse Length & Pressure on Divergent Part of Nozzle
Solving that partial differentiation equations will help us to replace “dC” by “dA” & “dθ”.
But that not all thing.
We should use compressible fluids laws to find the relationship between area “A” , angle “θ” with pressure “P” as shown in figure (165).
Figure (165) – Compressible Laws of Thermodynamic Science
Fortunately, Simulation program “Fluent” has a capability to make the graph relationship between static pressure on divergent wall & length via Plot Option.
Figure (166) – Curve Graph of Static Pressure on Divergent Part by Fluent Program
It’s very complicated to me & wants time to connect all variables in that partial differentiation & integral equations. The average pressure on figure (166) was 75.9 KPa.
Important Notation:
Remember, all results is based on making the convergent side force is constant to let conclusion 1 & 2 valid in any situation. Otherwise, everything must be changed.
Let us see what results of Bell nozzle case.
Case 2: Bell Nozzle
The design of Bell nozzle on Gambit program is shown in figures (167) & (168).
Figure (167) – Dimension of Bell Nozzle in Gambit Program
Figure (168) – Meshing of Bell Nozzle by Gambit Program
We will do the same Options of Fluent program which we have applied to the case 1 of conical nozzle in figure (150).
Figure (169) – Options in Fluent Program for Bell Nozzle
The results of simulation are shown in figures (170) to (173)
Figure (170) – Plot Residual Result in Fluent Program
Figure (171) – Contours of Static Pressure in Fluent Program
Figure (172) – Contours of Velocity in Fluent Program
The average static pressure @ inlet & exit are 1205.6 & 17.4 KPa respectively.
The average velocity @ exit of Bell nozzle was 1755.6 m/s & mass flow rate is 525 Kg/s.
(the difference of flow rate between Bell [525Kg/s] & conical [529Kg/s] nozzle is approximately 4 Kg/s which can be neglected )
So, the thrust by definition of law () will be T=m*V_exit=1755.6*525 = 921.7 KN.
We can also calculate thrust from Bell nozzle in Fluent program from option [Report-Surface Integral] as shown in figure (173) which gives us 917.8 KN. (Thrust of Conical nozzle = 944.4 KN)
Figure (173) – Report Option of Surface Integral Result for Bell Nozzle in Fluent Program
The value of thrust of Bell nozzle is less than conical nozzle although they have the same length of convergent & divergent part
Strange, isn’t ?
Because we know, that Bell nozzle gives us theoretically more thrust than Conical nozzle.
To understand what happen, we should return to our special analysis concept of thrust.
Special Analysis of Thrust between Bell & Conical Nozzle
The X-Force of Bell nozzle on Divergent Part according to Fluent program is approximately = 223 KN (Conical nozzle was 209.7 KN ) with the same static outlet pressure.
The X-Force of Bell nozzle on Convergent Part are approximately same with conical nozzle which is equal to 777 KN.
Figure (174) – Report Option of Forces Result for Bell Nozzle in Fluent Program
Now, we can use our conclusion One OR Two, because it’s valid in our situation
Why ?
Conclusion One is based on condition of remaining the length of convergent part as constant.
Conclusion Two is based on condition of remaining the height “B” of convergent part as constant.
Figure (175) – Conclusion 1 & 2 may be applied to Bell Nozzle
In Bell nozzle, both condition is true, so we can choose any conclusion as it will be suitable to deal with our case. I choose conclusion One.
Maybe you think in a moment that difference of between X-Force of Bell & Conical nozzle must be added to the total thrust of Bell nozzle which may be called “Imaginary Thrust”.
This idea is wrong, imaginary thrust of Bell nozzle (931 KN) is still less than conical nozzle which is equal (944 KN).
Also, to convince you, the X-force is depend on value of average pressure, not the difference of velocity.
Suppose that average pressure was 50 KPa, so the X-force as example will be 50 KN (by making area is 1m2).
Now, we have situation with average pressure 5000 KPa, definitely the X–Force will be 5000 KN, without changing the difference of velocity in both situation like what happen in water pipeline (I know it’s incompressible matter).
Figure (176) – Adding Process is not true for conclusion 1 & 2
It’s not logic of comparison between both situation by adding process/procedure only
So, how we will find the imaginary thrust of Bell nozzle which may be greater than Conical nozzle ??
The Answer: It’s by proportional relationship.
If you remember the graphs of relationship between “Angle” with “X-Force” & “Thrust” by neglecting the effect of outlet pressure as we see in figure (177).
Figure (177) – Curve Graph of Angle Effect on –Force & Thrust Value of Conical Nozzle
Assume that our relationship of these graphs are linear.
So, the proportional relationship between “Thrust” &”X-Force” will be like this:
The imaginary thrust of Bell nozzle will be after replacing the suitable values, we will get:
Now, this the value of Bell nozzle which anybody may accept it.
The imaginary thrust of Bell nozzle (1004 KN) is greater than Conical nozzle (944.4 KN)
End,
Let Us Move To Next Exciting Case
Case 3: Curved Nozzle
The design Curved nozzle on Gambit program is shown in figures (178) & (179).
Figure (178) – Dimension of Curved Nozzle in Gambit Program
Figure (179) – Meshing of Curved Nozzle by Gambit Program
We will do the same Options of Fluent program for Curved Nozzle which we have applied to the case 1 of conical nozzle in figure (150).
Figure (180) – Options in Fluent Program for Curved Nozzle
The results of simulation are shown in figures (181) to (182).
Figure (181) – Plot Residual Result in Fluent Program
Figure (182) – Contours of Static Pressure in Fluent Program
Figure (183) – Contours of Velocity in Fluent Program
The average static pressure @ inlet & exit are 1209.7 & 22.3 KPa respectively.
The average velocity @ exit of Curved nozzle was 1739.6 m/s & mass flow rate is 507 Kg/s. So, the thrust by definition of law () will be T=m*V_exit=1739.6*507 = 882 KN.
(We will talking about why flow rate is low later)
We can also calculate thrust from Curved nozzle in Fluent program from option [Report-Surface Integral] as shown in figure (184) which gives us 852.3 KN.
Figure (184) – Report Option of Surface Integral Result for Curved Nozzle in Fluent Program
Thrust of Conical & Bell nozzle are944.4 & 917.8 KN respectively.
Figure (185) shows a real values depend on data Fluent for all types of nozzle for idea No.2 based on real thrust law.
Figure (185) – Result Summary of Idea No.2 based on Real Thrust Law
forget all these results
&
let us play with our special analysis
of imaginary thrust for Curved nozzle.
[[[ Special Analysis of Curved Nozzle ]]]]
There are 2 forces will be exerted due to bending of nozzle in X & Y axis as we see in figure (186).
Figure (186) – Forces acted on Curved Nozzle
So, let us examine each axis separately with mention that X-force on convergent side (Left Side) is approximately 789 KN which can be acceptance to apply our conclusion No.1 & 2.
Also, the length of curved paths in divergent part may be considered as 7.5m (review the above dimension figure [178]) to apply our conclusion One of imaginary thrust.
1) Special Analysis in X-Axis
The X-Force of curved nozzle on divergent part is approximately = 359.5 KN
Figure (187) – Report Option of X-Forces Result for Curved Nozzle in Fluent Program
Note: Convergent force is approximately equal to conical & bell Nozzle, so conclusion 1 is valid.
So, by applying our proportional relationship of imaginary thrust in X-axis, we will find:
Figure shows the comparison result with the expected fuel consumption of rockets by applying this creative idea No.2.
Figure (188) – Results Summary by Applying X-Imaginary Thrust Concept
The X-imaginary thrust will help us to use only 60% of normal propellants (fuel + oxidizer) tanks in ordinary rockets.
2) Special Analysis in Y-Axis
The Y-Force of curved nozzle on divergent part is approximately = 822.7 KN
Figure (189) – Report Option of Y-Forces Result for Curved Nozzle in Fluent Program
So, by applying our proportional relationship of imaginary thrust in Y-axis, we will find:
Figure shows the comparison result with the expected fuel consumption of rackets by applying this creative idea.
Figure (190) – Results Summary by Applying Y-Imaginary Thrust Concept
The Y-Imaginary Thrust will help us to use only 26% of normal propellants (fuel + oxidizer) tanks in ordinary rockets.
To utilize form X&Y-force advantages of imagination thrust, the nozzles must be positioned like what we see in figure (191) & it should be 2 to cancel the effect of X or Y force.
Figure (191) – Positions of X or Y imagination Thrust for Curved Nozzle
I feeling there is still some question ringing in your mind quickly.
Q1 – Why I choose conical nozzle as standard shape for evaluating imaginary thrust (if we accept this term).
A1 – Actually, question One, I don’t have an obvious answer for it, but I considered conical shape as a logic or engineering feeling sense.
Let us thinking logically, if the force on convergent side is constant, so it must there are a relationship between thrust depend on exit’s velocity & the average pressure which is acting on the wall of divergent part.
As I said previously, the value of average pressure may be independent from the value of exit’s velocity.
In our example of conical & bell nozzle, the difference of X-force was (Δf = 223-209=14 KN ), so compared to the thrust force of conical nozzle (T=944.4 KN), it too small & maybe that’s why we ignored in our study the effect average pressure or it may be named as “Surface Force” which acting perpendicularly on wall similar to the lift force of wing.”
Q2 – Why flow rate of curved nozzle [504 Kg/s] is so far from similar flow rate of Conical & Bell nozzle [528 Kg/s]
A2 – “ I don’t have an answer for that but maybe it’s matter of increasing the number of iteration in simulation program “Fluent” until reach to specific value, but, I don’t think it will change something big in the value of X & Y force in the bending point.
Or, if you notice that average velocity at inlet of conical, bell & curved nozzle were 237m/s, 228 m/s & 208 m/s (although the initial parameters of velocity was 250 m/s in Fluent calculation. The inlet area are same for all types of nozzles.”
Q3 – Why you use special analysis in Y-axis of curved nozzle although there is not Y-force on conical type ?
OK
A3 – “I don’t know, it comes in my mind like pulse or you can say by an engineering sense.
You can imagine the conical nozzle is rotated 90 degree, so it will be located vertically & definitely there is no X–force in that new position.
Did I answer your nice question or not yet ??
There one problem with this idea that curved nozzle can’t be operated with combustion unit of rocket engine for a reason I prefer not to disclose it publically because I have intention to design a combustion unit which may fit with this idea.’
If you don’t know the reason, you will not capable of designing the new combustion unit at all.
Remember for 3rd time,
The ConclusionOne & Two which was the basis of my special analysis of imaginary thrust, will not be valid if the Convergent part (Left side) of the nozzle of our study interest has considerable value of force differ from standard value of conical nozzle.
We have end this idea No.2, so what’s our decision ??
The Technical Decision of Idea No.2
Status of Idea No.2: Deactivated (Will not Work)
Reason; Due to indirect factor (traditional combustion unit must be changed)
Decision: Temporarily suspension until we solve the problem.
If you don’t like to read about strange & illogical & unproved idea of changing like No.2 because I have change on the nozzle shape, so maybe the next idea will accept to your mind
Idea No.3 : Dual Vertical Nozzles (CFD Test)
Figure (192) – Dual Vertical Nozzle’s Idea
Purpose :
Idea No.3 is depend on utilizing from the high pressure coming from combustion unit initially before going to nozzle unit as we see in figure (192).
The bending point of pipe will help us to gain a huge X-Force which may move the rocket in positive direction of X-axis in contrast of what rockets do in real life.
** Usage Procedure (Mechanism):
When air (or exhaust gases if you dealing with combustion unit) is coming from high pressure zone (i.e. combustion unit), it will be separated into two paths for a reason that I will keep it hide from public now.
The deflection flow air in one of path, will change it is momentum (change in velocity vector), which may lead to acted on the curved wall by high pressure in X & Y axis of bending point.
This high pressure (or high force) is responsible of the motion of rocket in direction of X-force.
The only purpose of 2 nozzle is to eject the exhaust gases @ the pressure of atmospheric ambient (P=1 Bar).
*** Application:
It can be used in any applications related to de Laval Nozzle. I don’t remember any application except rocket.
Now, our exciting simulation part.
In our study, we may draw & simulate the “Elongated Pipe” part only as it has the ability to gain more force rather than vertical nozzle which are used only for release the air at ambient pressure to outside.
We will compare our result of elongated pipe with Conical & Bell nozzle from previous data which have been discussed in idea No.2.
(I promise, there is NO strange concept like “Imaginary Thrust” in this idea).
Eamoticon
Gambit & Fluent for 3rd Idea
Case 1: Dual Vertical Nozzle
Suppose that we have this design of dual vertical nozzles which made by Gambit program as we see in figure (193).
Figure (193) – Dimension of Elongated Pipe in Gambit Program
Figure (194) – Meshing of Elongated Pipe by Gambit Program
We didn’t draw the nozzles because it doesn’t have any valuable effect on thrust. So, we canceled & also it will help us to avoid dealing with compressible situation in simulation program “Fluent”.
The maximum static pressure & temperature @ inlet of nozzle has been assumed as 1200 KPa & 2273 K (2000 ⁰C) respectively. The velocity at inlet is 250 m/s. It’s the same values of inlet in conical & bell nozzle)
The gas constant of air “R” is 0.287 KJ/Kg.K & heat ratio “ϒ” will be 1.4
So, the speed of sound for our inlet data based on above given information is 955.7 m/s.
Then, the Mach Number (Ma) is 0.26 which will allow us to deal with fluid (air) as incompressible fluid in the “Elongated Pipe” by Fluent program because it is less than limit of 0.3
No stagnation pressure or temperature. I feel relax for that matter for doing easy simulation in Fluent.
Now, we will use simulation program “Fluent” to test numerically our design of “Dual Vertical Nozzles “ to see how much thrust that we will got according to those options in fluent which is shown in figures (195) .
Figure (195) – Options of Fluent Program for Idea No.3
As you notice, we will use Pressure-Based solver as we are dealing with incompressible flow.
The value of density & viscosity was taken from previous data of conical nozzle @ inlet.
Now let us see the results of our case by simulation.
Figure (196) – Plot Residual Result in Fluent Program
Figure (197) – Contours of Static Pressure in Fluent Program
Figure (198) – Contours of Velocity in Fluent Program
The average velocity, pressure @ inlet & exit is shown in figure (199).
The mass flow rate is 540 Kg/s. (In conical nozzle it was 529 Kg/s, it’s not big difference which must be considered).
Figure (199) – Average Values for Elongated Pipe in Fluent Program
Now let us find our impulse force.
The X-Force of Dual Vertical Nozzle idea is 1592.4 KN as shown in figure (200).
Figure (200) – X-Force on Elongated Pipe in Fluent
Figure (201) shows the comparison between our recent result with Conical & Bell nozzle. The expected fuel consumption has been added.
Figure (201) – Comparison between Conical & Bell Nozzle with Dual Vertical Nozzles
As you see, in our comparison, the required propellants (fuel + oxidizer) tanks may reduce low up to 62%.
That’s great, isn’t ?
There is another auxiliary idea come up from idea No.3 may increase the X-Force which can make the fuel consumption reach to 38%.
This auxiliary (branch) idea is based on making the nozzles in horizontal position similar to what we see in figure (202).
Figure (202) – The Auxiliary Idea of Dual Vertical Nozzles
Anyway, either the original idea No.3 or this auxiliary (branch) idea, it stills remain one problem which I don’t study it yet related with the design of combustion unitof rocket engine.
So, maybe in future I will figure out how I solve the combustion unit issue.
We have end this idea No.3, so what’s our decision ??
The Technical Decision of Idea No.3
Status of Idea No.3: Deactivated (Will not Work)
Reason; Due to indirect factor (traditional combustion unit must be changed)
Decision: Temporarily suspension until we solve the problem
Lets talking seriously if you don’t like imagination of above ideas especially 2 & 3
Idea No.4 : Secret Rocket Engine (CFD Test)
*Purpose :
All what I can say about Idea No.4, that we will increase the thrust of straight de Laval nozzle by using a special device which may help us to do add it’s net force to the total thrust by equation showed in figure (203):
Figure (203) – Components of Secret Rocket Engine
**Usage Procedure:
(Secret)
***Applications:
(secret)
The advantages of this idea that it will be operated with traditional combustion unit of rockets, in opposite of idea No.2 & 3 which they are impossible to be applied normally unless we change the design of combustion unit.
Now, our exciting simulation part.
Definitely, I can’t give any detail of our simulation for special device results except a few data related to force values to keep the secrecy of what I take long time & made great effort to reach it.
I have only simulate the special device because the results of conical or bell nozzle is known & we have evaluated it previously.
Figure (204) – Force Report of Special Device on Fluent Program
You notice from figure (204) that net force of special device is 3,933 KN.
Ok, that;’s not true as we should add something else to our calculation.
The Total Net Force of special device has been found from data in Fluent program with applying Newton’s Laws.
We should subtract that value of Fluent data of force report by 3,634 KN.
Why that’s specific value?
It’s my secret detail& it change depend on the conditions of rocket
Emoticon
The total net force on special device will be [Ftot_net = 3,933 – 3,634 =299 KN ]
we know from previous data of conical nozzle that it has thrust of 944 KN.
So, the total thrust force on secret rocket engine by applying equation of figure (204) will be 1243 KN.
Figure (205) shows the technical comparison between conical nozzle & secret idea.
Although we have put the parameter, but there is a little difference in the value of flow rate. [Percentage of Error: 7.5%] .
We notice that using a combination of special device & conical nozzle, will reduce the fuel consumption down to 76%.
***####***
Do you remember the feasibility economical study section for evaluating the cost of rocket launch ?!!
Let us see how this idea may affect positively in the cost of engine.
If you remember, the single engine has been assumed that it has thrust of 1000 KN & it cost approximately 2.5 million USD.
In that economical study, we said that we want12 engine to do the mission.
So, the total thrust is 12 MN with total cost 30 Million USD.
By applying our secret idea No.4, the required number of engine will reduce from 12 to 9.14 as the percentage of fuel consumption was 76%.
So, the cost of engine will be 22.86 Million USD rather than pay 30 Million USD (savings per launch : 7.14 million USD)
If the number of launches per year was 12 as we stated in previous economical study, we will save about 85.7 Million USD.
Great for owners & shareholders, isn’t ?
Figure (206) – Increasing of Economical Arrow of Profit in Graph
Audience Questions of Secret Idea No.4
Businessman and businesswoman raise their hands while sitting at a business conference. Horizontal shot.
Figure (207) – Audience Raising Hands for Asking The Speaker
Audience: You forget something so important ?
Me: What is it ?
Audience: What’s the cost of special device? You don’t mention it & added it in your economical study?
Me: Good question, I have dropped it out from my study.
Audience: Why ?
Me: Because the cost of special device is very & very cheap.
Audience: How much cheap?
Me: For maximum limit price which will not exceeded, the cost will be less than 5000 USD ?
Audience: You’re definitely kidding with us, only 5000 USD to save 7.1 million USD ??!!
Me: It’s worth & big shot, isn’t ?
And I will tell you something more.
Audience: Surprise me more, you are amazing engineer.
Me: The special device can be multiplied many times ?
Audience: What you are meaning?
Me: We can put many special device units as we like but it depends on the size of application (rocket volume) ?
If we can put 10 units of special device, the thrust will increase & decrease the cost dramatically to unbelievable value as we see in figure (208).
Figure (208) – Multi-Unit of Special Device will make difference
Audience: How much of 10 units of special device may save money?
Me: 10 units with One nozzle, can save us (company) about to 22.7 million USD per launch
& 272.7 Million USD per year if the number of launch was 12.
Audience: You are great & innovative talent scientist. Your mind works like floods of ideas which can’t stop. Good luck & I’m sure that you will have a great future in progress of science & technology
(funny story of finding idea number 4 in “My Last Words” section after this section & conclusion section
Small comment from strange person in my LinkedIn account about mu shared ideas before publishing this article was the main reason for find this creative idea)
Lucky me. That’s the power of professional & social network
We have end idea No.4, so what’s our decision ??
The Technical Decision of Idea No.4 (Secret)
Status of Idea No.4: Activated
Reason; Applicable on Traditional Rocket .
Decision: lab experiment must be done for evaluation CFD Results.
The next ideas are based on merging many recent or future technologies to help us to launch rocket with lower cost.
So, It’s only explaining photos (No CFD simulation results at all)
Idea No.5 : Propellants Tower Technology
In 2016, I have wrote in my old & first article of “Rockets Launch: Creative Ideas To Reduce Fuel Consumption “ [web-1] that there company wants to build a tall tower for launching rockets.
“Recently, There are a Canadian company called “ ThothX ” & they intend to build a long tower. It will be as space launch platform. It’s not a full space elevator, but 20 Km tall, inflatable tubular tower structure 230 m in diameter using elevators to transfer up & down to the stratospheric platform where rocket launch vehicle would land, refuel , load and launch from to reach and return from orbit. Its projected that a launch from the top of the tower would save 30% of the fuel needed to reach orbit. From the top of the tower, the horizon would be 1000 Km away”.
Figure (209) – Sketch Design of Tower Technology of ThothX Company
I think it’s very expensive project but definitely it will decrease considerable amount of fuel tanks when we launching from high places.
The idea No.5 of Propellants Tower Technology maybe less cost compared with ThothX project as we see in figure (210).
It’s based build a tall tower but with less diameter (i.e. D=10m) for putting a large oxidizers & fuel (propellants) tanks on it rather than very large diameter of ThothX’s which was assumed 230 m.
There will be a 2 long hoses connected with fuel & oxidizer tanks & the rockets on the ground which like to launch it. The gravity of earth will help us to pump it to the rockets.
There will be a short metallic hose connected with rockets to withstand the high temperature of exhaust gases if we intend to position the hose near the rocket engine. It’s safety procedure matter for tower.
Figure (210) – Components of Propellants Tower Technology
The philosophy of idea is based on the argument that mass of propellants is the main factor of downward force, so why we don’t put that propellants tanks on high places only rather than in rocket ??
We will use too much pumps for fuel & compressors for oxidizers on that tower to transport fuel from ground to the roof of tower.
We can utilize from solar or wind energy technologies to generate electricity to that pumps.
Figure (211) – Using Renewable Energies to deliver Propellants to specific height on Tower
Idea No.6 : Aerial Refueling Technology for Rockets
Foe any structural reason related to Propellants Tower Technology, this idea may be suitable as it’s applied successfully.
In long special flight trip or military aircrafts, they need more fuel which it’s tank is not sufficient for the trip/mission.
So, scientists & engineers invented the technology of aerial refueling system for planes as we see in below figures.
carrier based aircraft Lovely Carrier Based Aerial Refueling System CBARS History
Figure (212) – Lovely Carrier based Aerial Refueling System CBARS history
Figure (213) – Iran Disguises its Refuelers as Civilian Aircraft
Figure (214) – Boeing KC-46A Pegasus
RANDOLPH AIR FORCE BASE, Texas — An Air Force Special Operations Command HC-130P refuels HH-60 Pave Hawk helicopters in the skies over southern Louisiana. Air Force search and rescue crews have been searching for Hurricane Rita survivors. Its in-flight refueling capability allows the helicopter crews to continue search and rescue missions for several hours. (U.S. Air Force photo by Tech. Sgt. Rob Jensen)
Figure (215) – Helicopter Aerial Refueling System
We will do the same concept but for rockets as we see in figure (216).
The fuel-carrier planes will rotated on rockets in circular path. So, the rocket will be the center of circle.
Figure (216) – Aerial Refueling System for Rockets
Definitely, the safety procedure related to metallic hose in rocket which have been discussed in previous idea will be important.
The radius between plane & rocket is also very important. The distance must be long as possible to prevent unexpected explosion of planes by let rocket hit it.
So, why are we using planes ?
Simple. Nobody doubt how important the vital role of wings in aviation industry. Wings helps us to decrease the total weight of plane by utilizing from natural phenomenon of Lift force. So, we will do the same but for propellants tanks.
Figure (217) – Plane in Sky
There are some planes were carried the shuttle and rockets for high altitude as we see in figure (218). It’s good idea but it required us to make a new design for planes without mention that drag force on planes will change totally & slow down the speed of planes.
Figure (219) – Buran Spacecraft Launcher Big Plane – [Russia]
Figure (220) – S3 Spacecraft Launcher Plane – (Swiss Space System – Switzerland)
Idea No.7 : Wireless Electricity Technology for Rockets
I can’t say this idea of rocket will be like traditional rocket design that we know & see in our daily life.
The purpose of electricity is to operate the units of electrical compressor to push us up similar to the helicopter, but with powerful thrust engines.
Definitely there a limitation with electrical compressor especially the size, but it will help for small payloads.
Figure (221) – Wireless Electricity Technology for Rockets
There are a development technology of electrical transmission which used either Microwaves or LASER beaming. It’s called generally “Wireless Power Transmission”.
Figure (222) – Experiment of Transmission Electricity by Laser
“Japanese scientist have succeeded in transmitting energy wirelessly, in a key step that could one day make solar power generation in space a possibility. Researchers used microwaves to deliver 1.8 Kilo-Watts of power – enough to run an electric kettle – through the air with pinpoint accuracy to a receiver 55 meters (170 feet) away”.
We can utilize from solar or wind energy farms technologies to generate electricity for supplying continuously the required electricity for launching rockets initially, then we switch to the fuel option in high altitude.
Offshore-Windpark Global Tech I in der Nordsee Global Tech I offshore wind farm in the North Sea Anlagen/turbines: 80 x Adwen AD 5-116 13.8.2015 (c) Foto: Adwen / Jan Oelker , 2015 jan.oelker@gmx.de
Figure (223) – Wind Energy Farm on Sea
Anyway, this idea maybe take a long time due to the low distance of power transmission (55m).
Idea No.8 : Space Elevator Technology for Rocket
In 2016, I have mentioned in that article of “Rockets Launch: Creative Ideas To Reduce Fuel Consumption “ [LINK-] an idea of space elevator but it based on making a big buoyant station be attached to much helium balloons.
Now, I figure out another exciting idea which I believe it will work like magic.
Suppose that there are 2 planet which have the same gravity & we have put a 2 space elevator on the path of 2 planets as we see in figure (224). Elevator are connected with strong rope (e.g. Nana-Carbon material as example).
Figure (224) – Space Elevator based on Gravity of Two Planets
Because both sides of elevator is subjected to the same gravity, so the elevator is in balance status.(Newton’s First Law)
So, Small force either on planet 1 or 2, will let this amazing system of space elevator to move.
Now, in actual life, maybe we can’t find this 2 planet in any planetary systems, but we can create the same scientific concept by putting a big space craft out the earth’s orbit as we see in figure (225).
Figure (225) – Space Elevator Technology for Rocket
The big spacecrafts (spaceship) will move by using the space propulsion/solar sailing systems & it must be very powerful to pull the space elevator with payloads & small rocket.
Figure (226) – Solar Sailing System
“ NASA is hard at work developing what they believe is the best space engine for future missions to Mars and beyond. It’s not wrap drive. No, nothing so exotic or dreamy. In fact, it already exists. The challenge is to enhance it for our needs in space in the coming decades. That is the hope, and the goal, of NASA’s continuing development of solar electric propulsion (SEP).
Figure (227) – Solar Electric Propulsion (SEP) [NASA-US)
Solar electric propulsion uses electricity generated from solar arrays to ionize atoms of the propellant Xenon. These ions are then expelled by a strong electric field out the back of the spacecraft, producing thrust. So, in short, SEP is a propulsion system that is a combination, or coupling of solar array technology and ion thruster technology.” [web-23]
In returning trip of space elevator to the ground, the power of spacecraft will turn off & in the elevator we will turn on special systems of landing (similar to reusable rockets technology) as we should consider the air drag (aero-friction) when anything enter the earth’s orbit especially the rope which is connected with spacecraft & elevator.
Figure (228) – Returning Phase of Space Elevator
There is no weight or drag force for spacecraft because there is no gravity or air in space. So, special system will be subjected to the effect of forces from one side (Space Elevator) on earth.
Space elevators belong to that class of technology that we all want to see become a reality within our lifetimes, but deep-down doubt we’ll ever get to witness firsthand. Like cold fusion, or faster than light travel, we understand the principles that should make these concepts possible, but they’re so far beyond our technical understanding that they might as well be fantasy.
Except, maybe not. When Japan Aerospace Exploration Agency (JAXA) launches their seventh Kounotori H-II Transfer Vehicle towards the International Space Station, riding along with the experiments and supplies for the astronauts, will be a very special pair of CubeSats. They make up the world’s first practical test of space elevator technology, and with any luck, will be one of many small steps that precedes the giant leap which access to space at a fraction of the cost will be.
Figure () – Japanese’s Idea of Space Elevator (JAXA-Japan)
Of course, they won’t be testing a fully functional space elevator; even the most aggressive of timelines put us a few decades out from that. This will simply be a small scale test of some of the concepts that are central to building a space elevator, as we need to learn to crawl before we can walk. But even if we aren’t around to see the first practical space elevator make it to the top, at least we can say we were there on the ground floor… continue. (web-24) [Post Sep 2018]
The idea No.8 is different from Japanese’s agency idea as the last is based on making elevator located in geostationary orbit (fixed), but my idea is based in forward & backward motion of elevator into space.
We have end this section. I hope that you are enjoy even it’s very long but necessary.
More ideas will come in future
10. Conclusion
We have proved numerically that 4 ideas may reduce the fuel consumption by using engineering simulation program “Fluent”. Figure (229) represents the results summary for all ideas.
Figure (229) – Summary of Fuel Usage of All CFD Tests by Fluent Program
As we mentioned earlier, idea No. 2 & 3can’t be applied in traditional rocket engine due to an issue related to the design of combustion unit & it should be changed if we want those ideas to be workable.
Even I believe that real experiment will face some technical issues for many factors such as temperature, pressure limit allowed by material properties of rocket or engine, I’m sure that I can find alternative solutions.
Some of the photos ideas technologies may be applied immediately & other we should until we increase it is capability & effectiveness as that’s technologies are in early development stages.
11. Last Words,
[1] It was an exhausted Month for me to prepare this amazing article (finding ideas, doing CFD simulation test, writing draft of article, collecting data & photos, then publishing with low speed internet service ).
Definitely, testing CFDcases by Fluent program is not always easy as you will compel to change the design of idea by Gambit program (pre-processing drawing ) program if it is failed to give us an excellent results or the Fluent program can’t solve it due to code issues. That[s happen too much for me because the strange idea that I have designed.
Anyway, After all I was happy that it ends like this & I success to publish an article.
Very Proud
*********************************
[2] The funny story about finding idea No,4 “Secret Rocket Engine” is unbelievable.
Before I publish this article, I was shared my results of ideas 1,2 & 3 to my connections & followers in LinkedIn website (Professional Website No.1) .
I told them, there is no idea No.4 to wait it for publishing the upcoming article as I promise to them early, that I must test 4 ideas before publishing. (although there are more than 30 hypothetical ideas in that time).
I was excited by results of idea 3, so I decided to start writing the article,
But.. ……..
Suddenly, it appears in my mind like pulse of light a new idea related to nozzle design which I can’t move it from my head at all.
To be a scientist/inventor, that’s means you can’t do 2 things in 1 time, so I decided to take care of it (idea) & delay the writing of article’s draft.
Strange isn’t ?
Why I care about this new idea especially although there are 30 hypothetical ideas in my notebook in that time .
When I prepare Gambit & Fluent program to test my new idea of nozzle design , I was surprising with the result.
The X-Force was unbelievable value to me. It reach more than 5000 KN. (the conical nozzle was only gives us –force approximately 209 KN.
Figure (230) – Strange Result for An Old Idea
It’s great achievement. right ?!
But how that’s happen ??
What’s the secret behind that value ?
I don’t have any explanation in that moment.
So, I said to myself, maybe I have enter wrong number/parameter on the Fluent program as it’s impossible that program gives us false/fraud data.
When I check my parameters in Fluent program, everything seems OK & I repeated the CFD simulation again with other different cases but it’s still giving me the a high value of –force.
So how I get that huge value ? It’s contradicts with thrust (T= – m*Ve ) & momentum laws.
And do you want more strange thing about this idea?
We know that conical nozzle will move upward, but our new nozzle may move downward.
I told you it’s very strange idea, value & motion behavior.
I was thinking in that time that X-force may increase by 2 or 3 time than conical nozzle force.
If the numerical results gives us that strange value, so it must be that new strange idea has something unique.
I should return back to scientific article & references for more reading to analyze my idea in depth & find the original equation of thrust because I was believe that law (T= – m*Ve ) has been formulated under many assumptions & conditions for traditional nozzle which used today in rockets launch.
So, I find some signs in a reference of what I was believed it’s the general law of thrust as it depend on surface & volume control & it shown in figure (231).
Figure (231) – Special & General Law of Thrust on Rocket
Although my knowledge has been expand, which that able me to understand how part of high value of X-force calculated in Fluent program, but still not enough for me.
I decided to make a new case by using Gambit & Fluent to analyze the effect of what I was thinking it’s the main factors which let us obtain the high value.
I have got a shock, because everything return back normally in Fluent program. I don’t get high value of X-force.
So, why I get the high value in that case ? I don’t know but for this moment, I can say it was an error from code inside Fluent.
Maybe you think now it was waste of my time, isn’t ?
Actually, I was very happy for knowledge that I have learned by compelling me to know the general law of volume & surface control and understand it. It let me to know & admit that idea No.2 (curved nozzle ) can’t work unless we change the design of combustion unit.
I was upset & sad in that moment because idea No.2 &3 can’t be applied in traditional rockets.
How I find the 4th idea & make it workable. I don’t know in that time.
Businessman and businesswoman raise their hands while sitting at a business conference. Horizontal shot.
Figure (232) – Audience Raising Hands for Asking The Speaker
Audience: So, from where you find idea No.4 (The Secret Rocket Engine) ?
Me: You will laugh, I was lucky. It was found by small comment in my shared ideas results in my LinkedIn account .
That phenomenon I know about it early, but I don’t know it’s name to search in internet about it & why it’s happen in our life.
So, by merging my expanding knowledge & open my scientific mind with this phenomenon, idea No.4 has been proved in Simulation program “Fluent” immediately.
[3] Thank for Mr. Robert O’Keeffe (CEO & Founder of Tachyon Aerospace Co.) who was acknowledgement of my article of reducing fuel consumption of planes [LINK].
He commented also by saying::
“In Rocket There Is No Wings”.
He encouraged me indirectly to find ideas related to aerospace industry & there are more than 50 ideas in mind.
So, thanks for him
Figure (234) – Tachyon Company Logo
Actually, I wasn’t intend to focus on aerospace that time, and there was 2 ideas related to planes want to simulate it. But I said to myself :
“ Why I don’t stop now & take care about rocket launch as we have published many ideas related to planes”.
I was enjoyed from my heart after these horrible & exhausted month.
Feeling relax after hard job is something make you happy that you make a little change in your life.
[4] Increasing your scientific knowledge by reading articles, books & references & watching educational videos are very important & crucial part to understand the general concept & working mechanism of what you want to study & it will open your mind for many things in our life either directly or indirectly approach.
Figure (235) – Reading Will Open Mind of Children
In the first time I decided to find ideas for reducing the fuel consumption of rockets, I was having 3 or 4 ideas only. Then I start to read some article because frankly I don’t know how rockets move upward by nozzle.
In our university study, they gave us a general principles of thermodynamic & turbo machinery science, but not in detail as it s concerned with high-level study (e.g. Master & PhD holder).
Anyway, I was eager to learn, so I understand some of unknown principles by reading some references & useful articles from internet which remove the dark of ignorance from my eyes of science.
Figure (236) – Studying will Open Mind of Youth
Frankly, it’s difficult to find what you want. You will download an article or e-books, but you will discover later that it’s doesn’t have the answer for your questions in your mind.
So, you will keep in downloading process of e-books until you find the exact solution for your integral equation of ignorance.
Day after day, week after week, I have learn more & I have more than 50 hypothetical ideas related to rockets launch & some of them are photos ideas& other related to reusable technologies.
Figure (237) – More Ideas of Solutions has been Found for Aerospace Industry
That’s not means all ideas will work perfectly, as I have suffered from failures & discovered some mistakes due to my knowledge ignorance. But by reading, strong observation & patient, we can find the innovative solution & another branch ideas extracted from the original succeed/failed ideas.
How To Contact Me
You may reach me via “In-Mail” option in my LinkedIn account, if you are not with my glorious connection. It’s only a verified method to identify your- self to me as LinkedIn website is the 1st professional website in the world. There are many fraud people in this world, wish I don’t like to waste my time & effort with them.
You can find my link account within my section of “My Bio & Scientific Articles”
11) 5 AMAZING SpaceX Rocket Landing Videos [ FOR REAL ]
12) SpaceX launch spooks the west coast causes aliens to trend
13. References & Websites
* References:
Ref-1: “Liquid Propulsion Systems – Evolution & Advancements Launch Vehicle Propulsion & Systems”, by ” Rick Ballard” Liquid Engine Systems Lead SLS Liquid Engines Office NASA /MSFC –
Ref-2: “Physics for Scientists and Engineers with Modern Physics” [9th Edition], By: Raymond A. Serway (Emeritus, James Madison University) John W. Jewett, Jr. (Emeritus, California State Polytechnic University, Pomona) With contributions from Vahé Peroomian, University of California at Los Angeles – BROOKS/COLE CENGAGE Learning


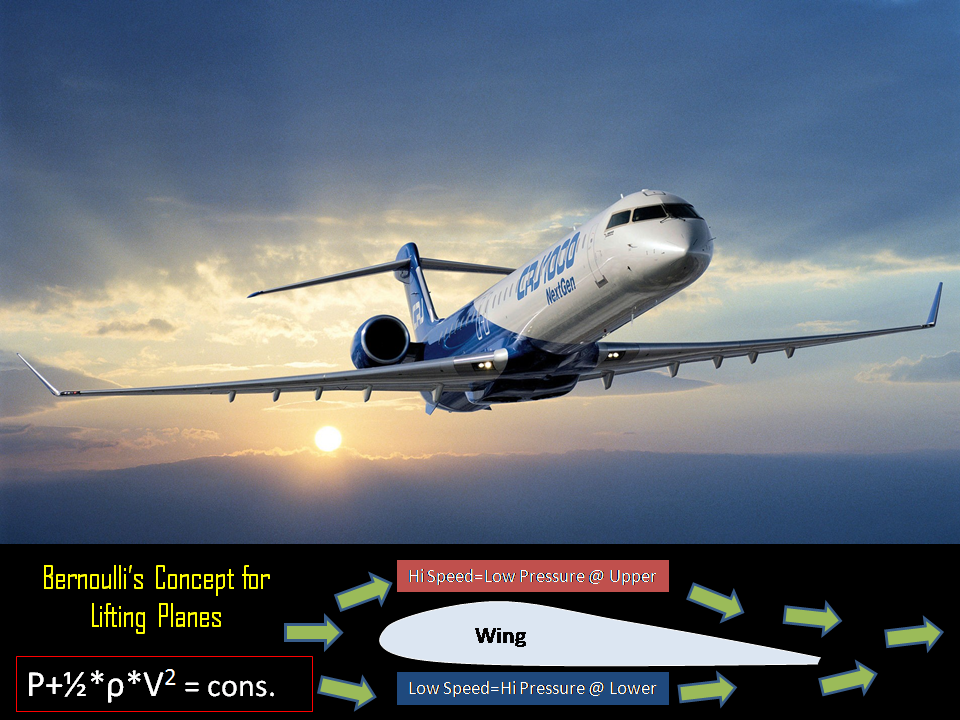

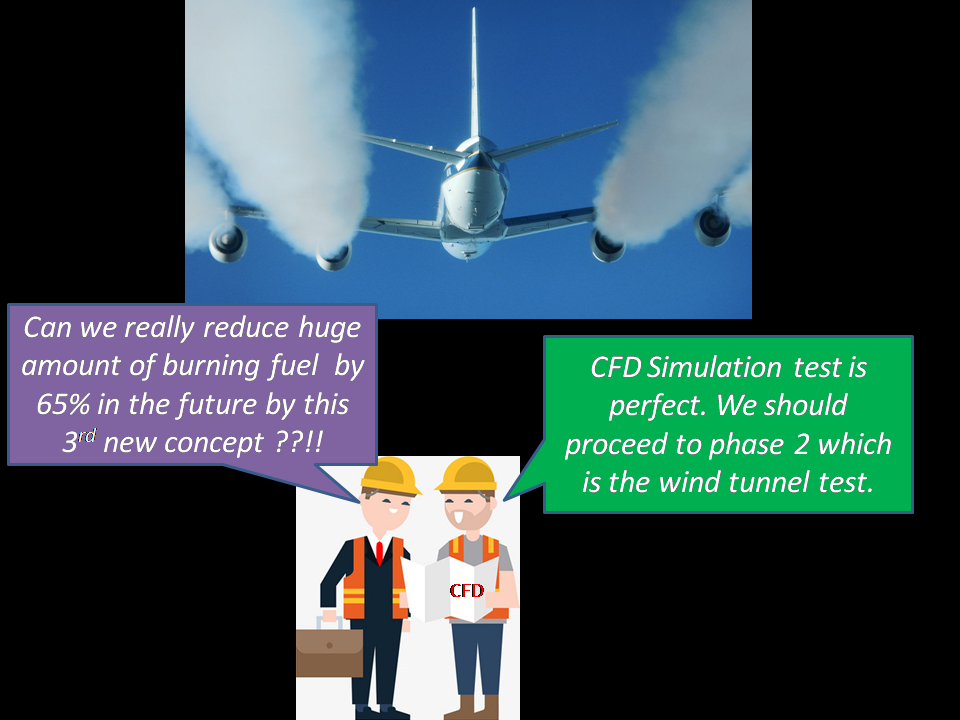
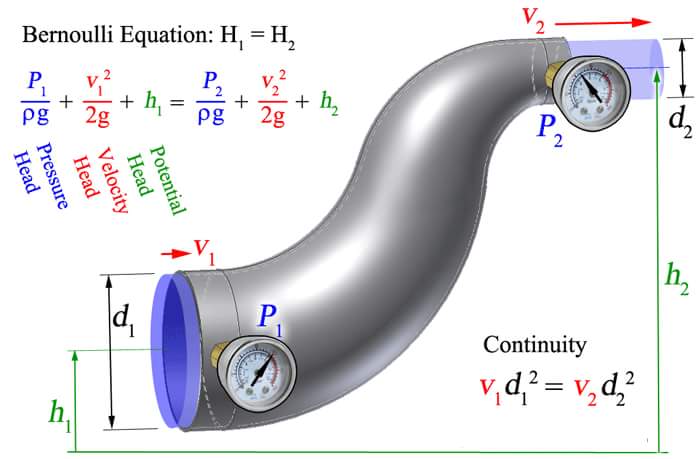
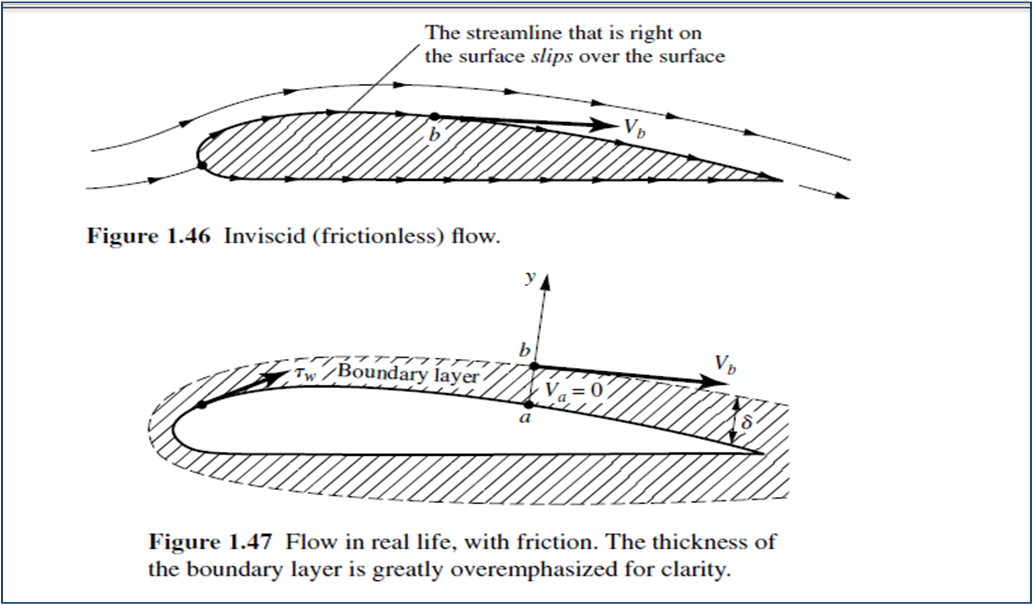
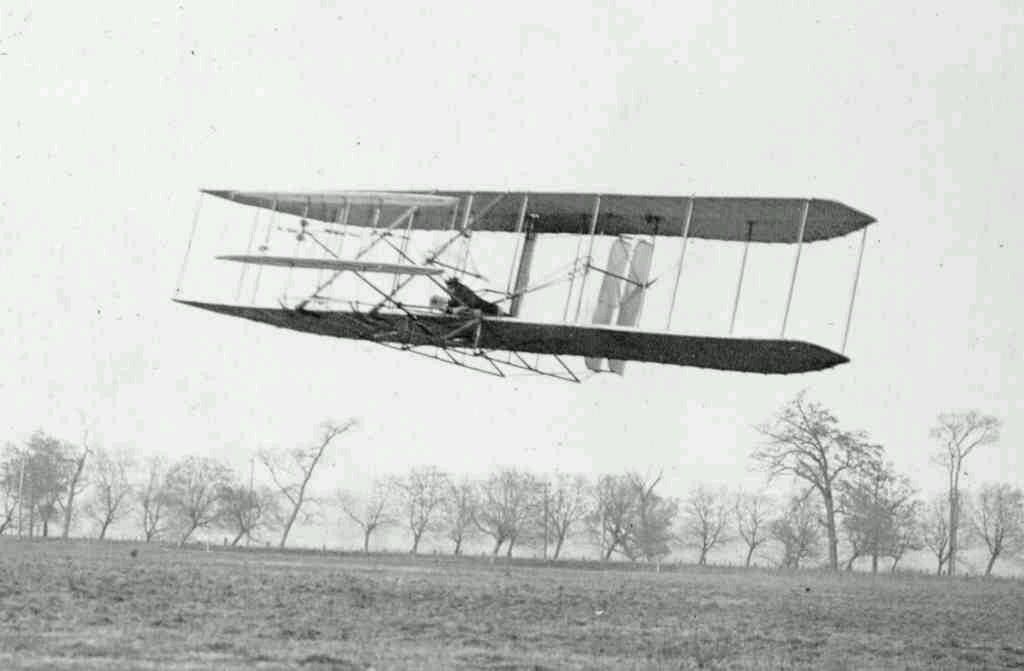
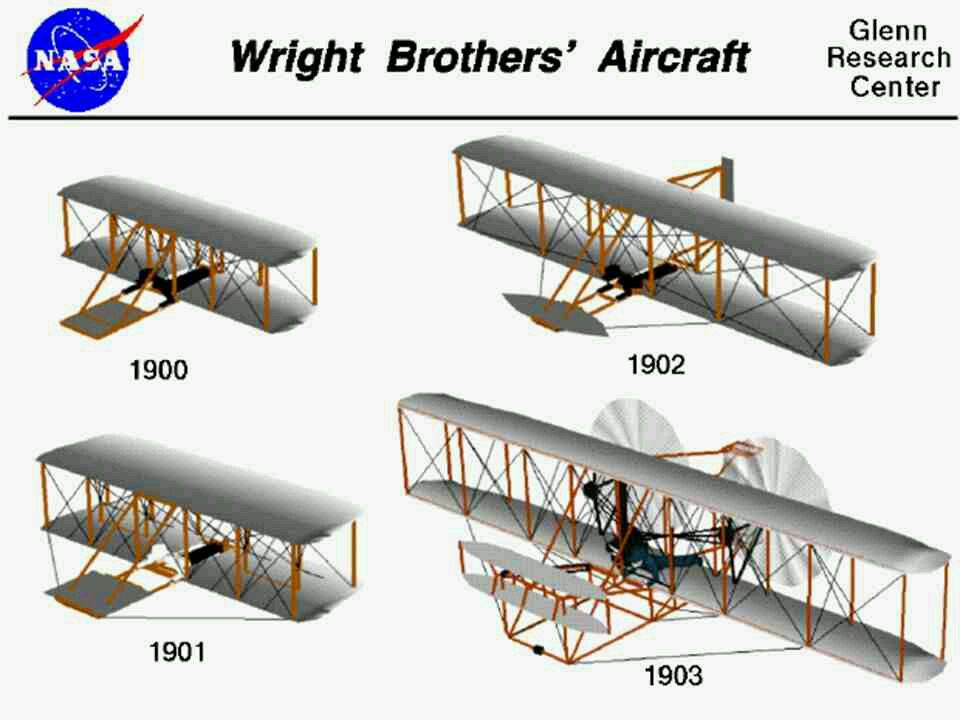
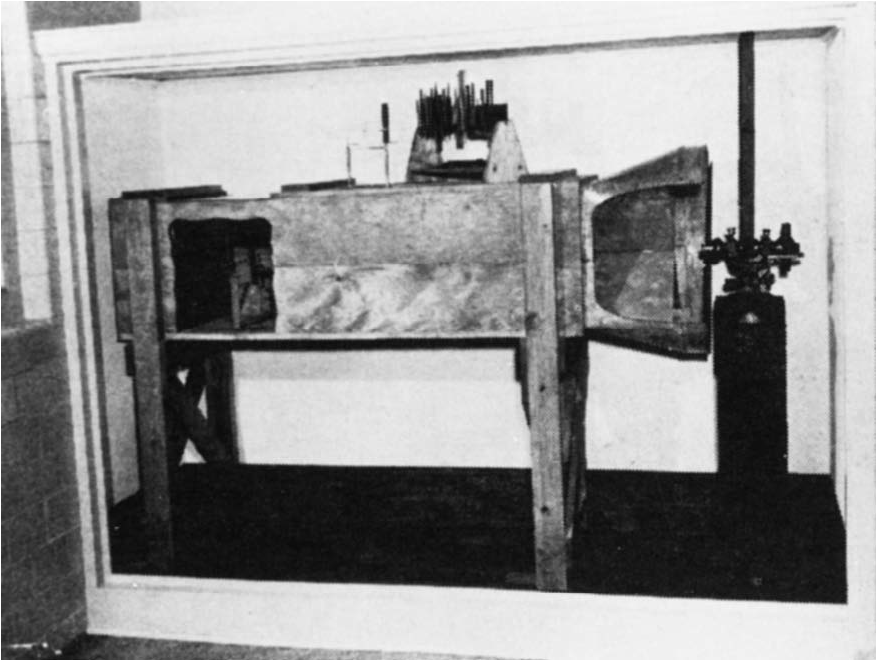
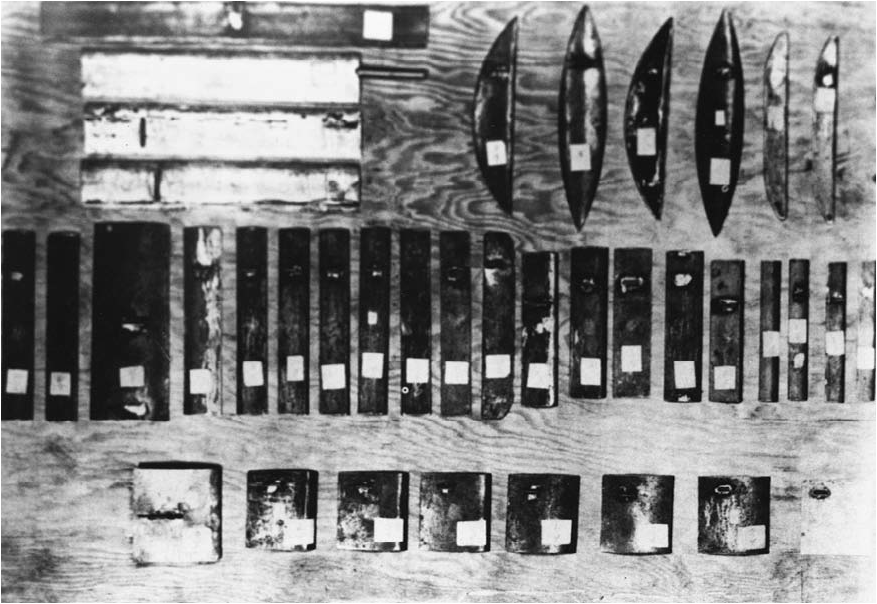
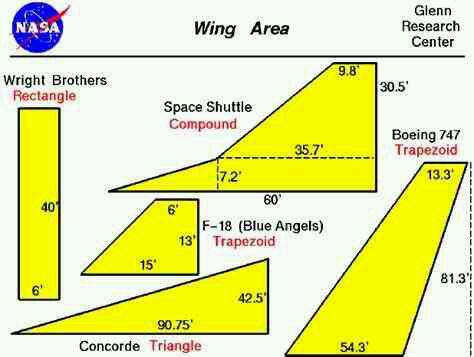
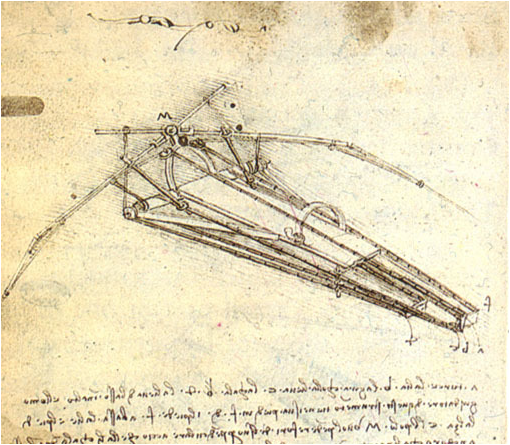
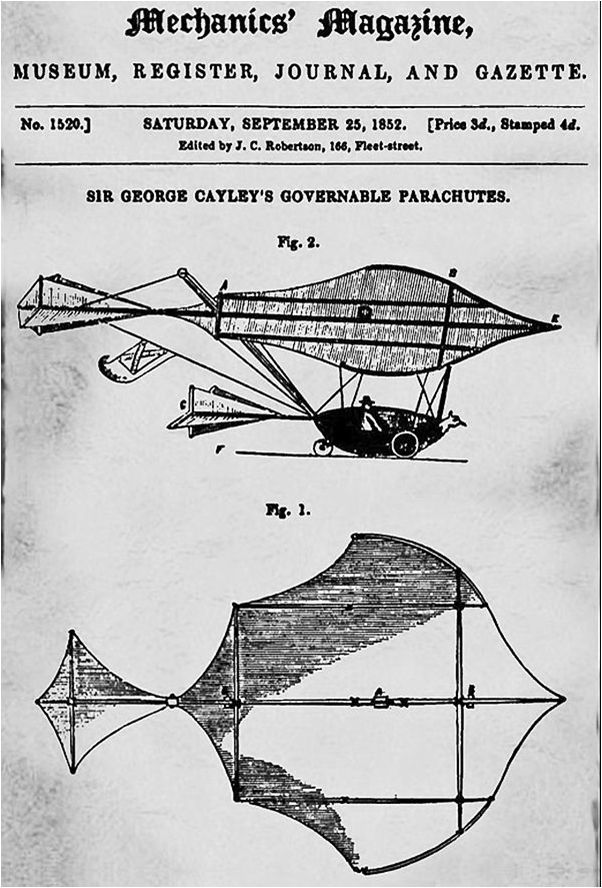
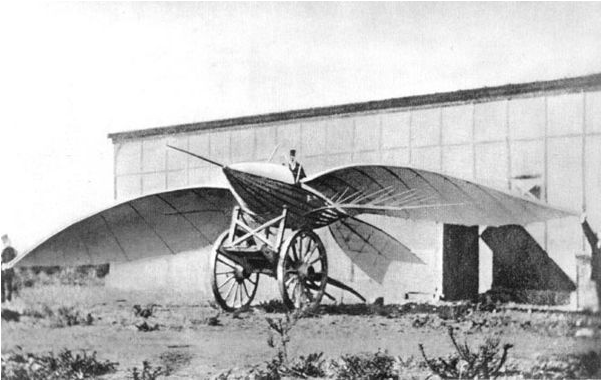
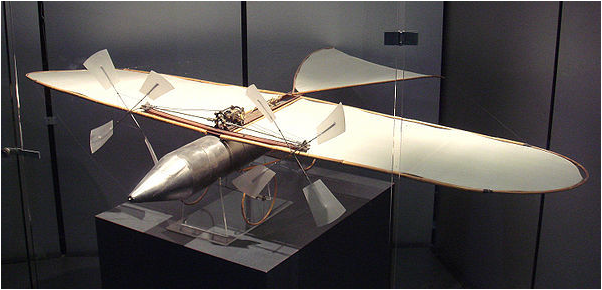
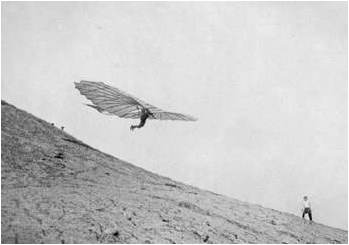
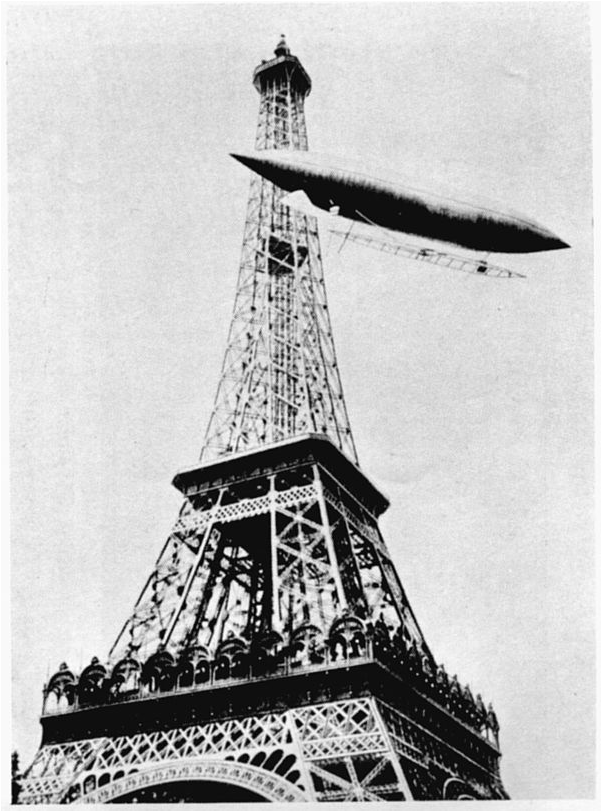

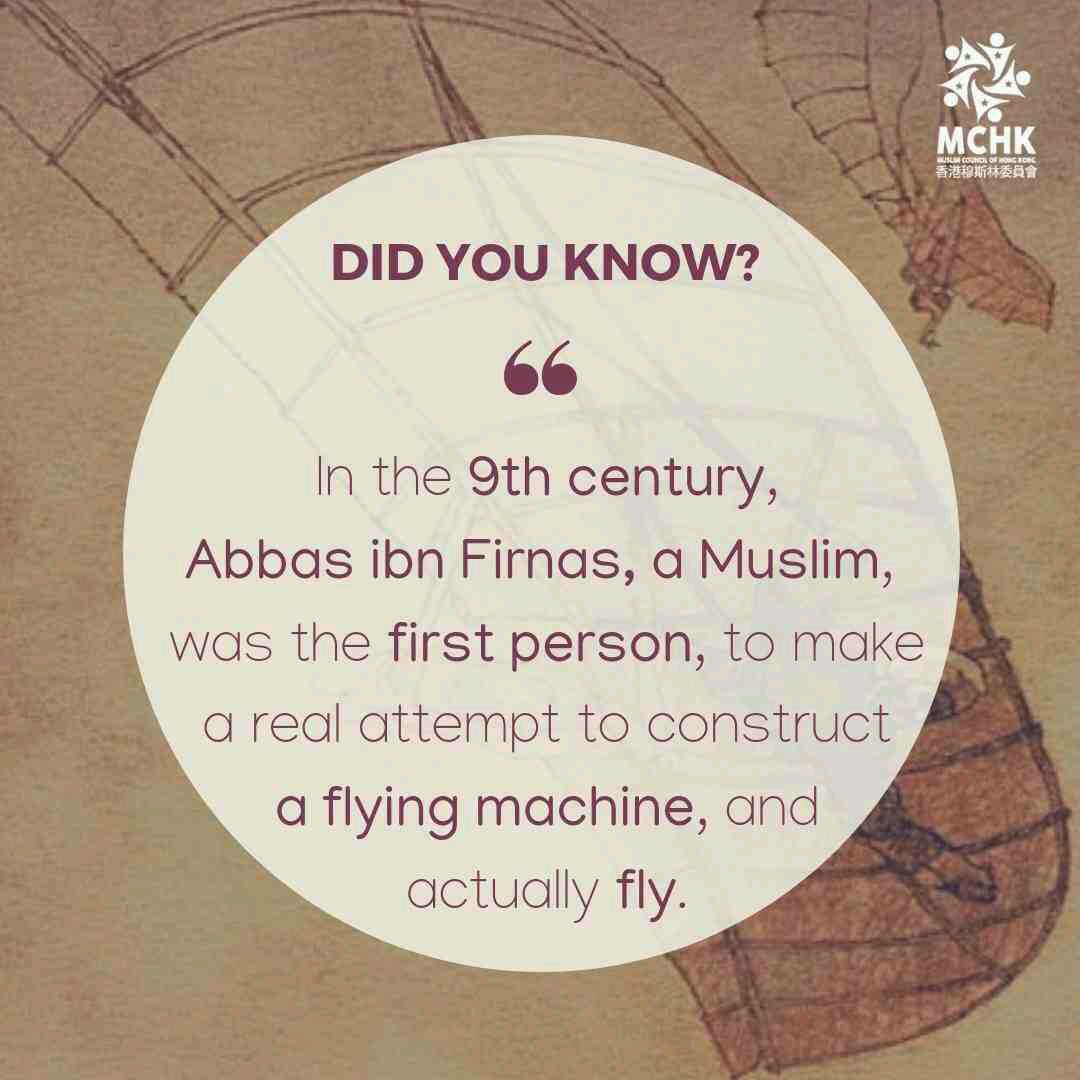
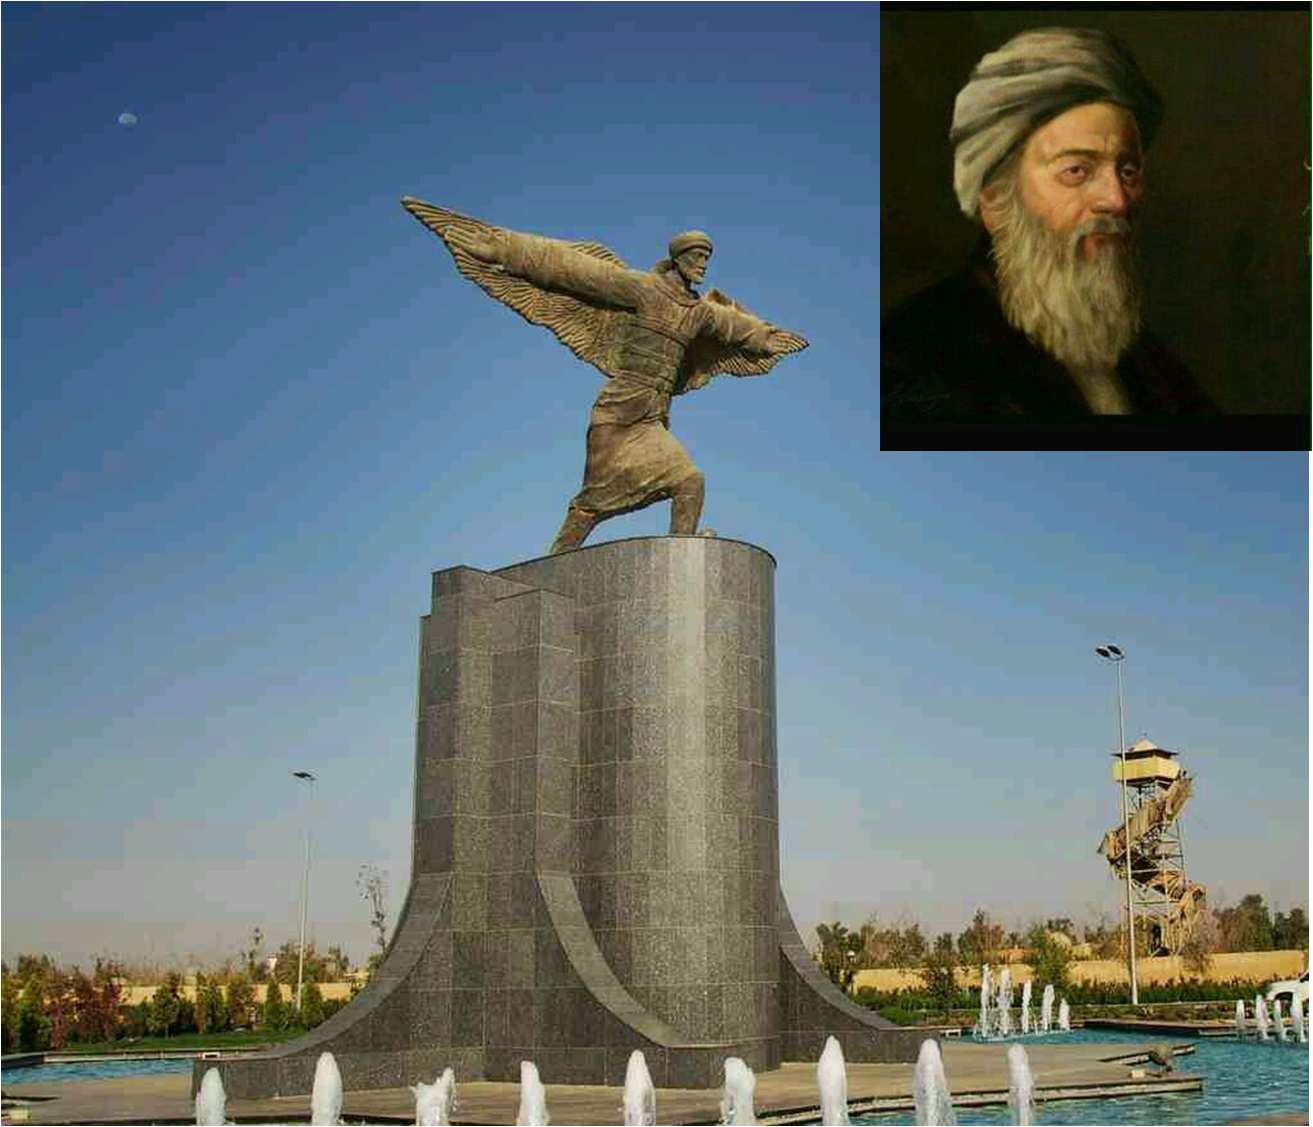


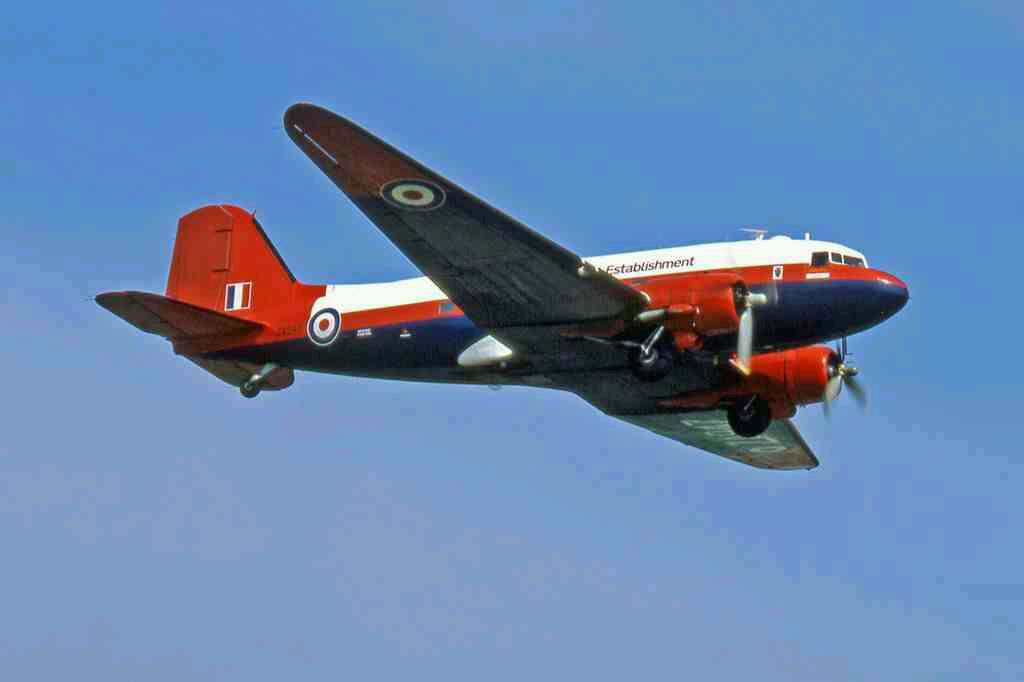

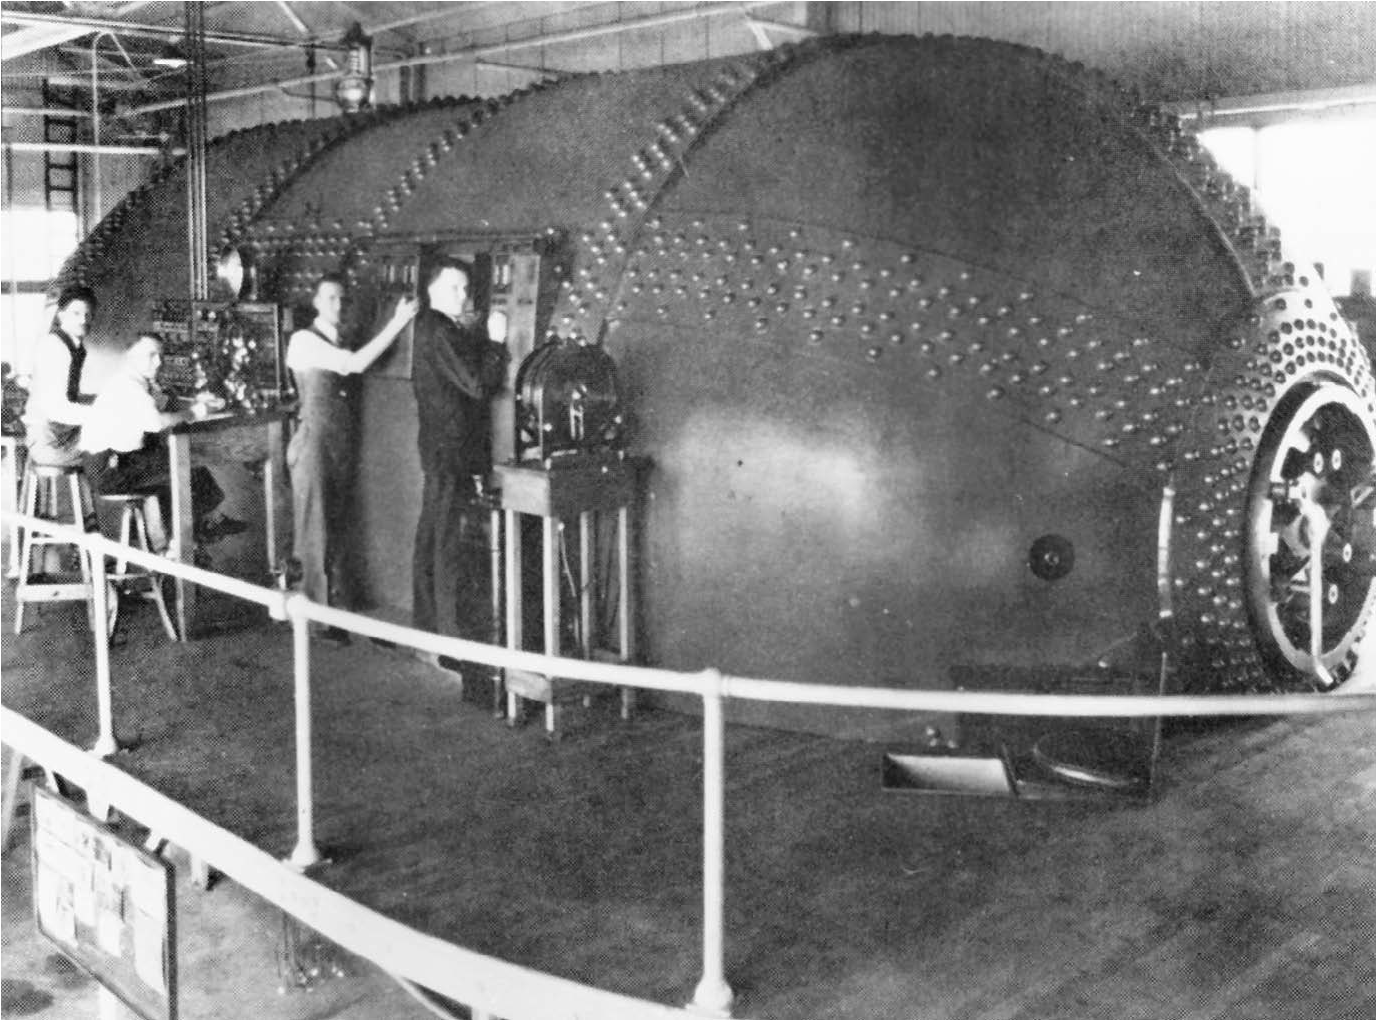
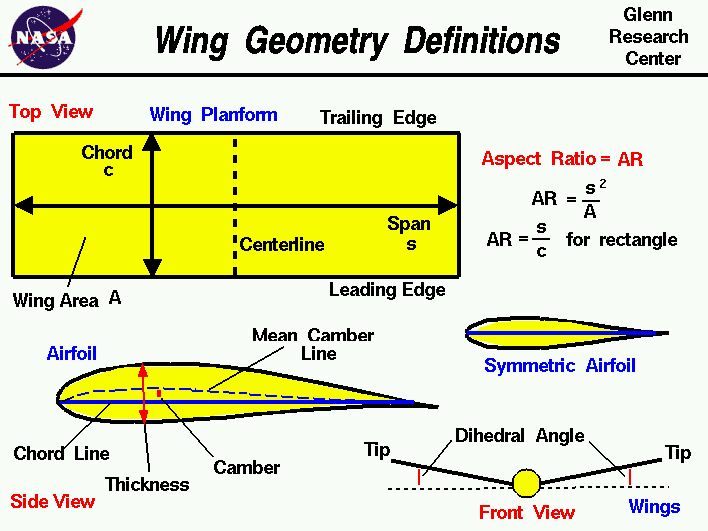
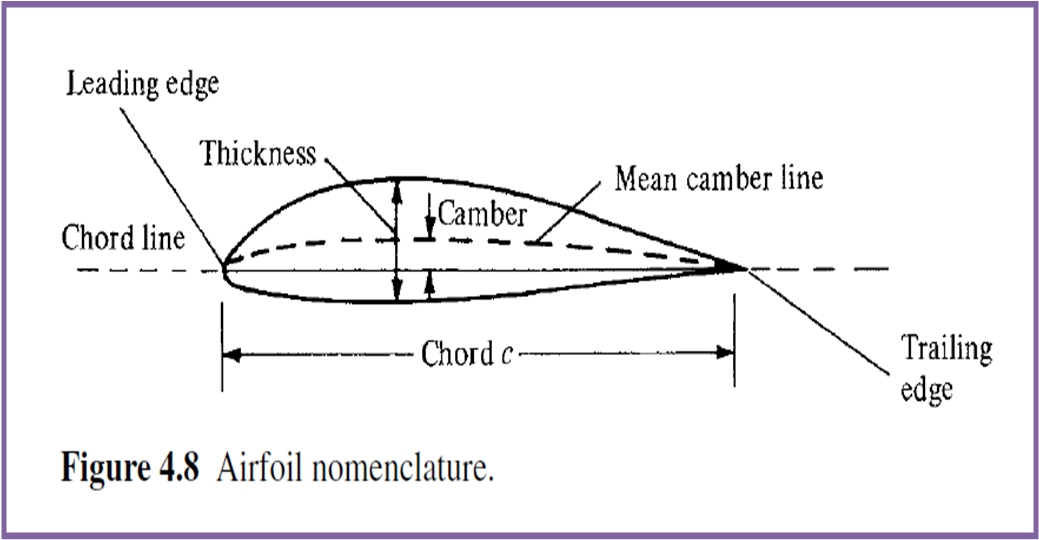
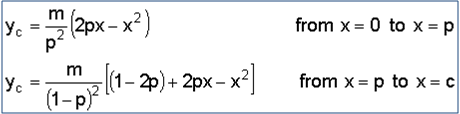
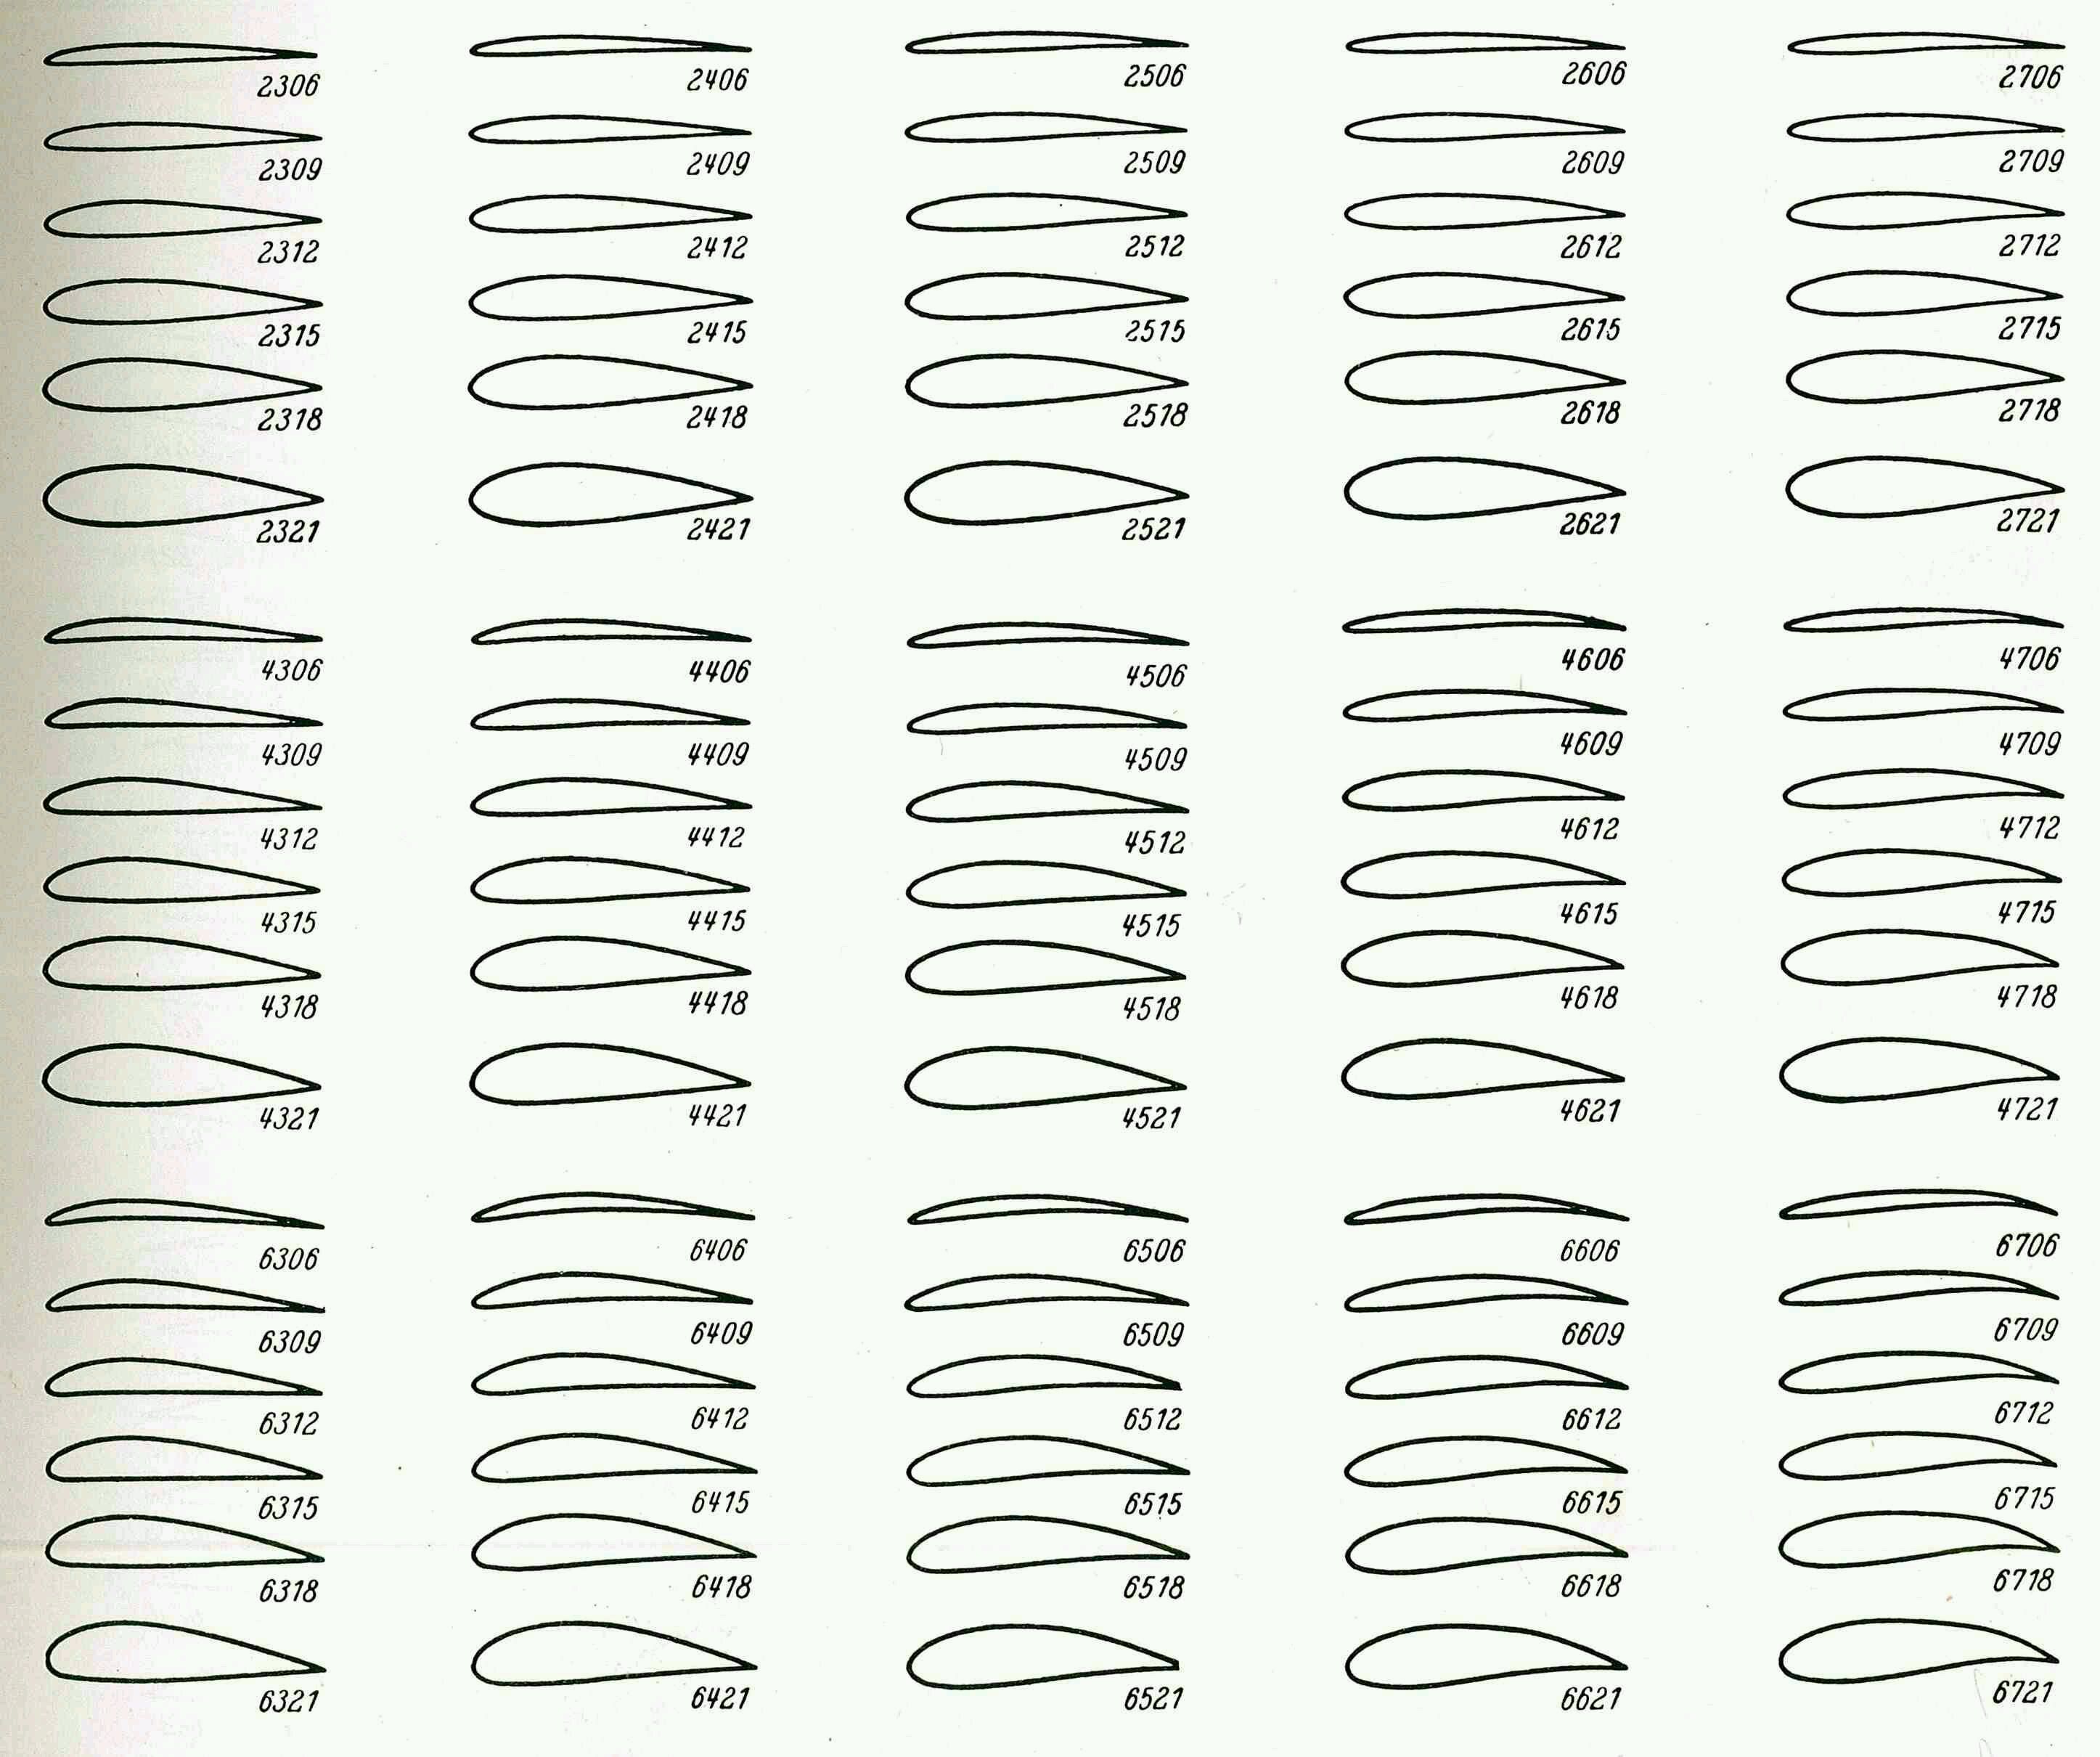
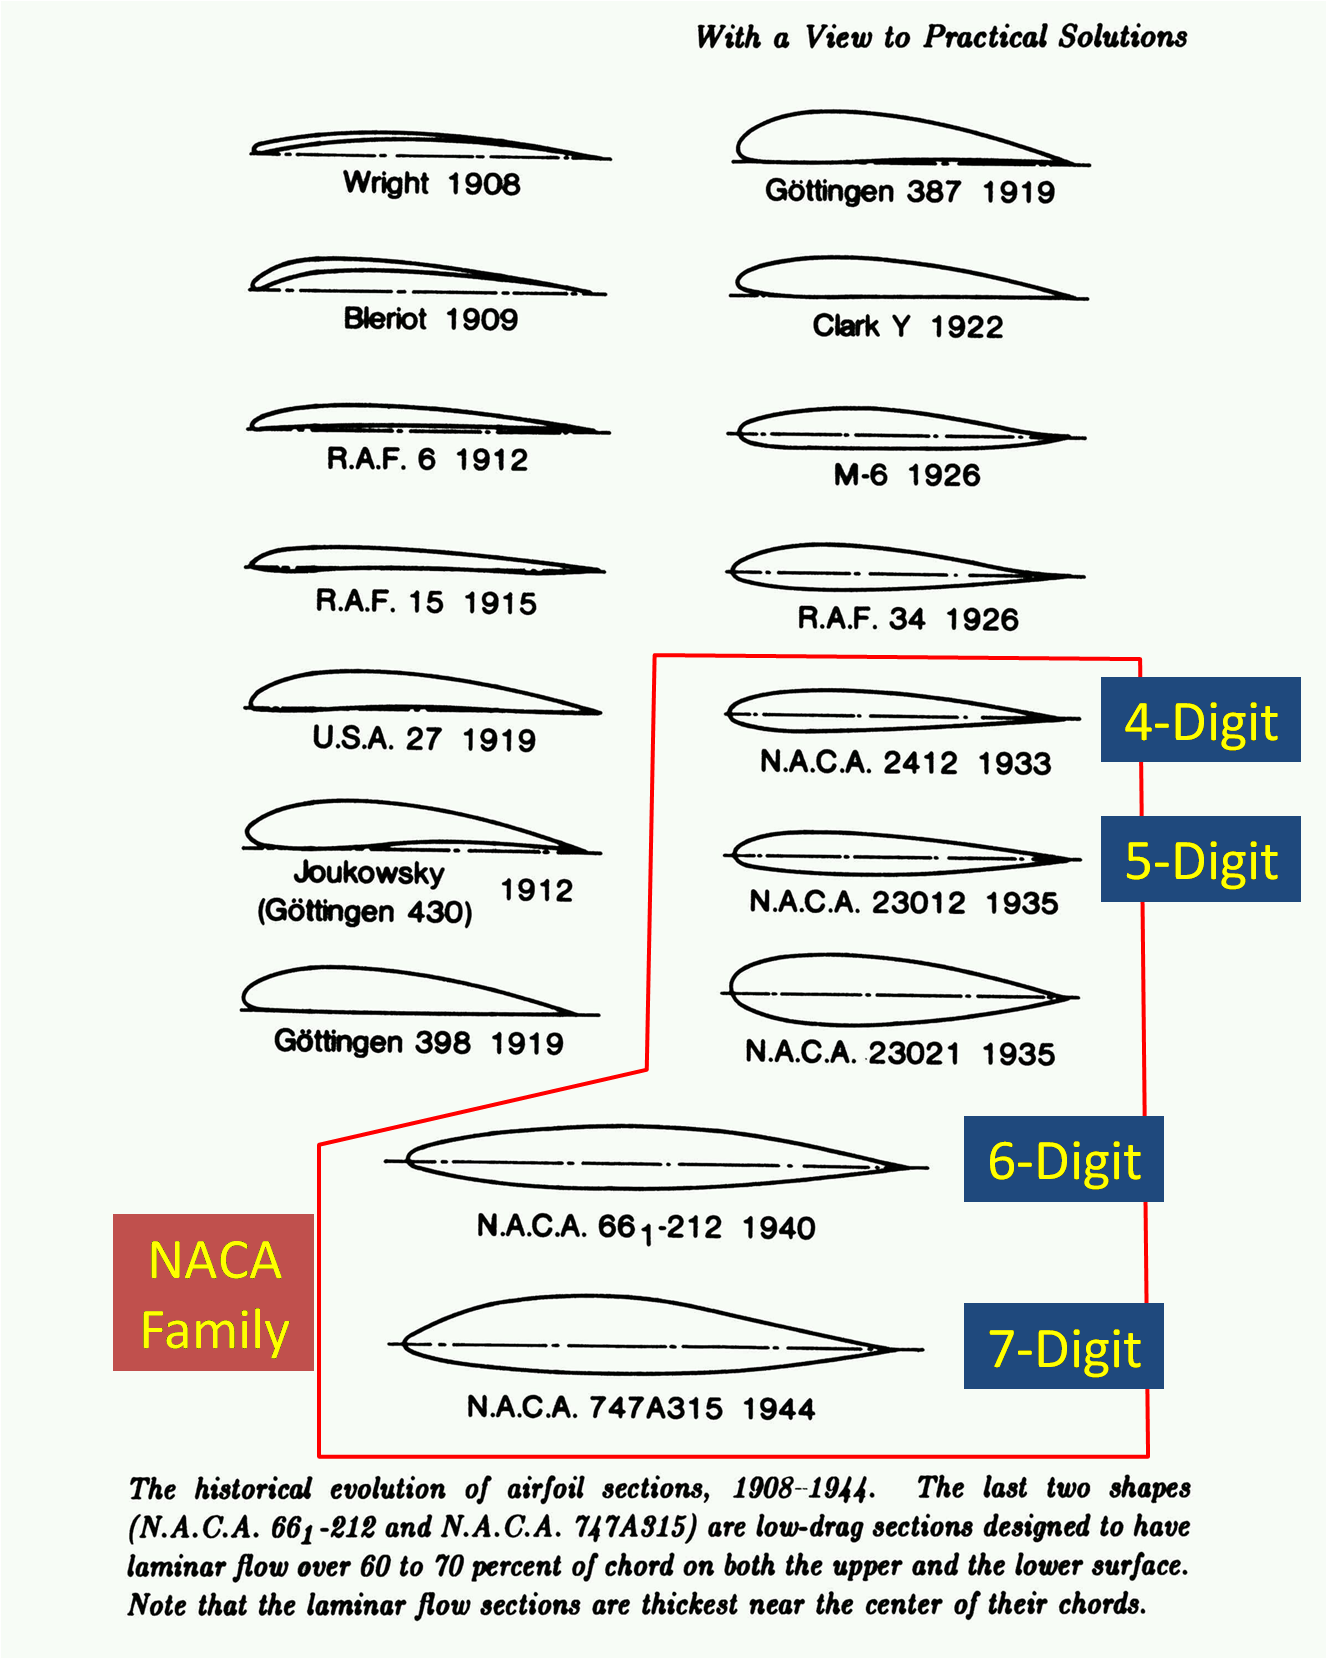
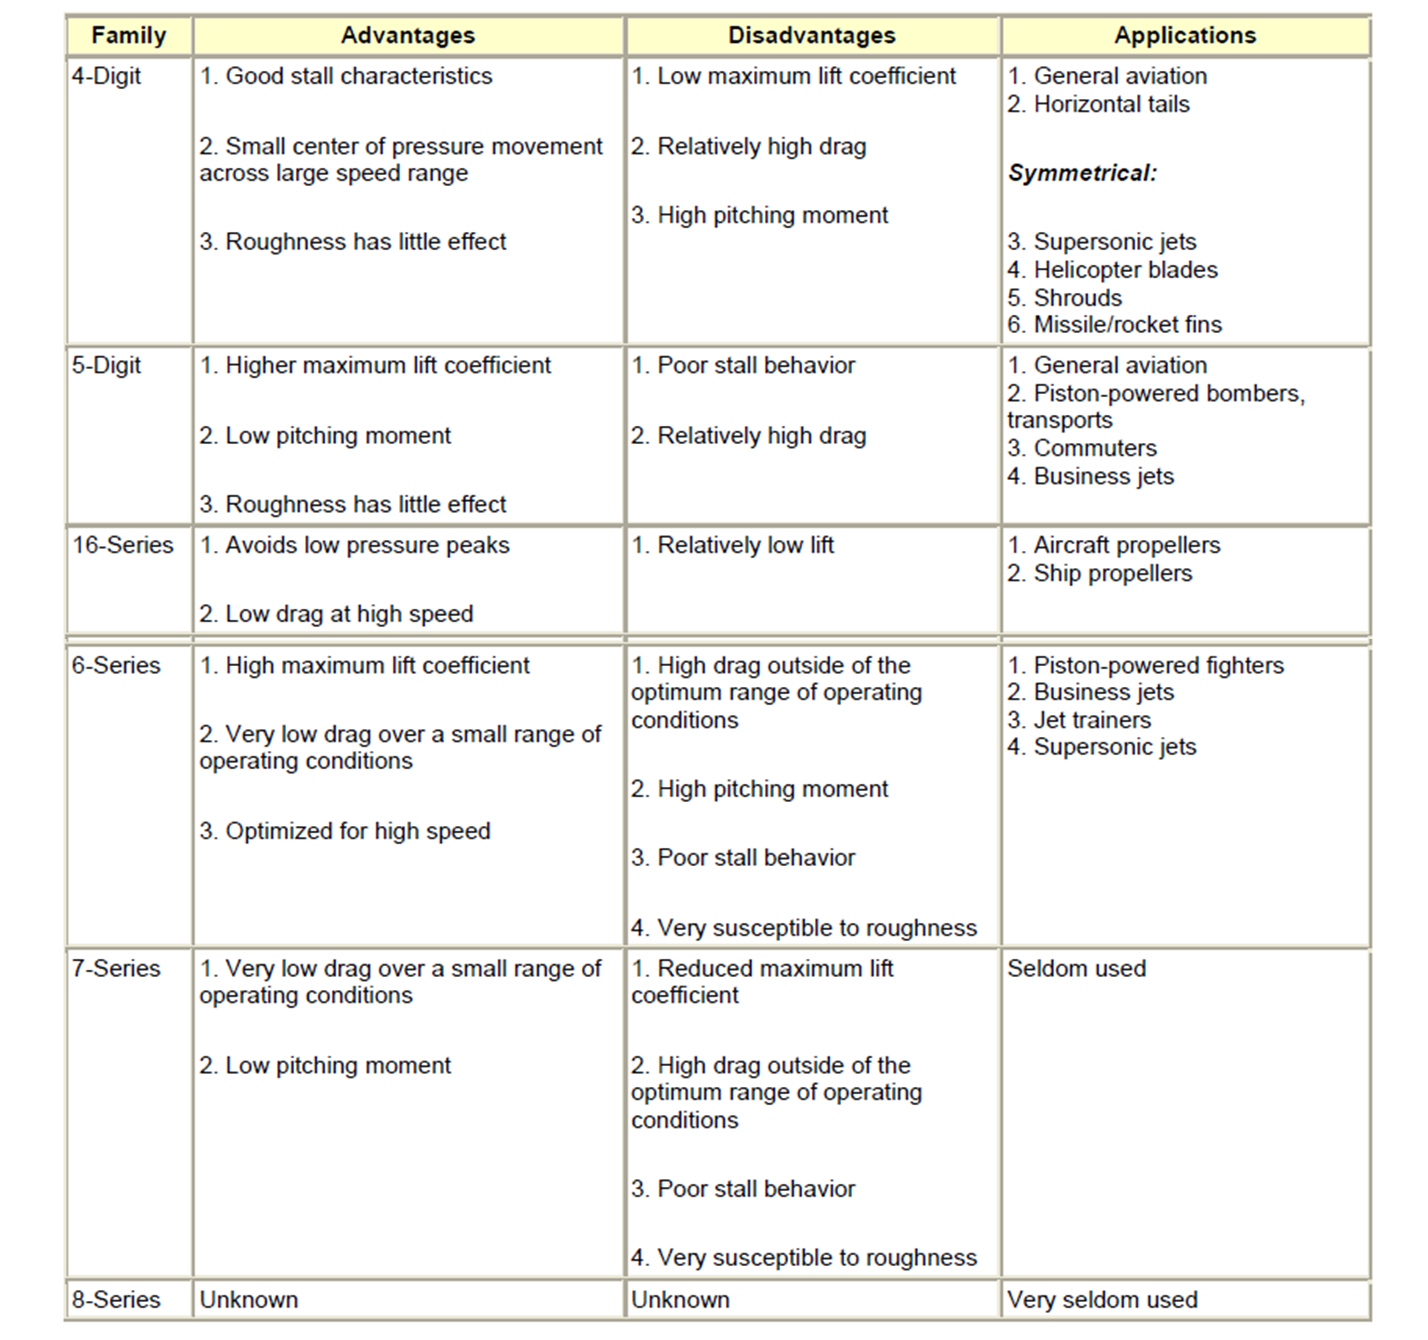
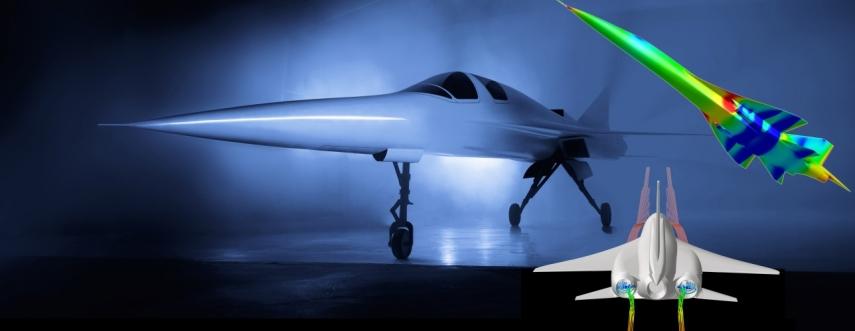
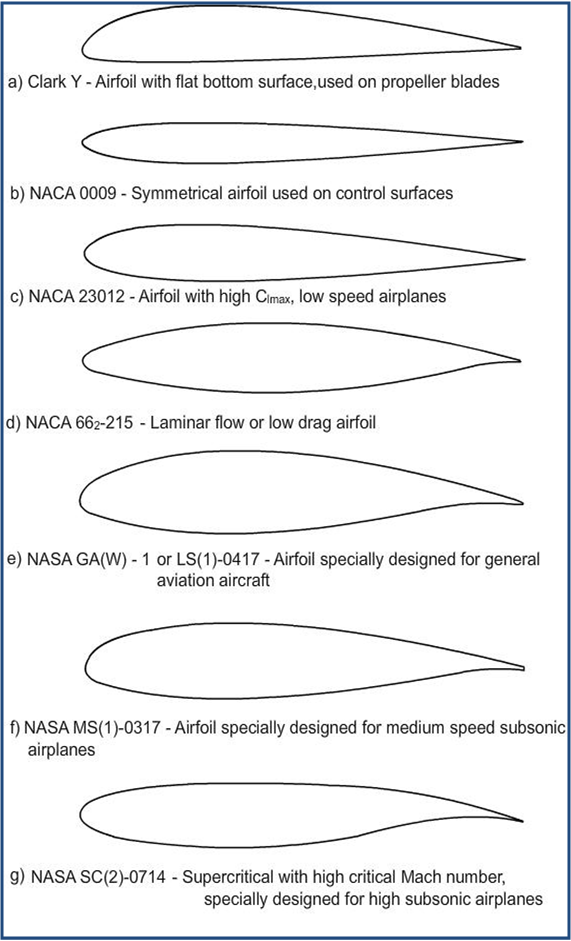
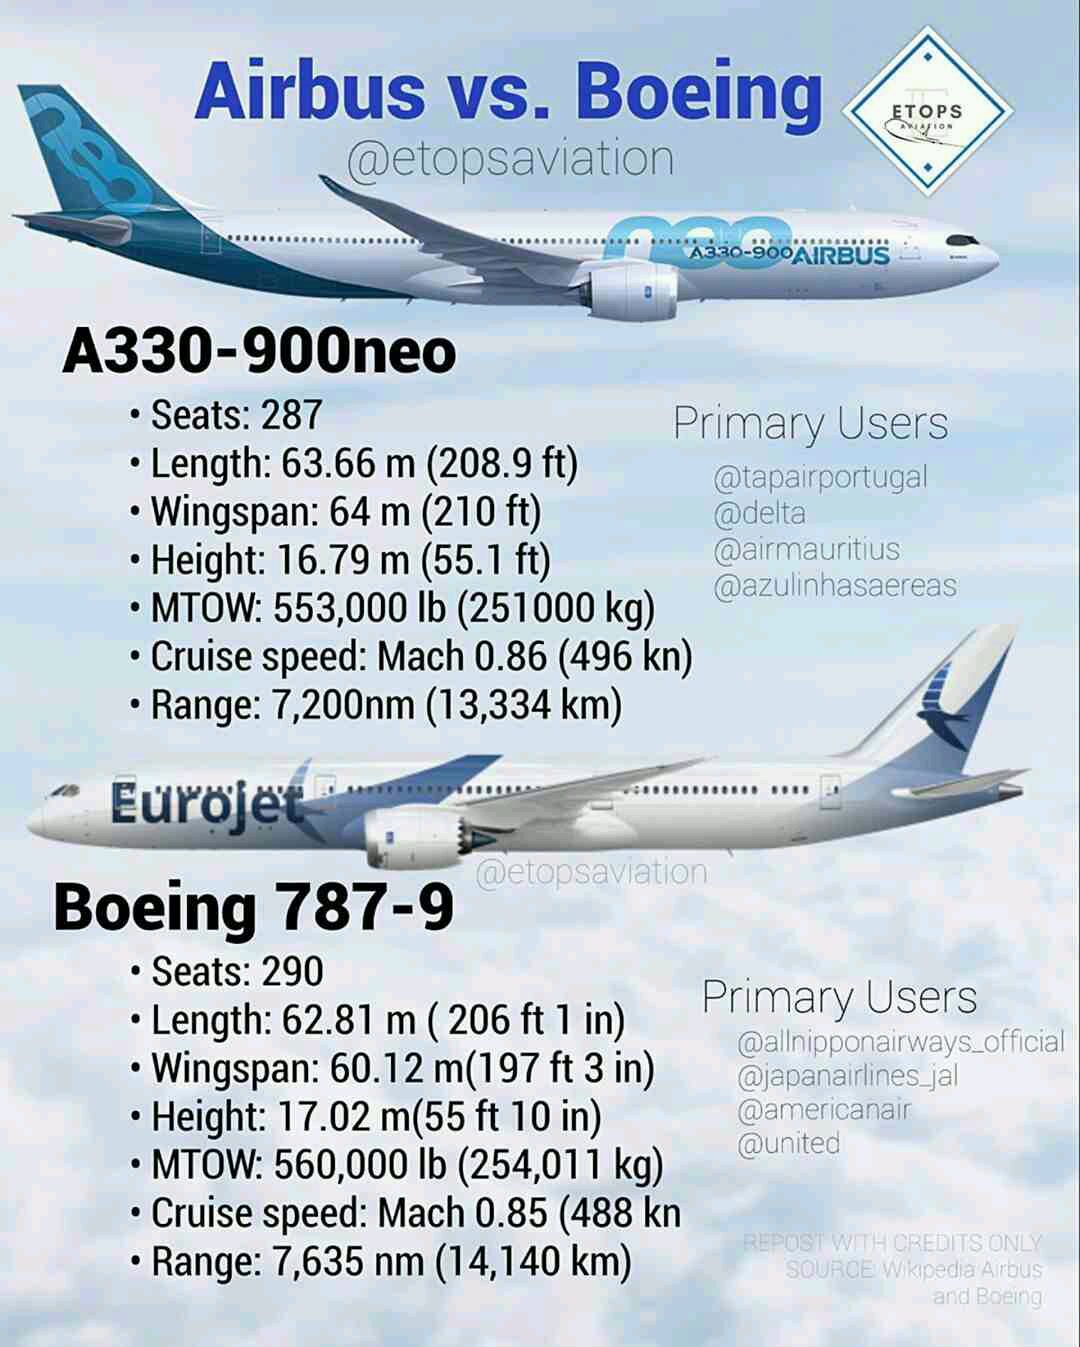
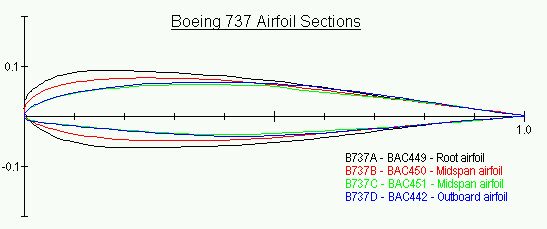
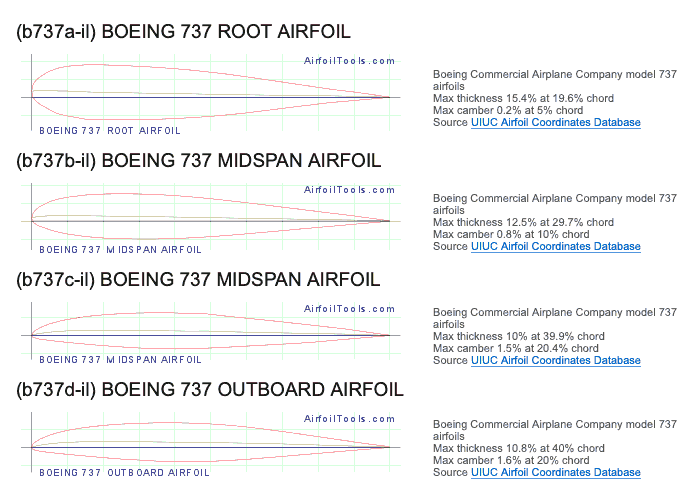
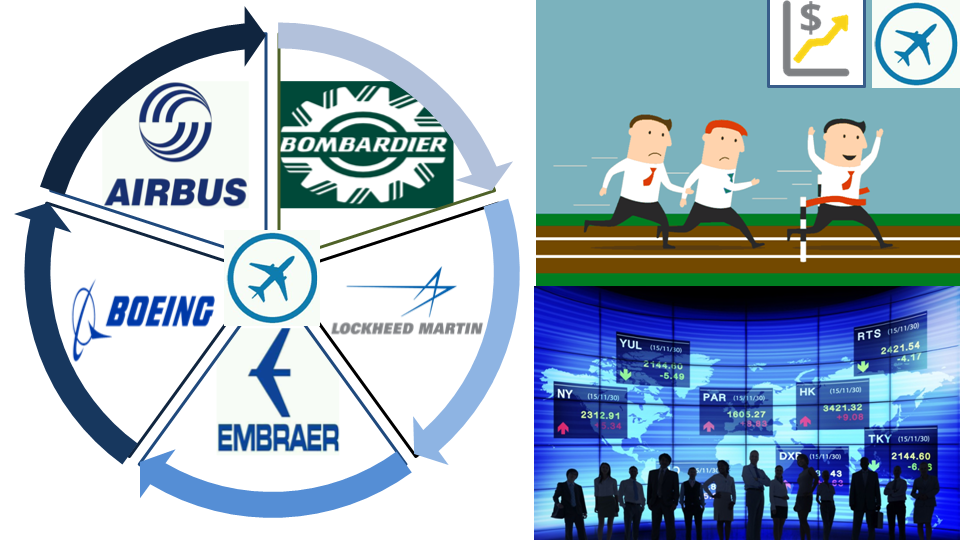
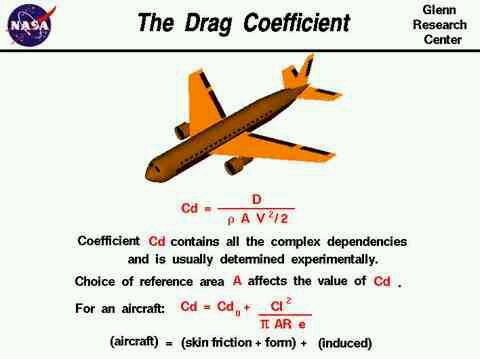
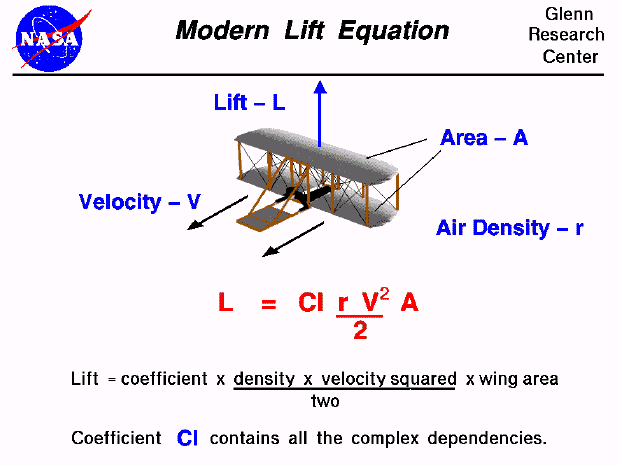
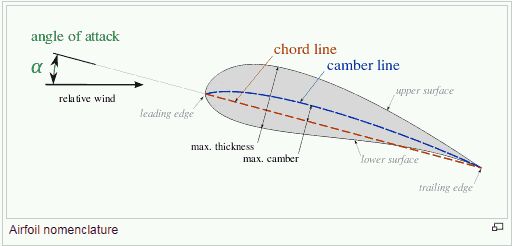
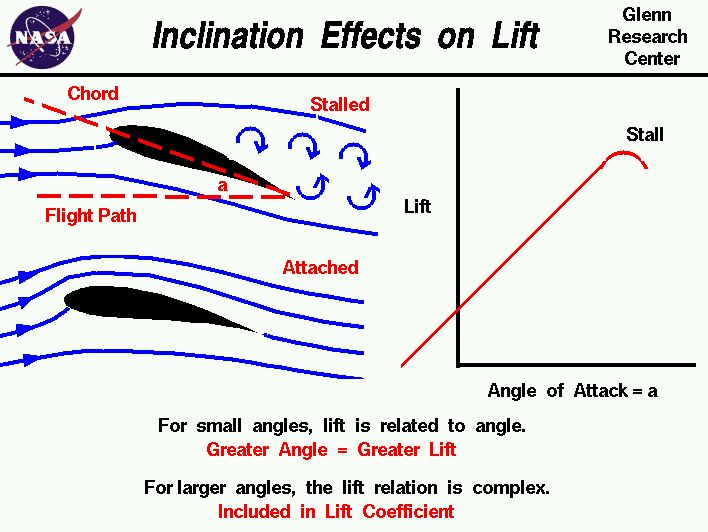
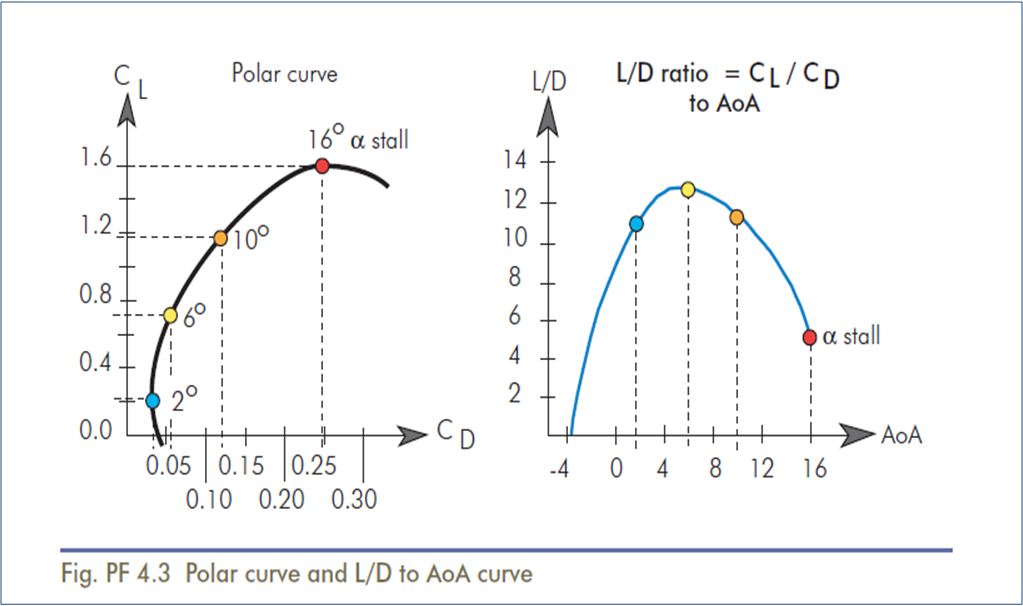
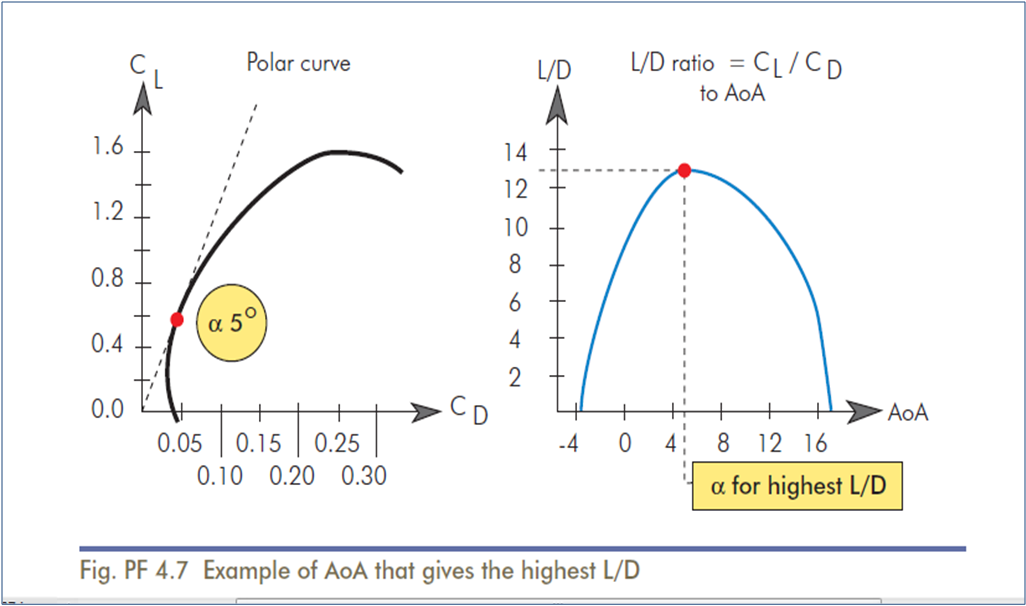
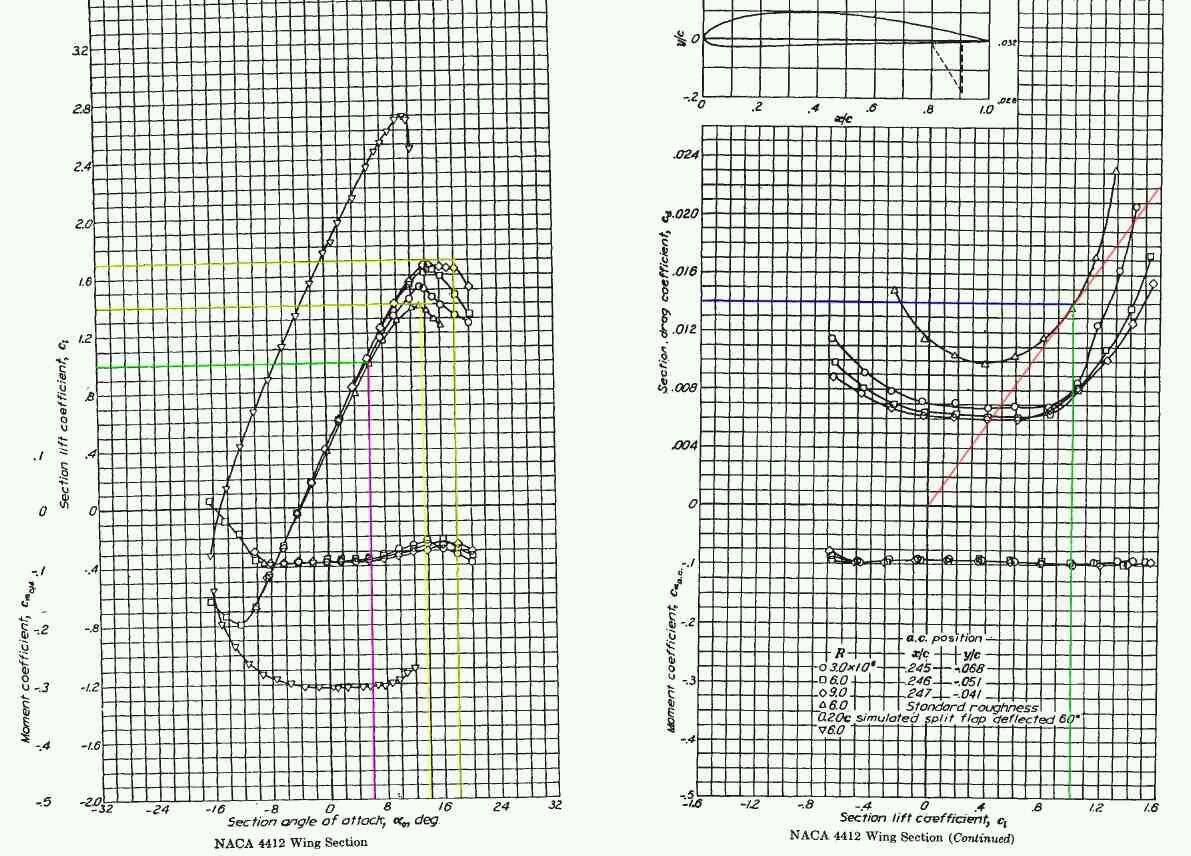

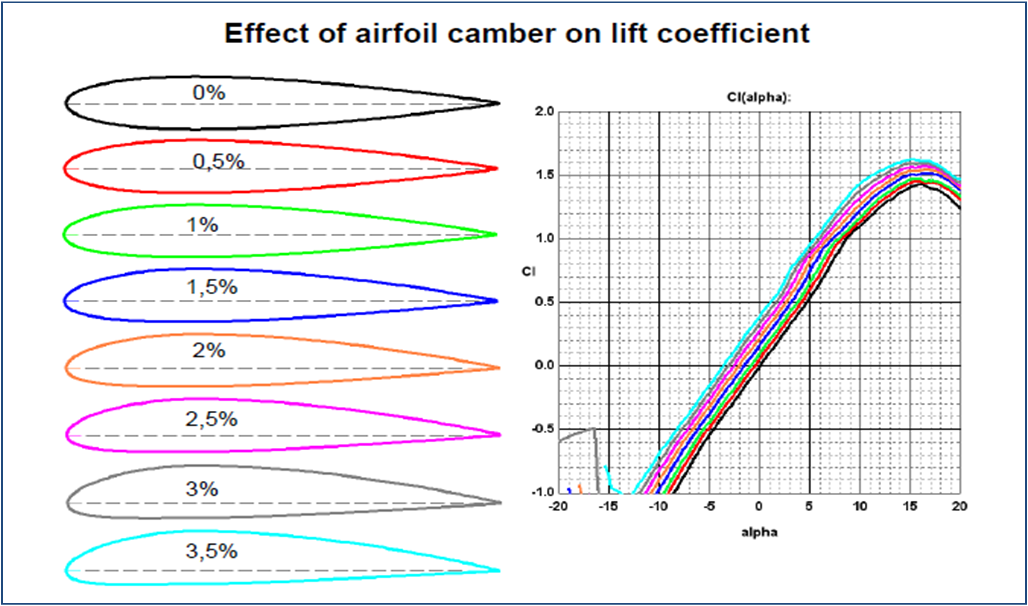
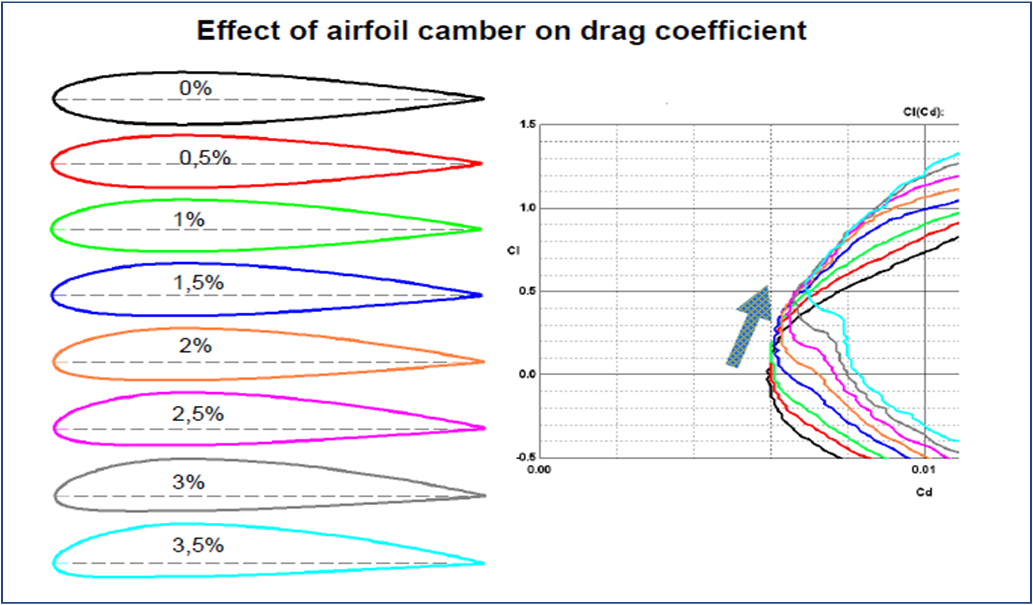
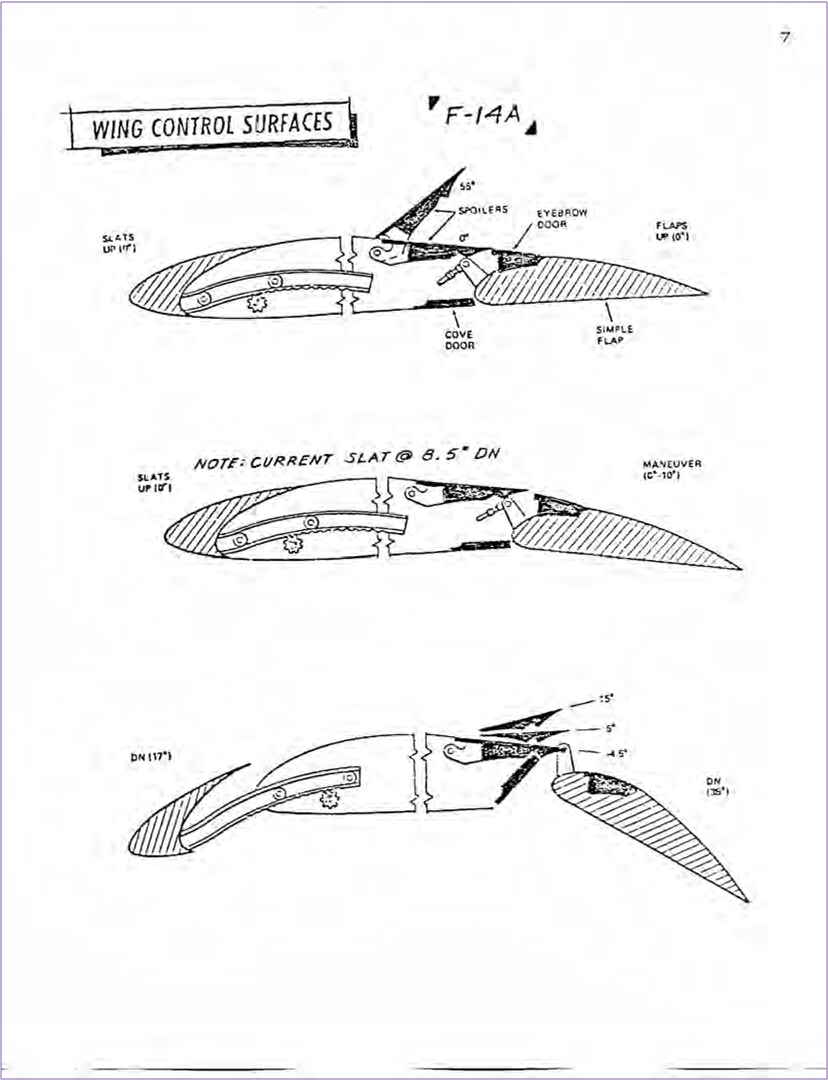
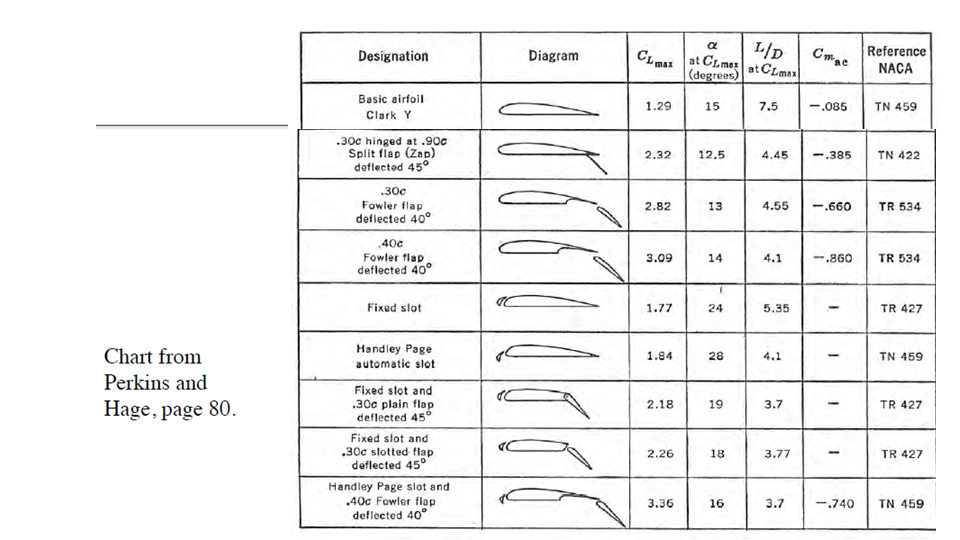
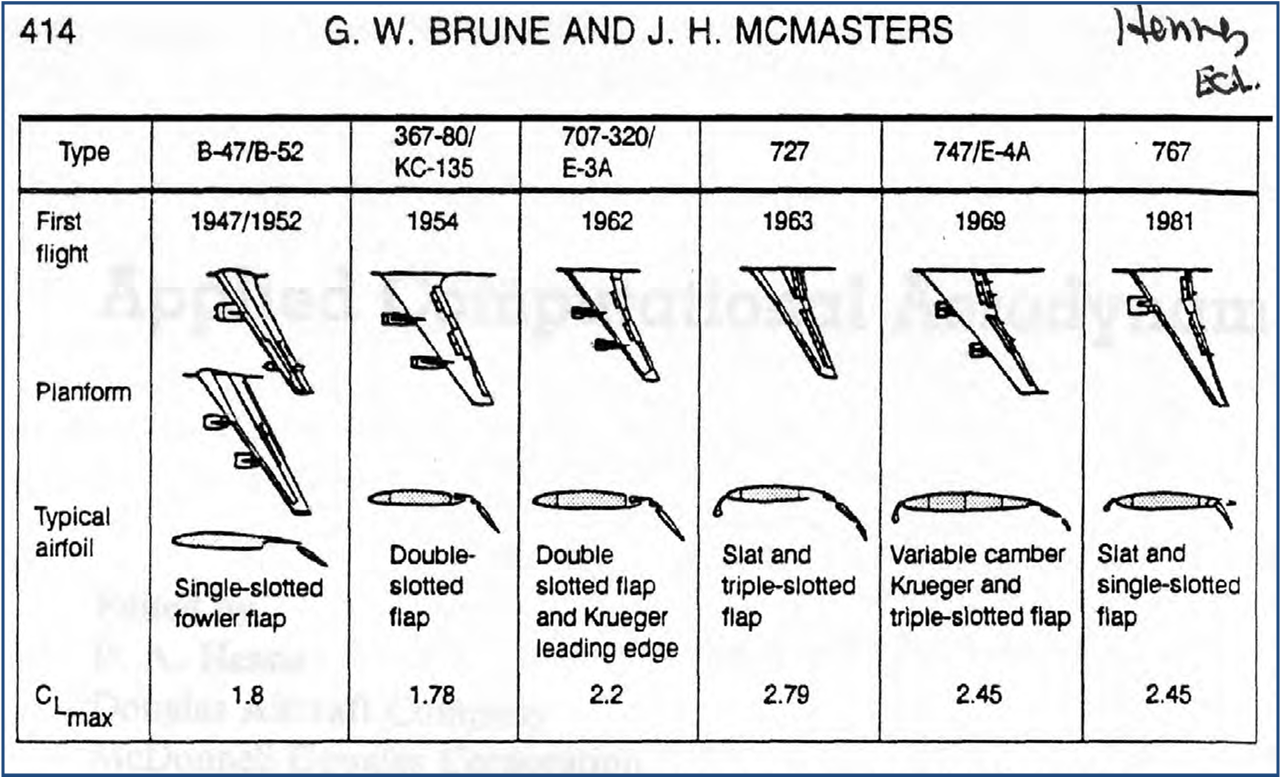
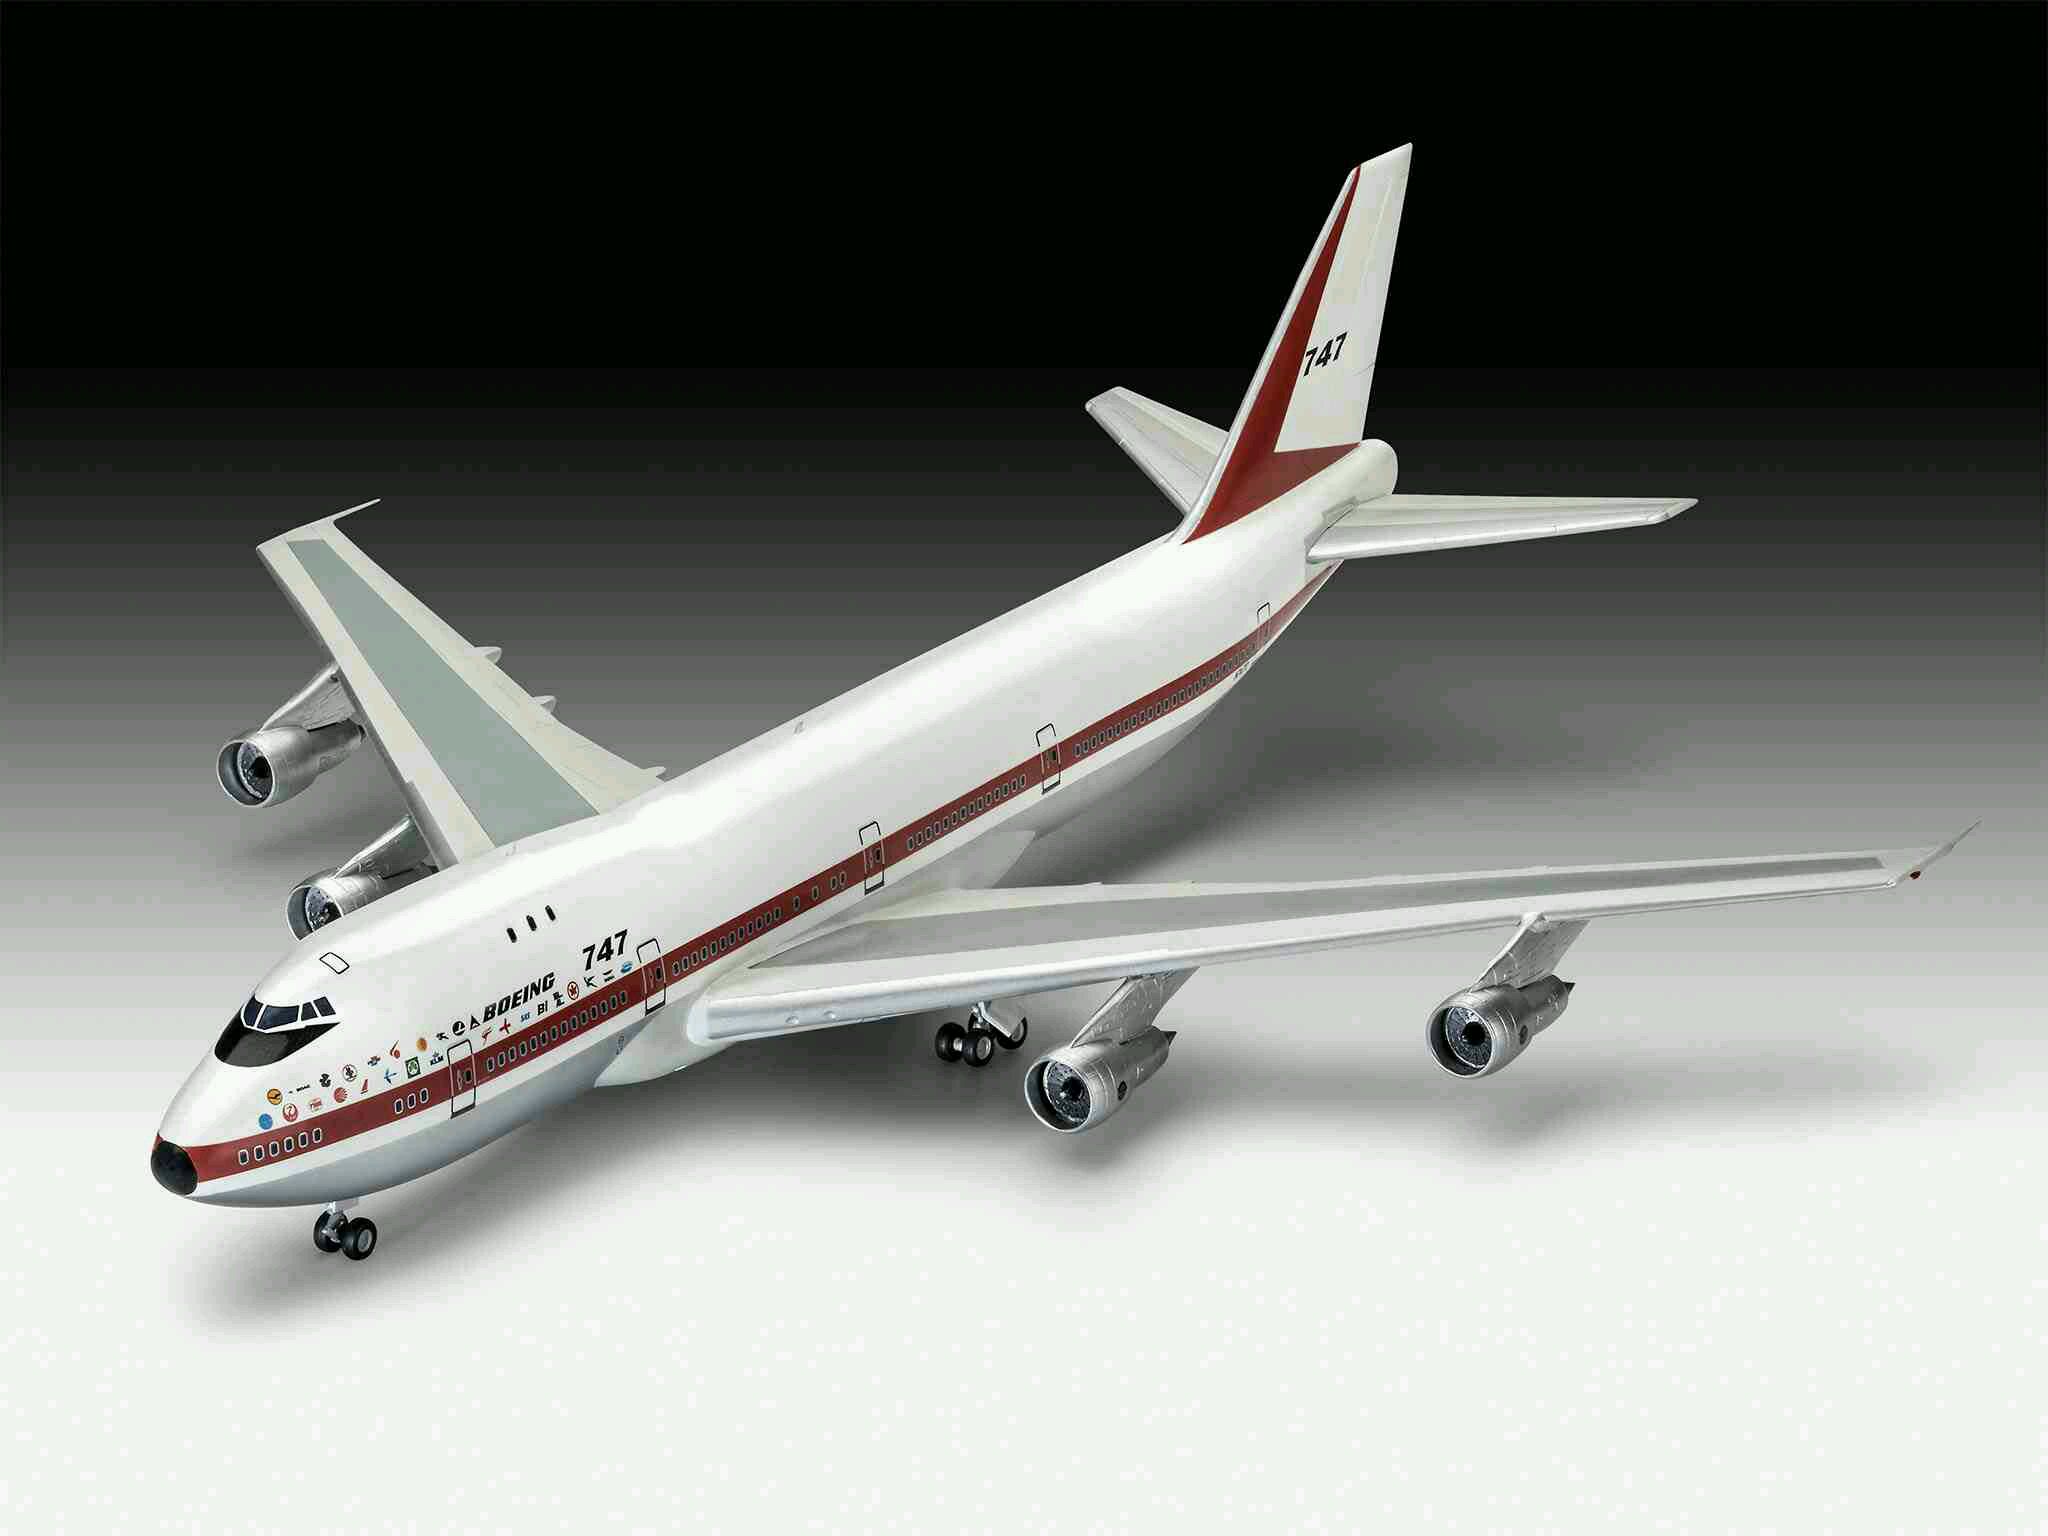
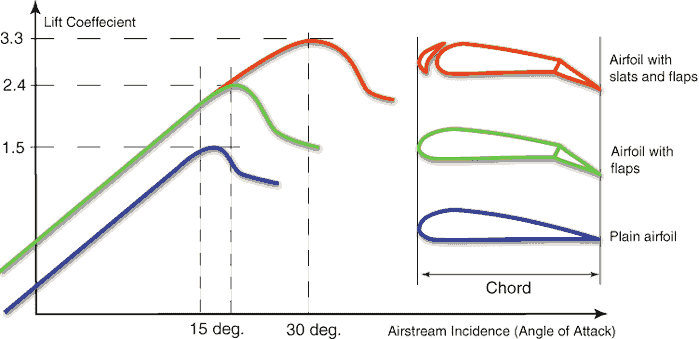
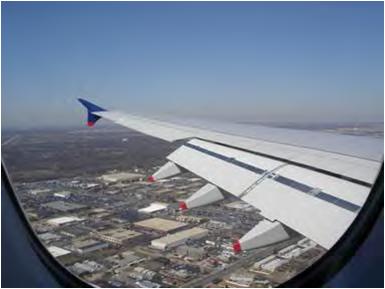
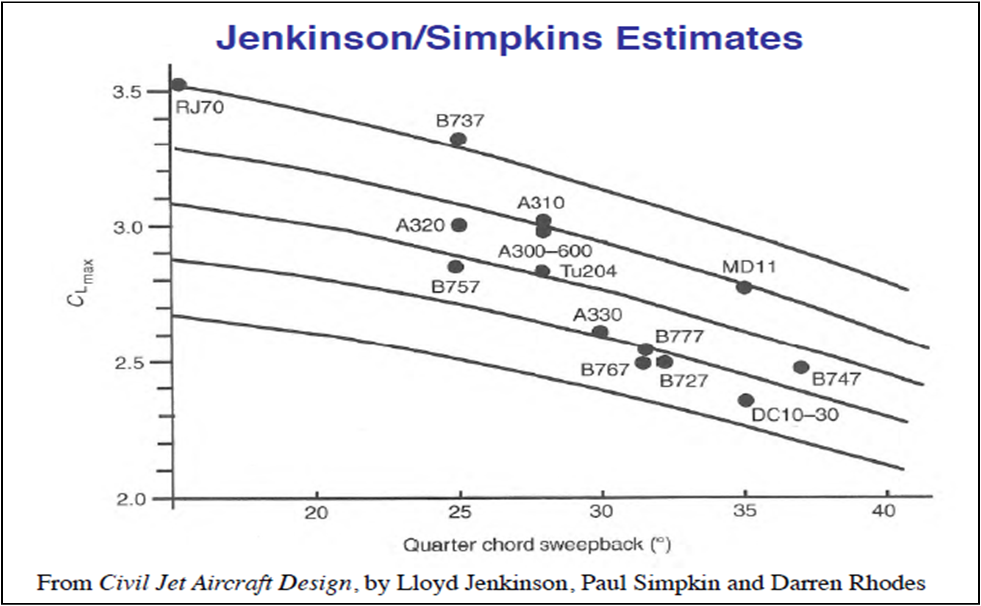
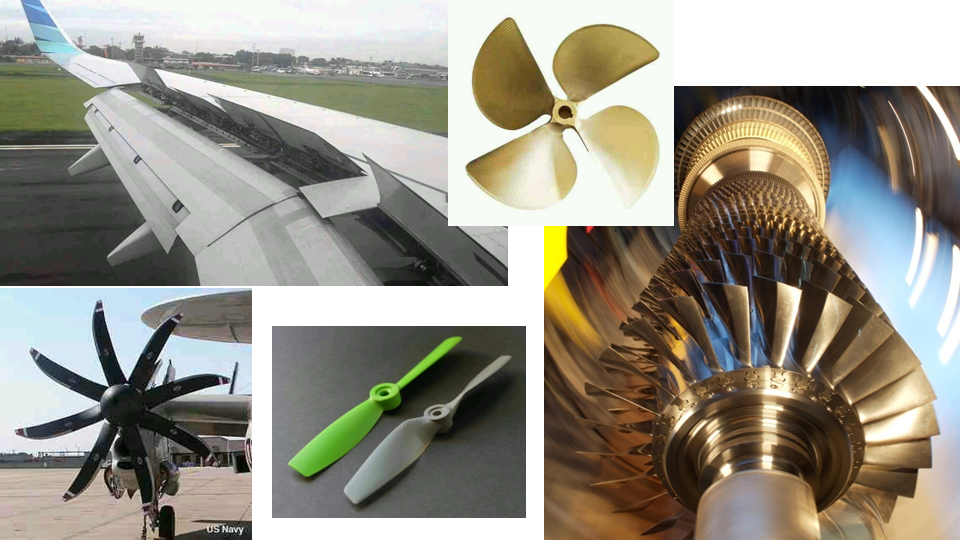
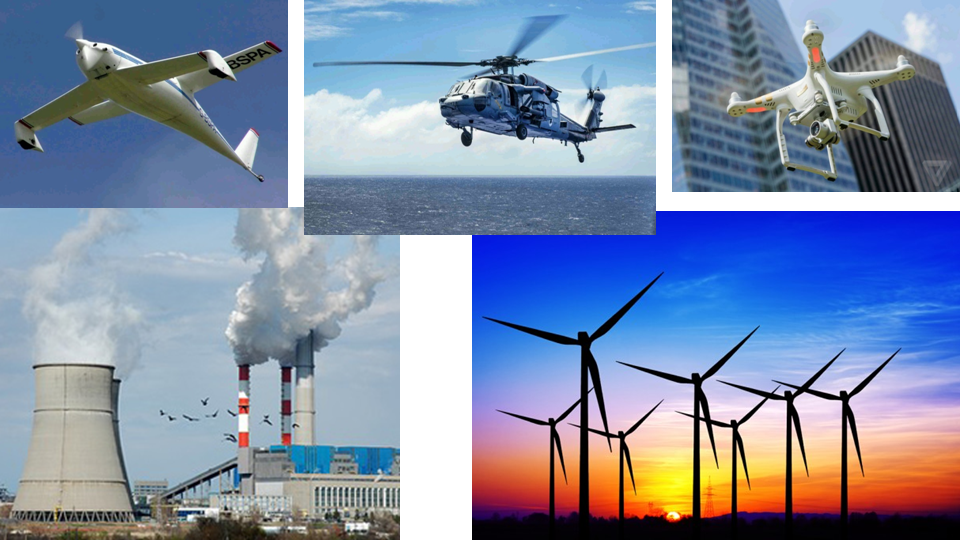
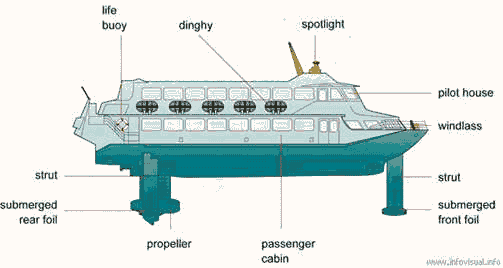
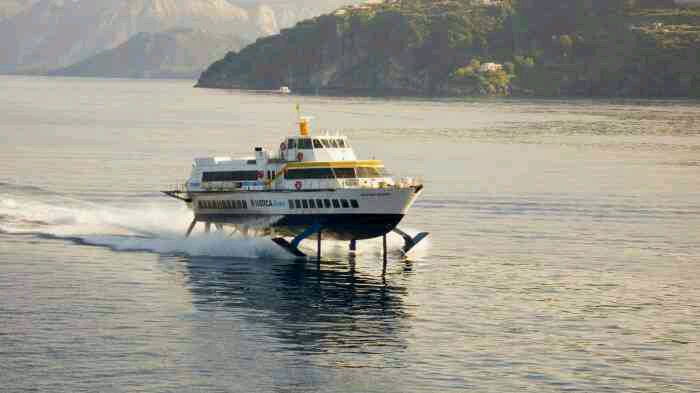
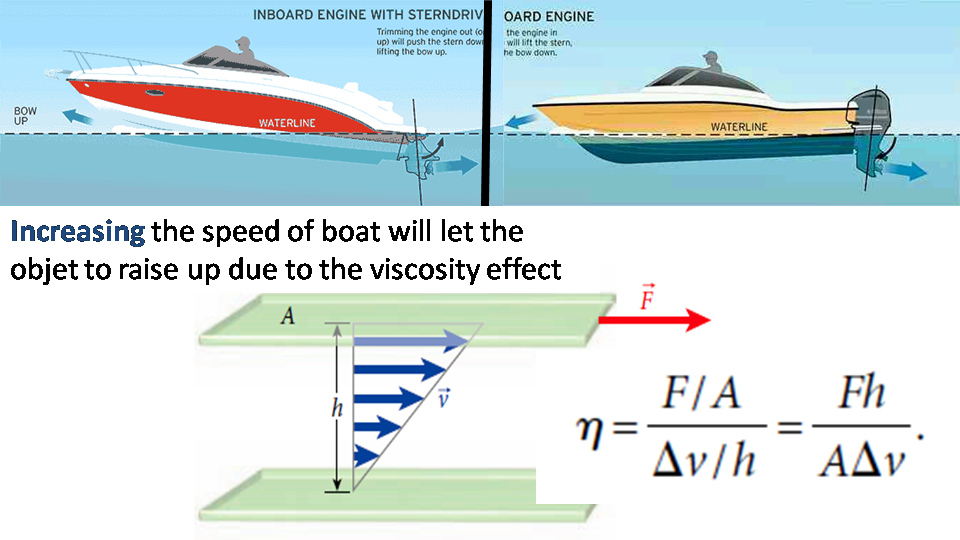
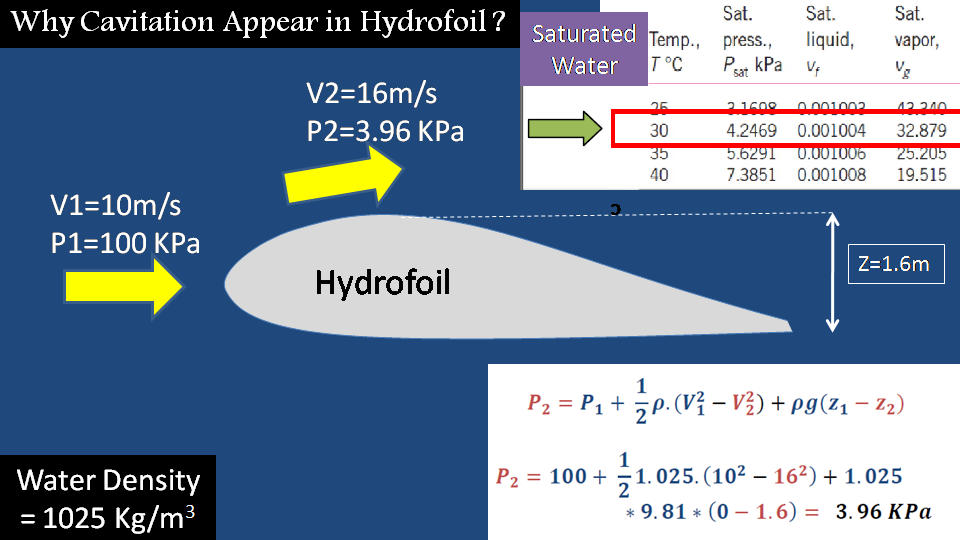
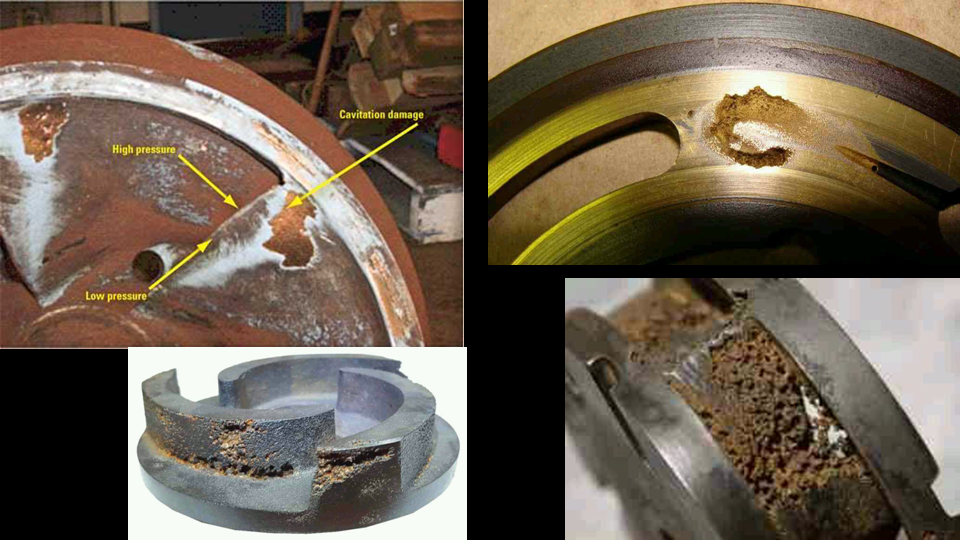
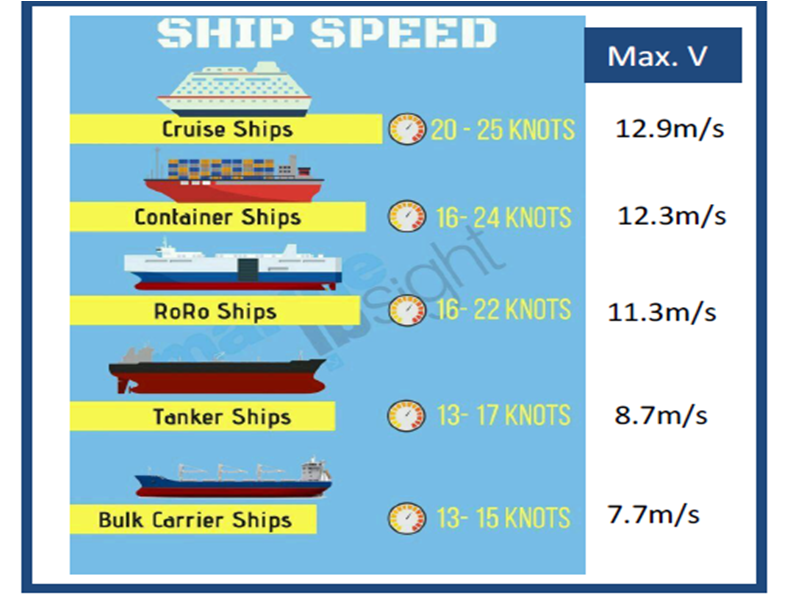
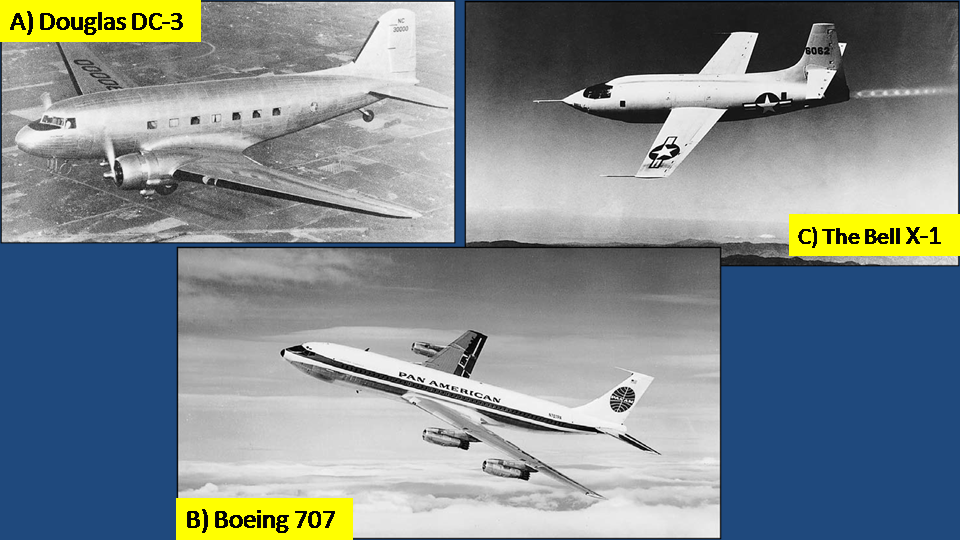
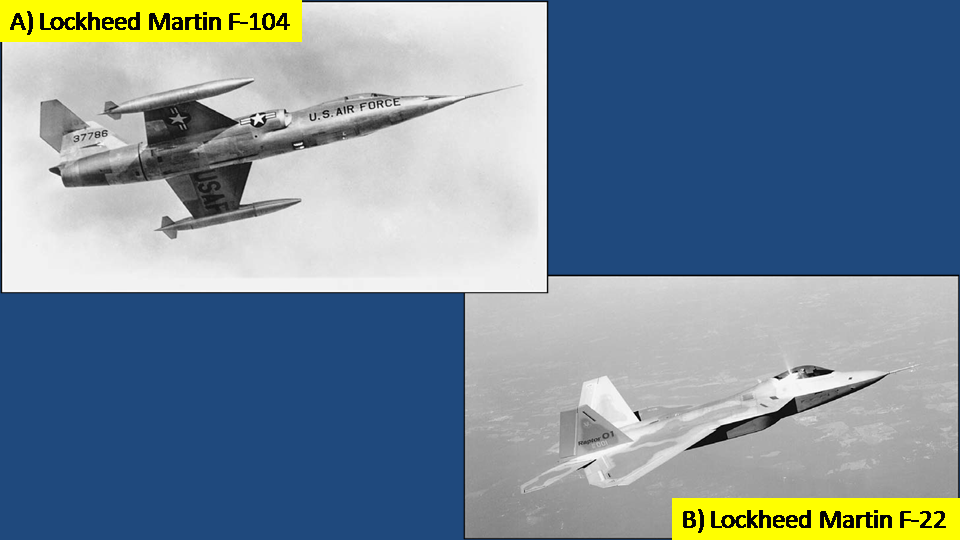
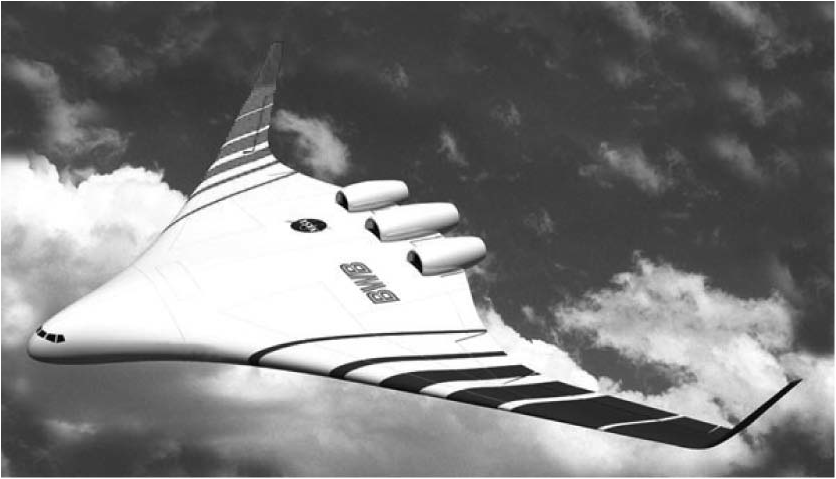
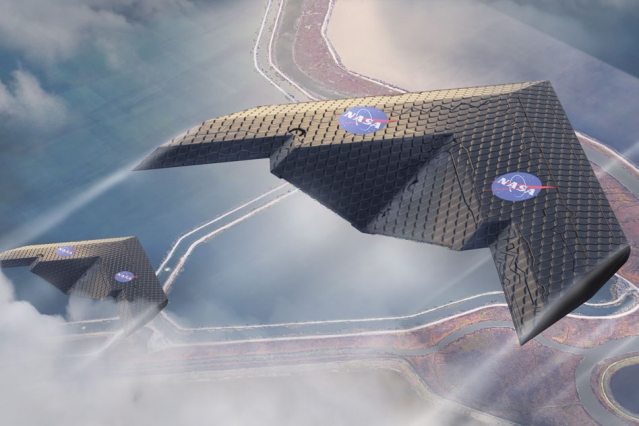
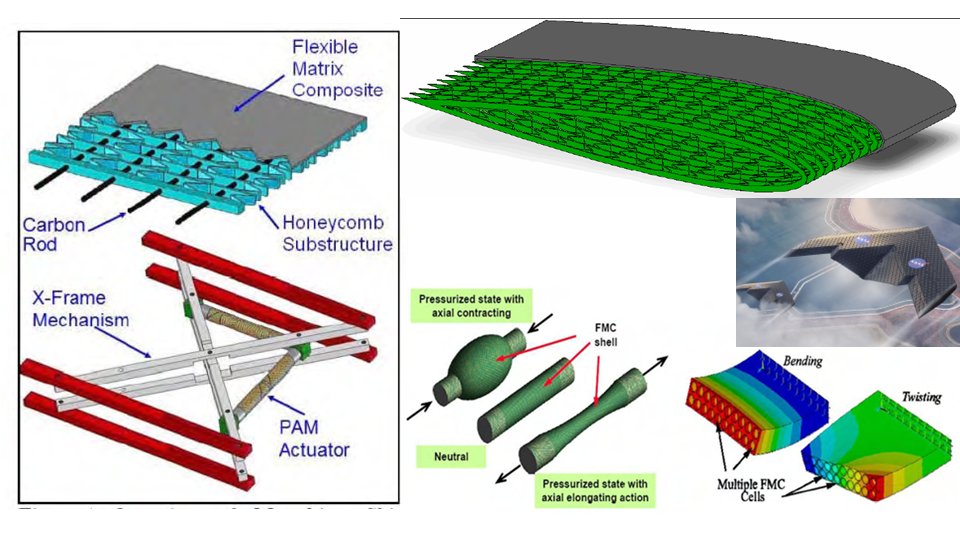
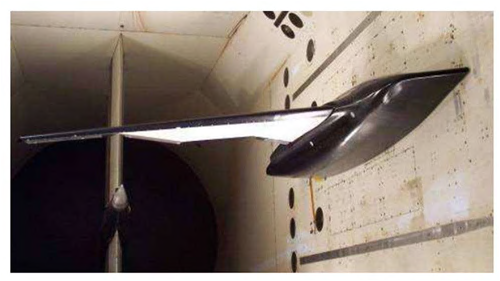
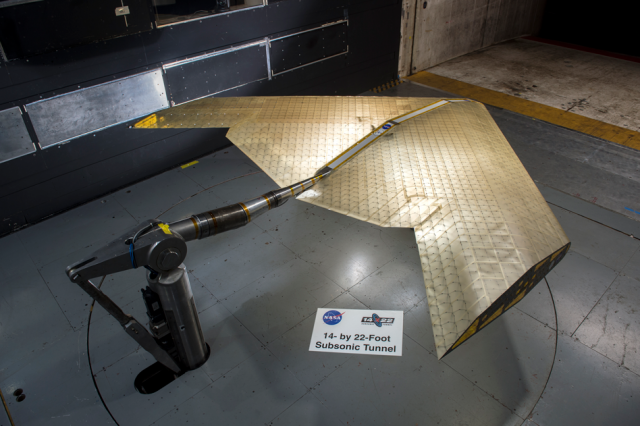
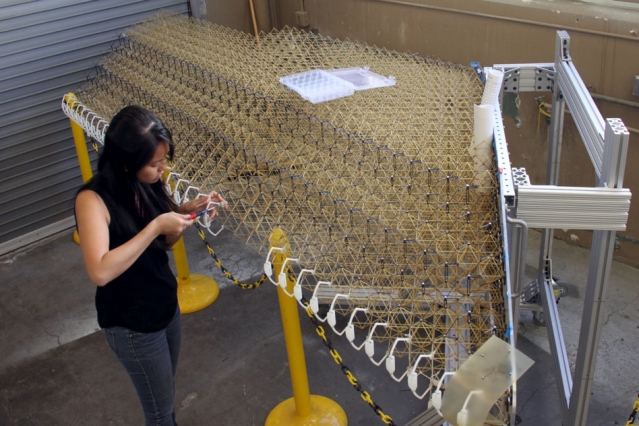

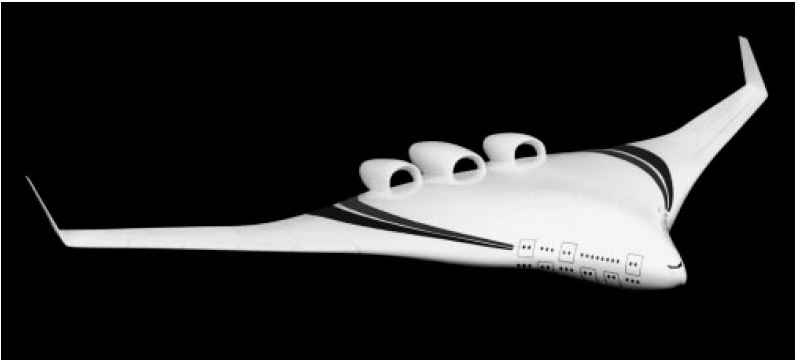
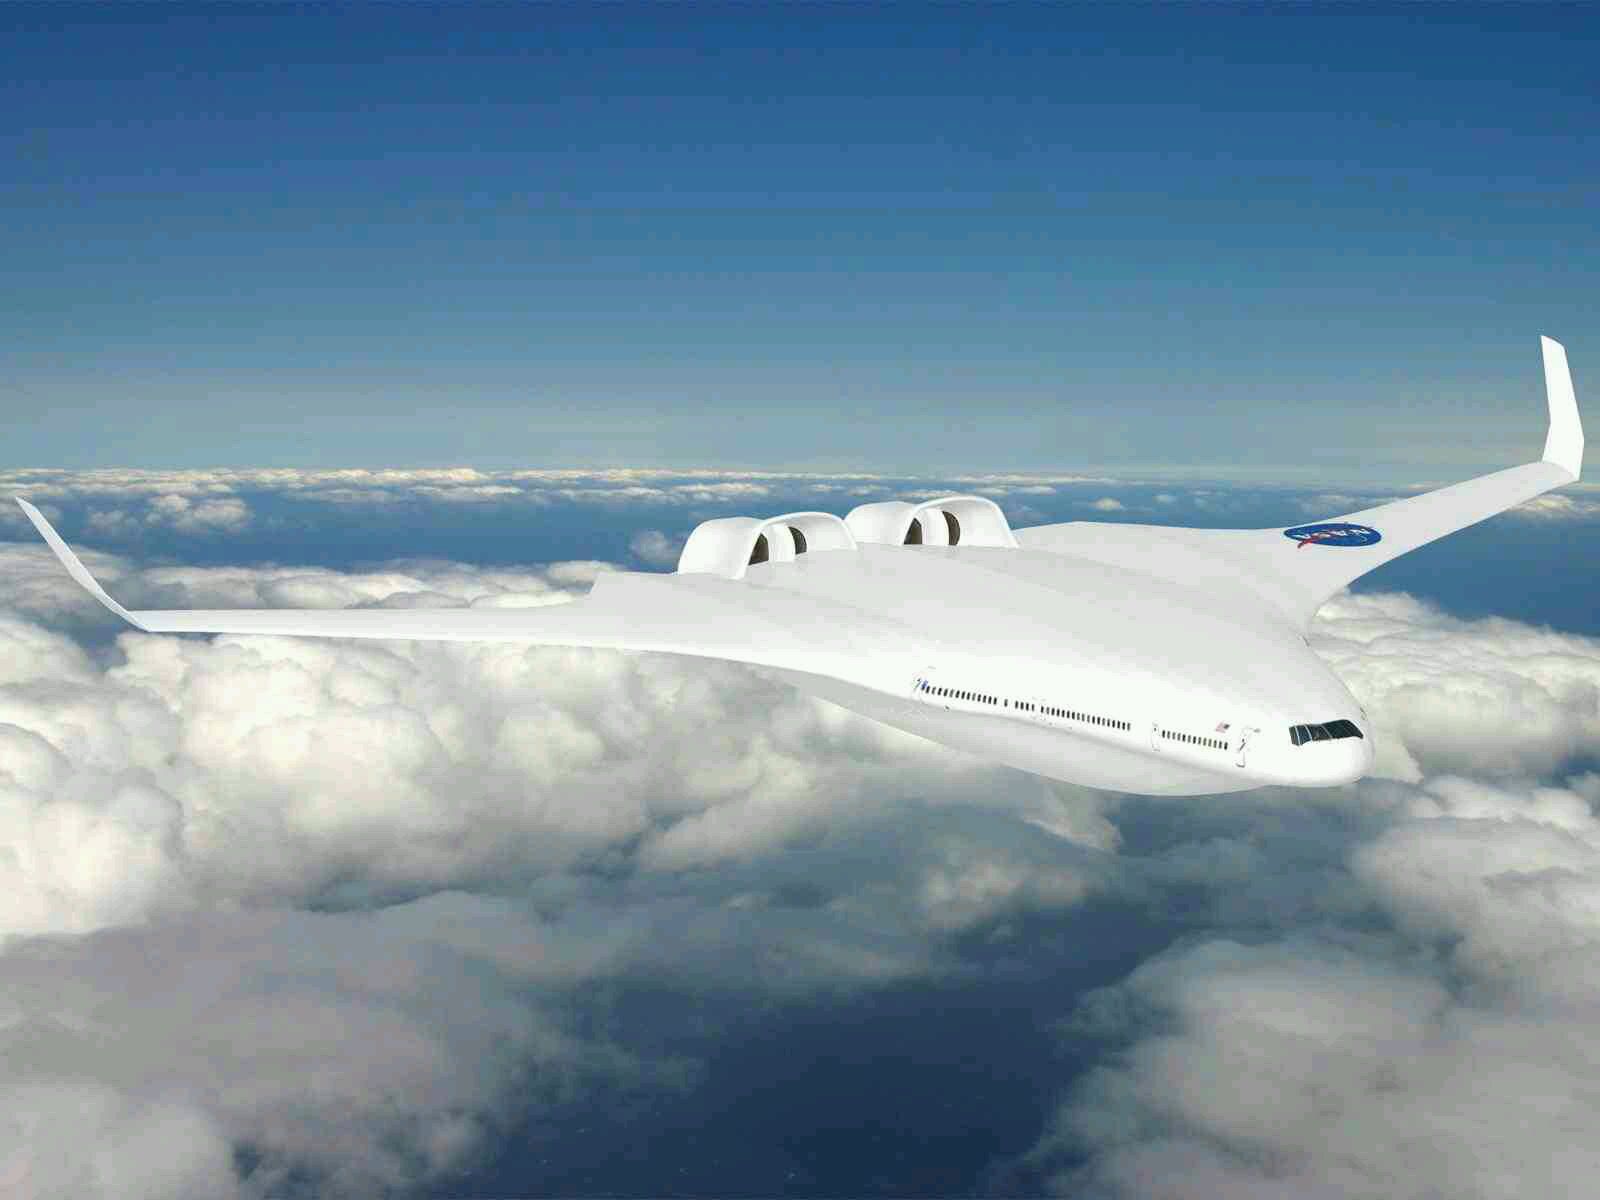
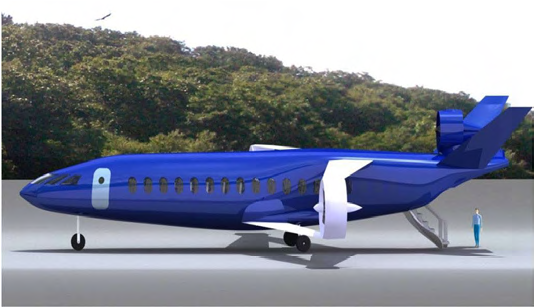
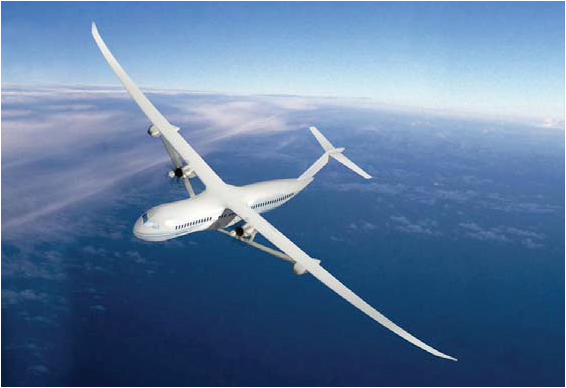
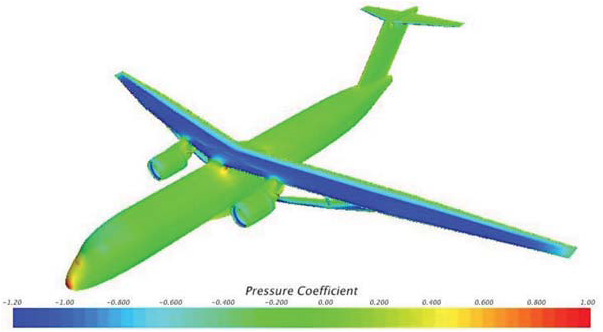
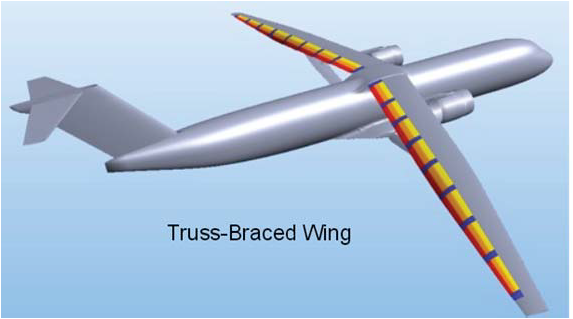
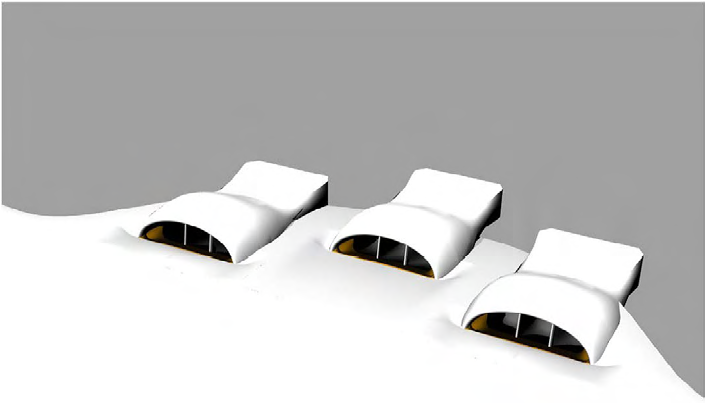
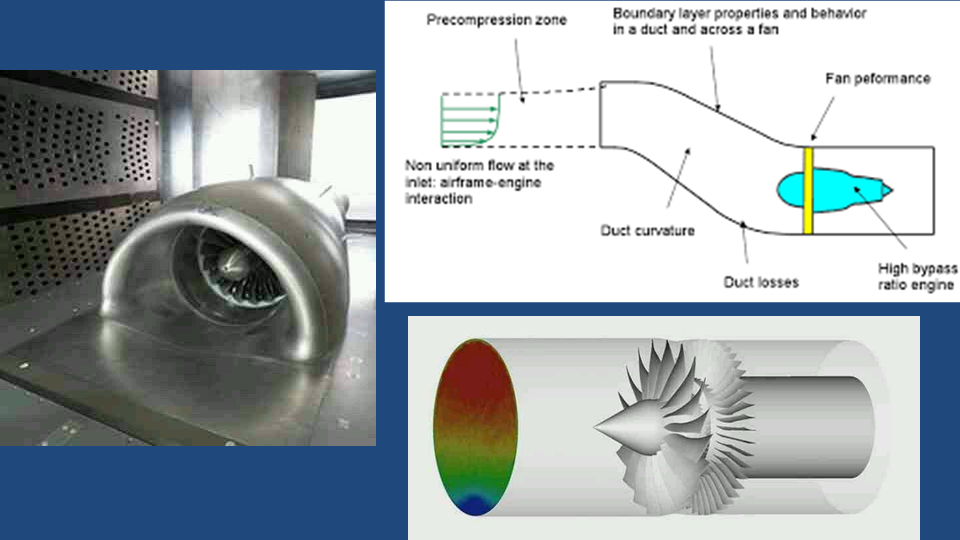
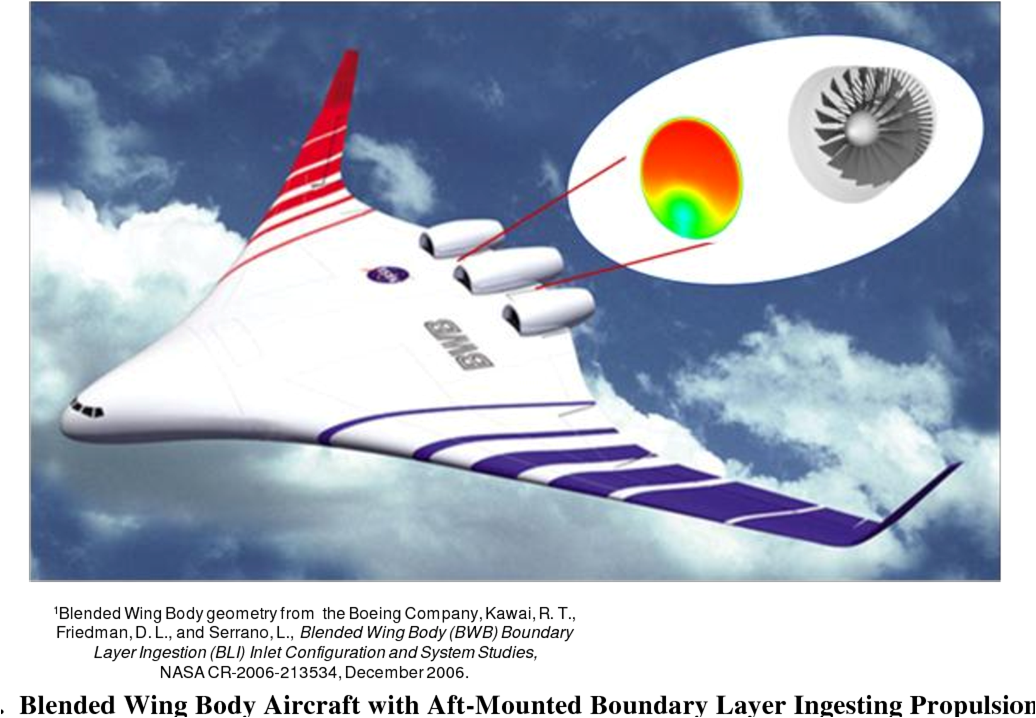
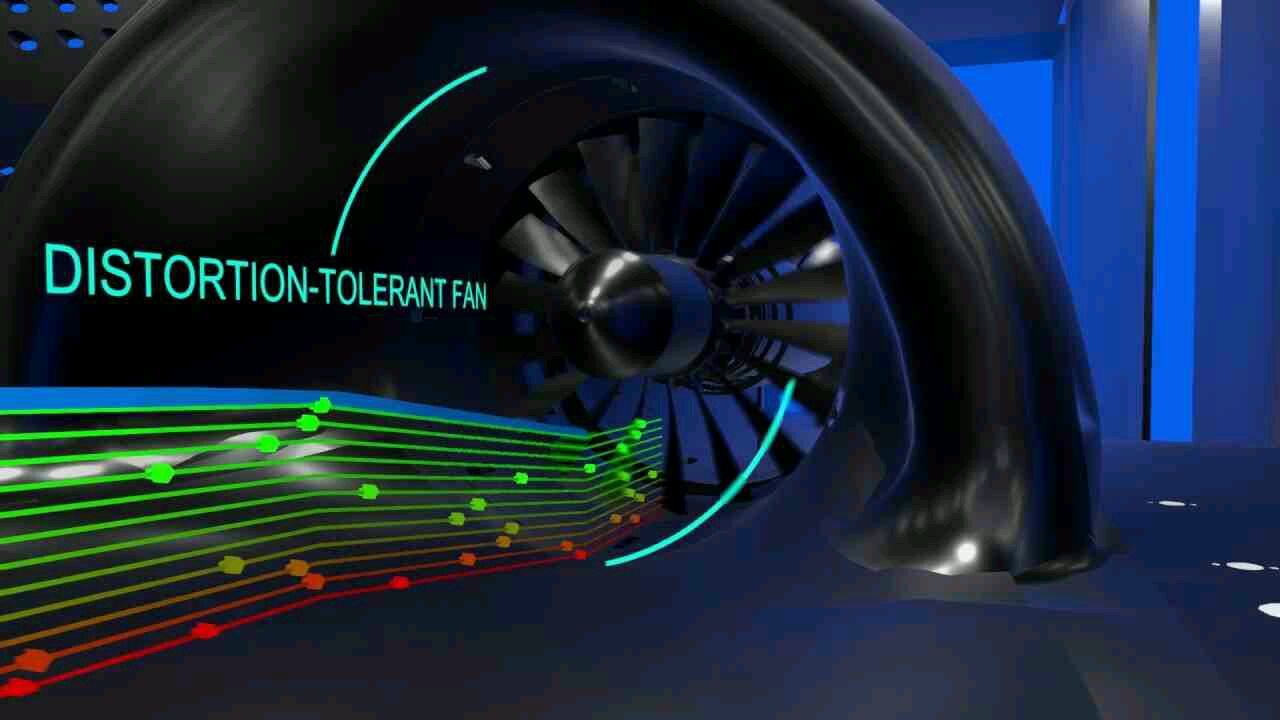
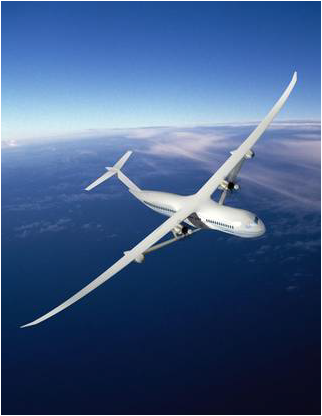
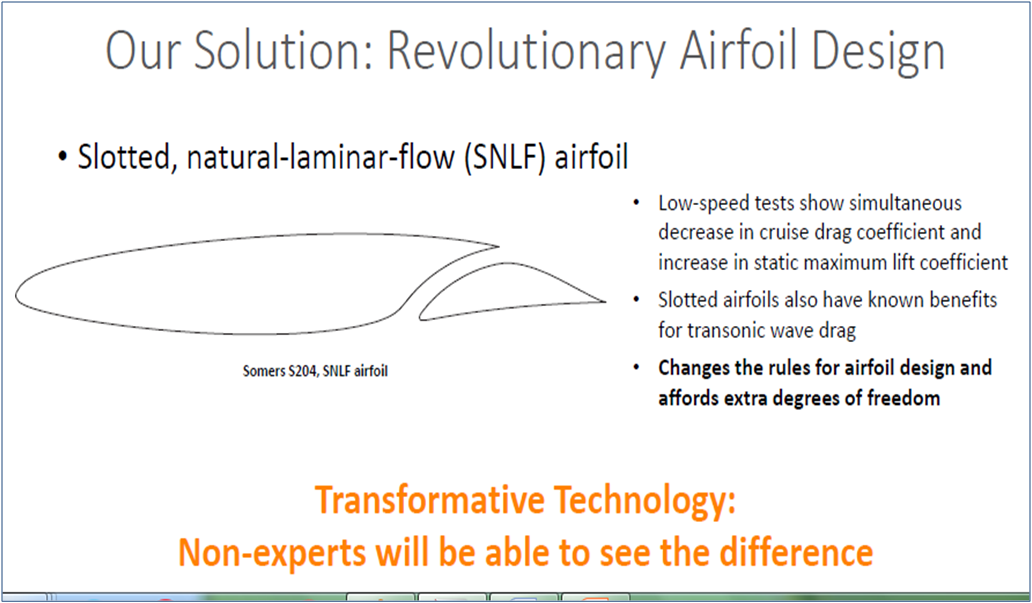
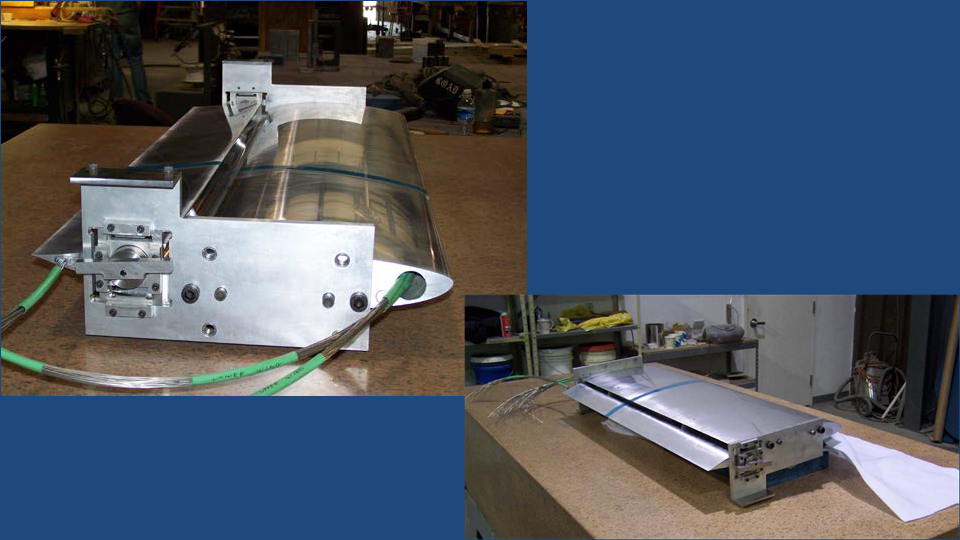
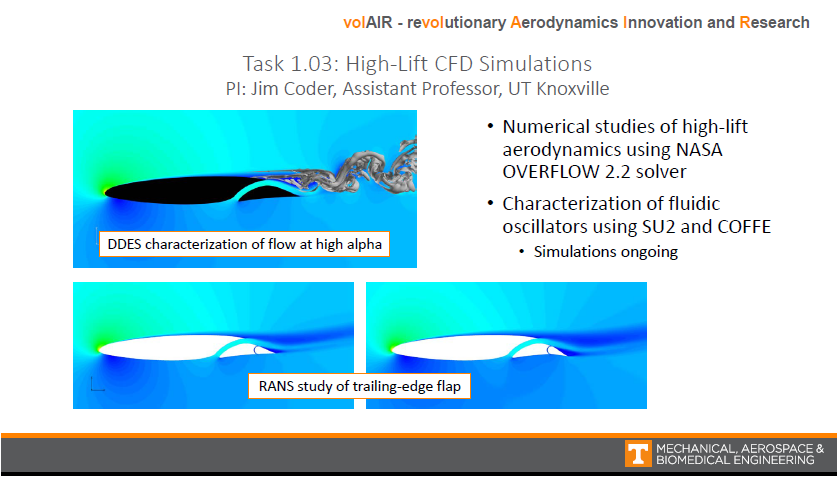
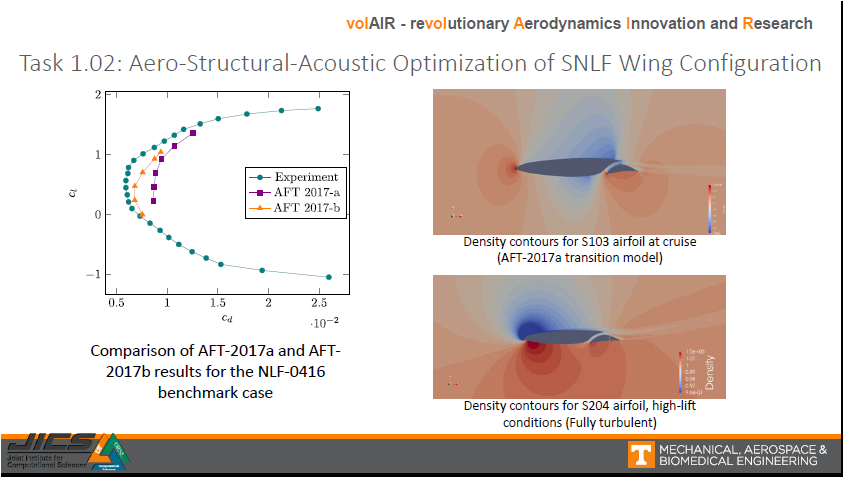

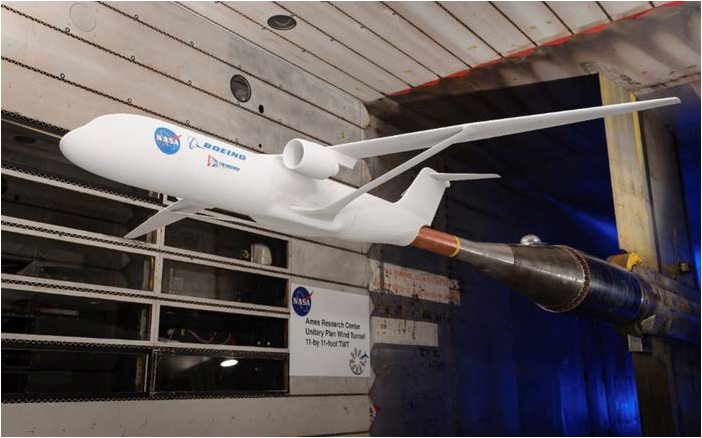
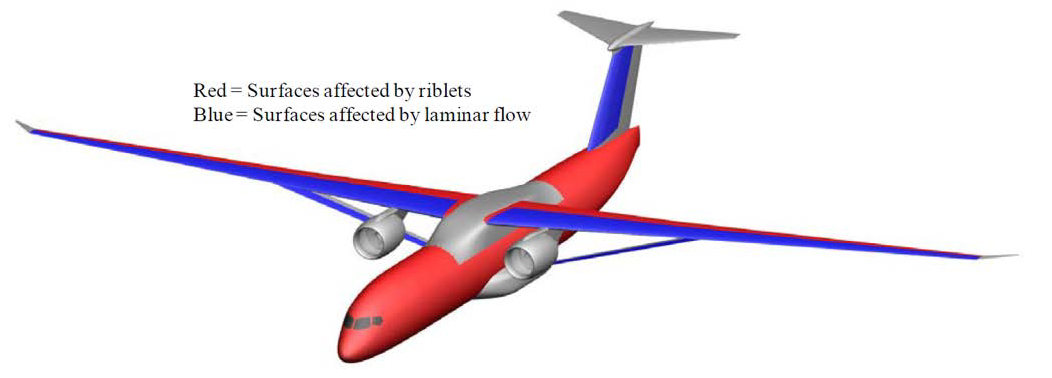
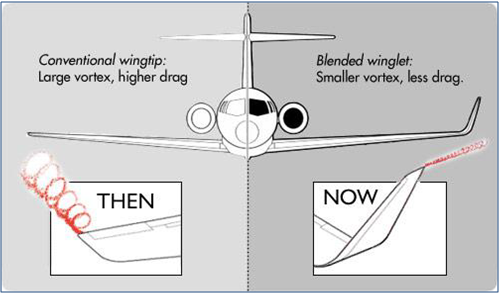
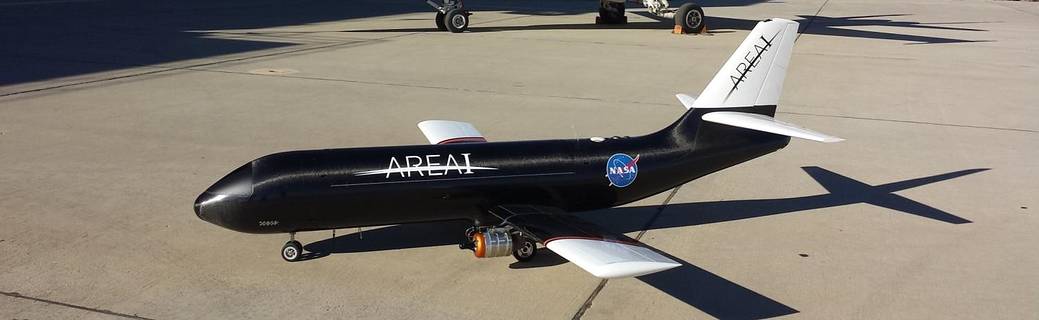
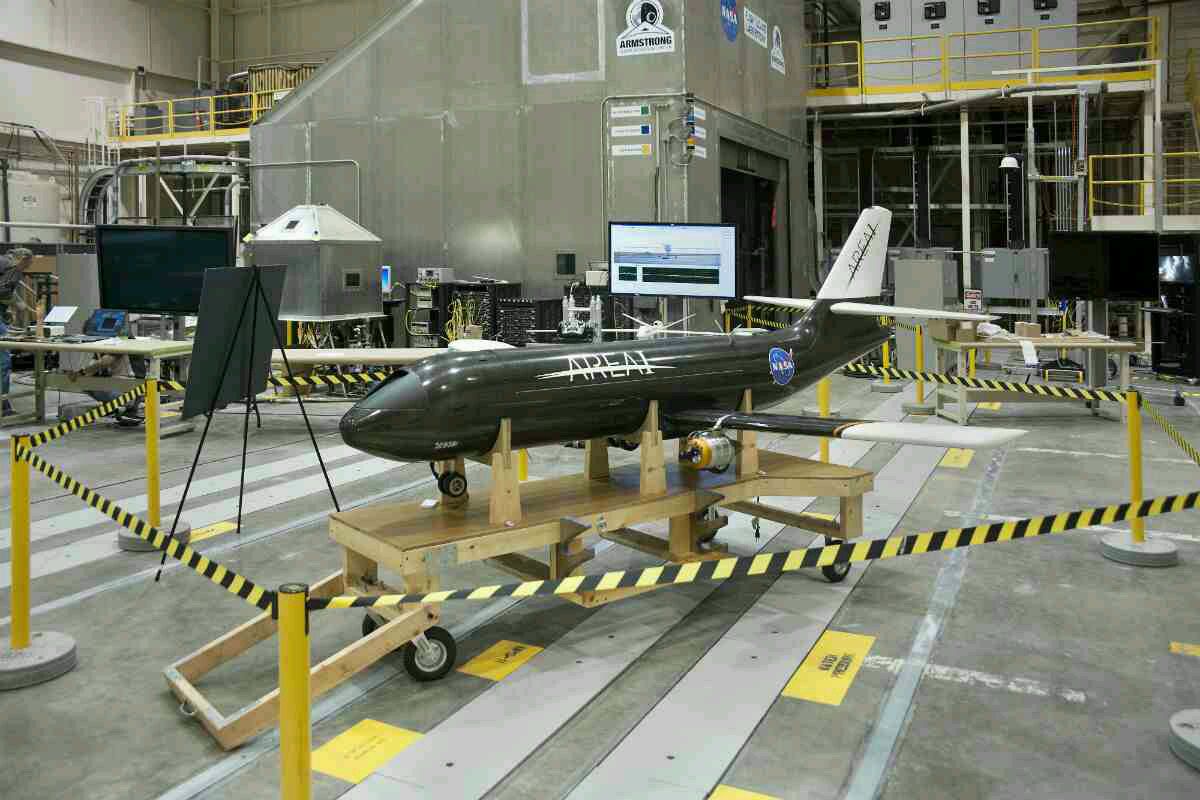
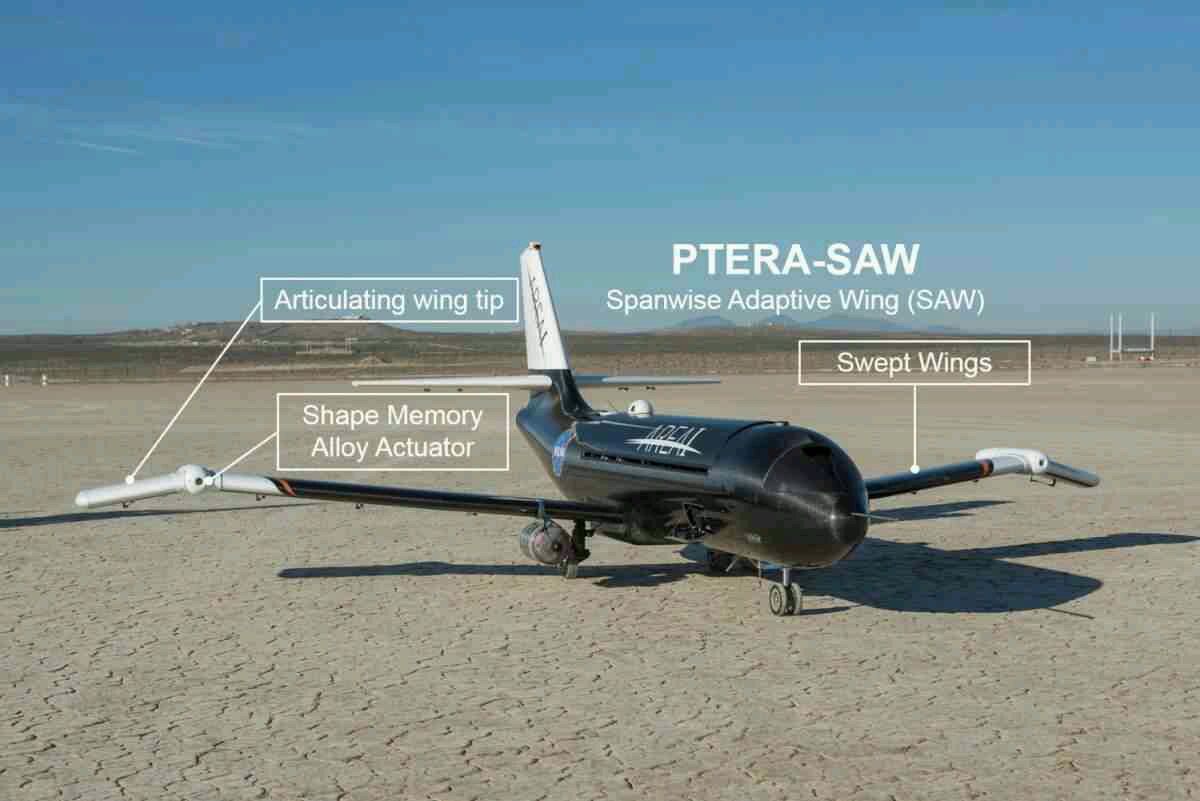
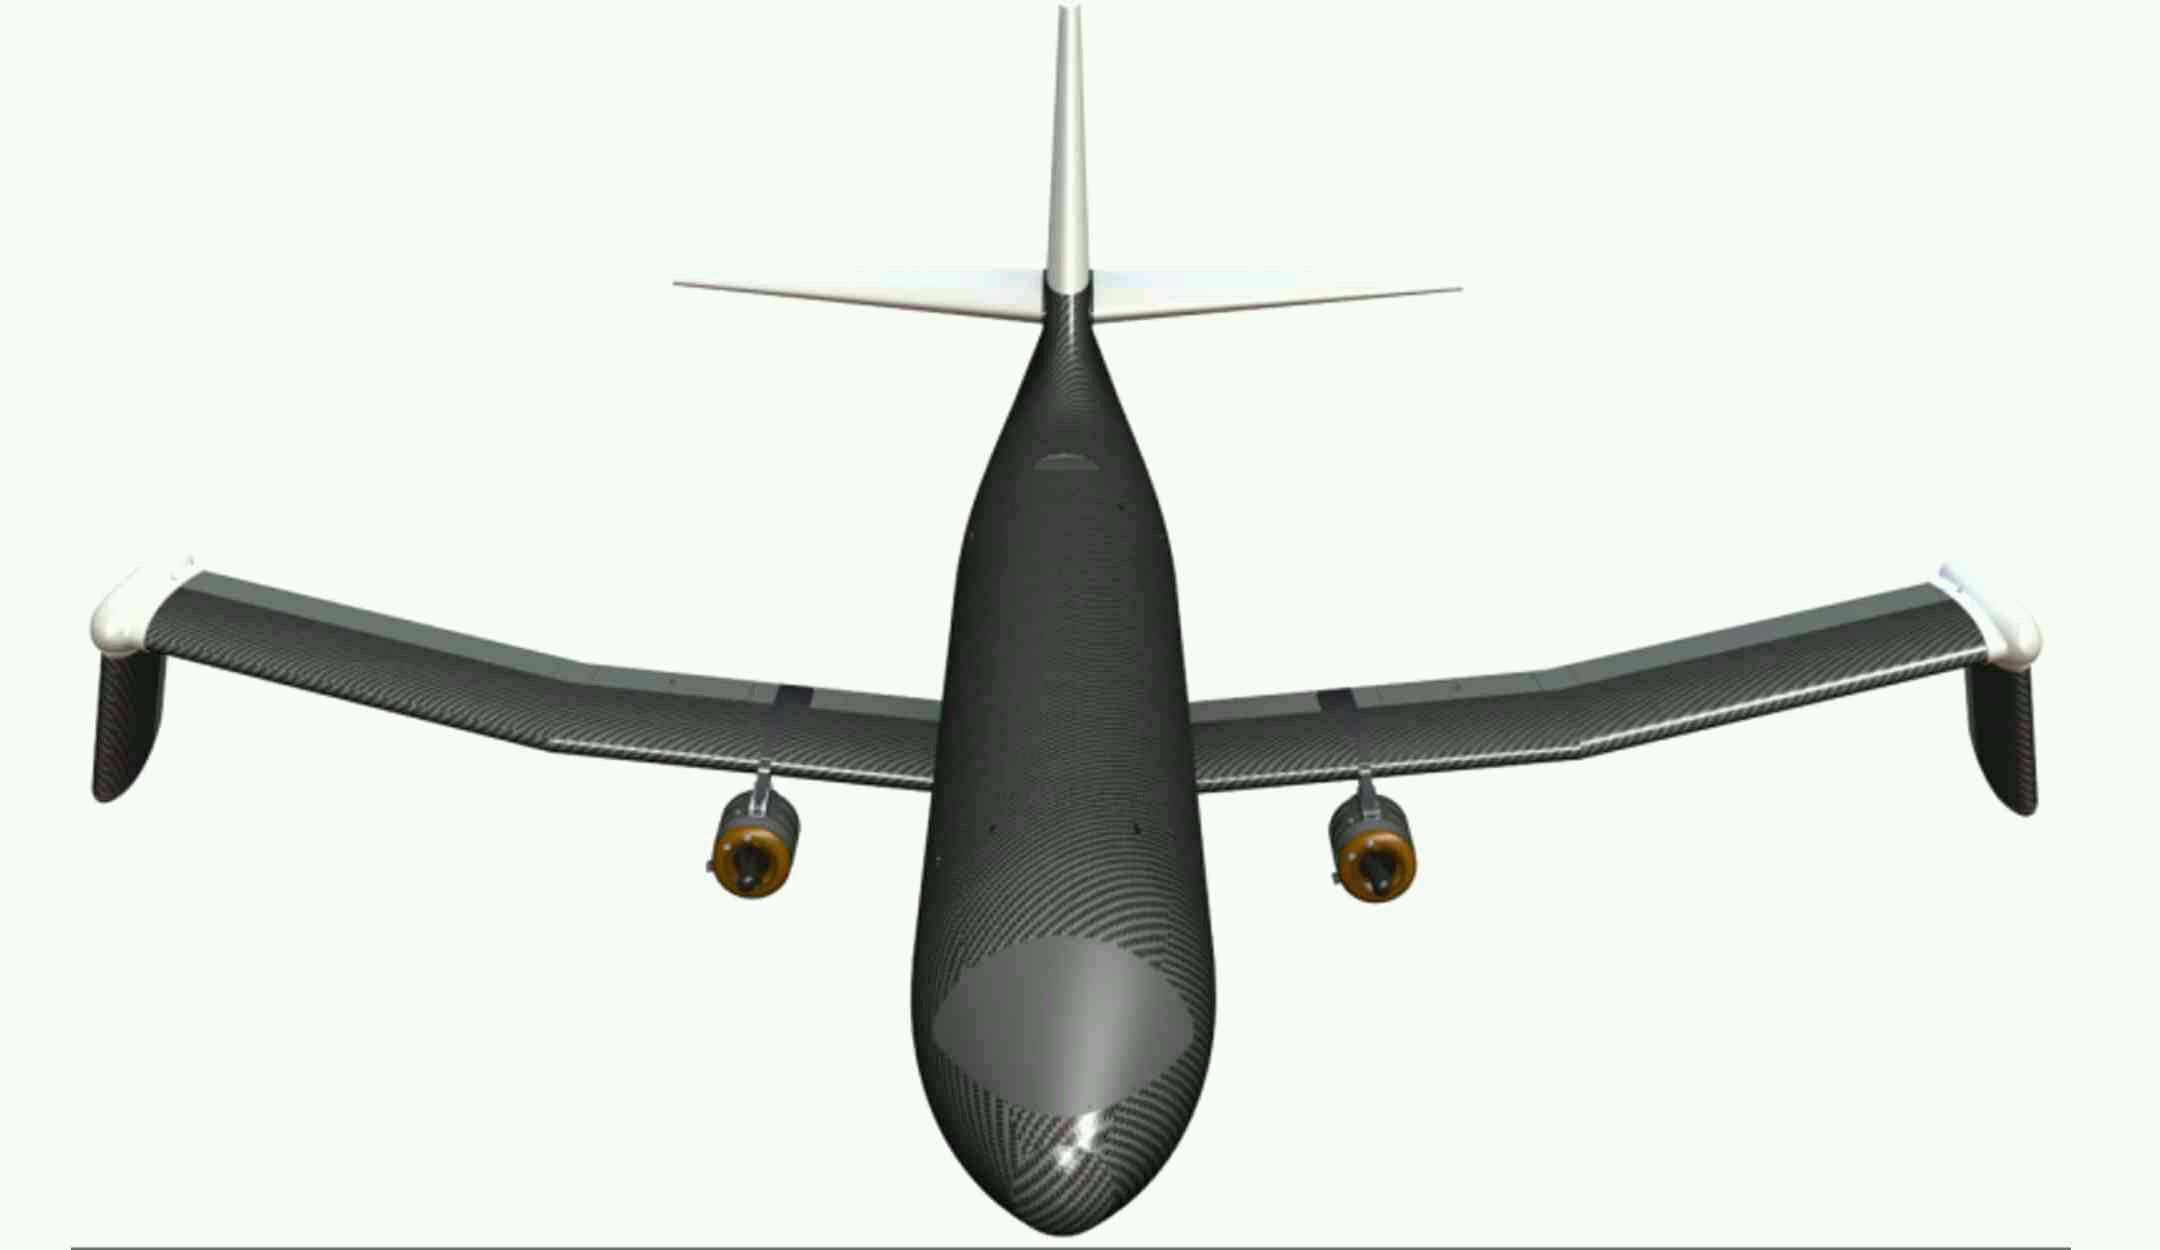
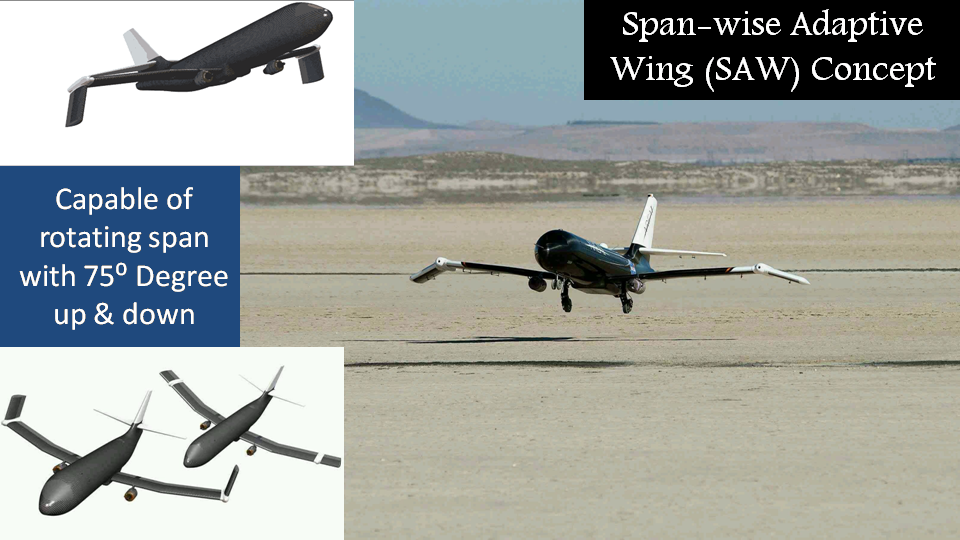
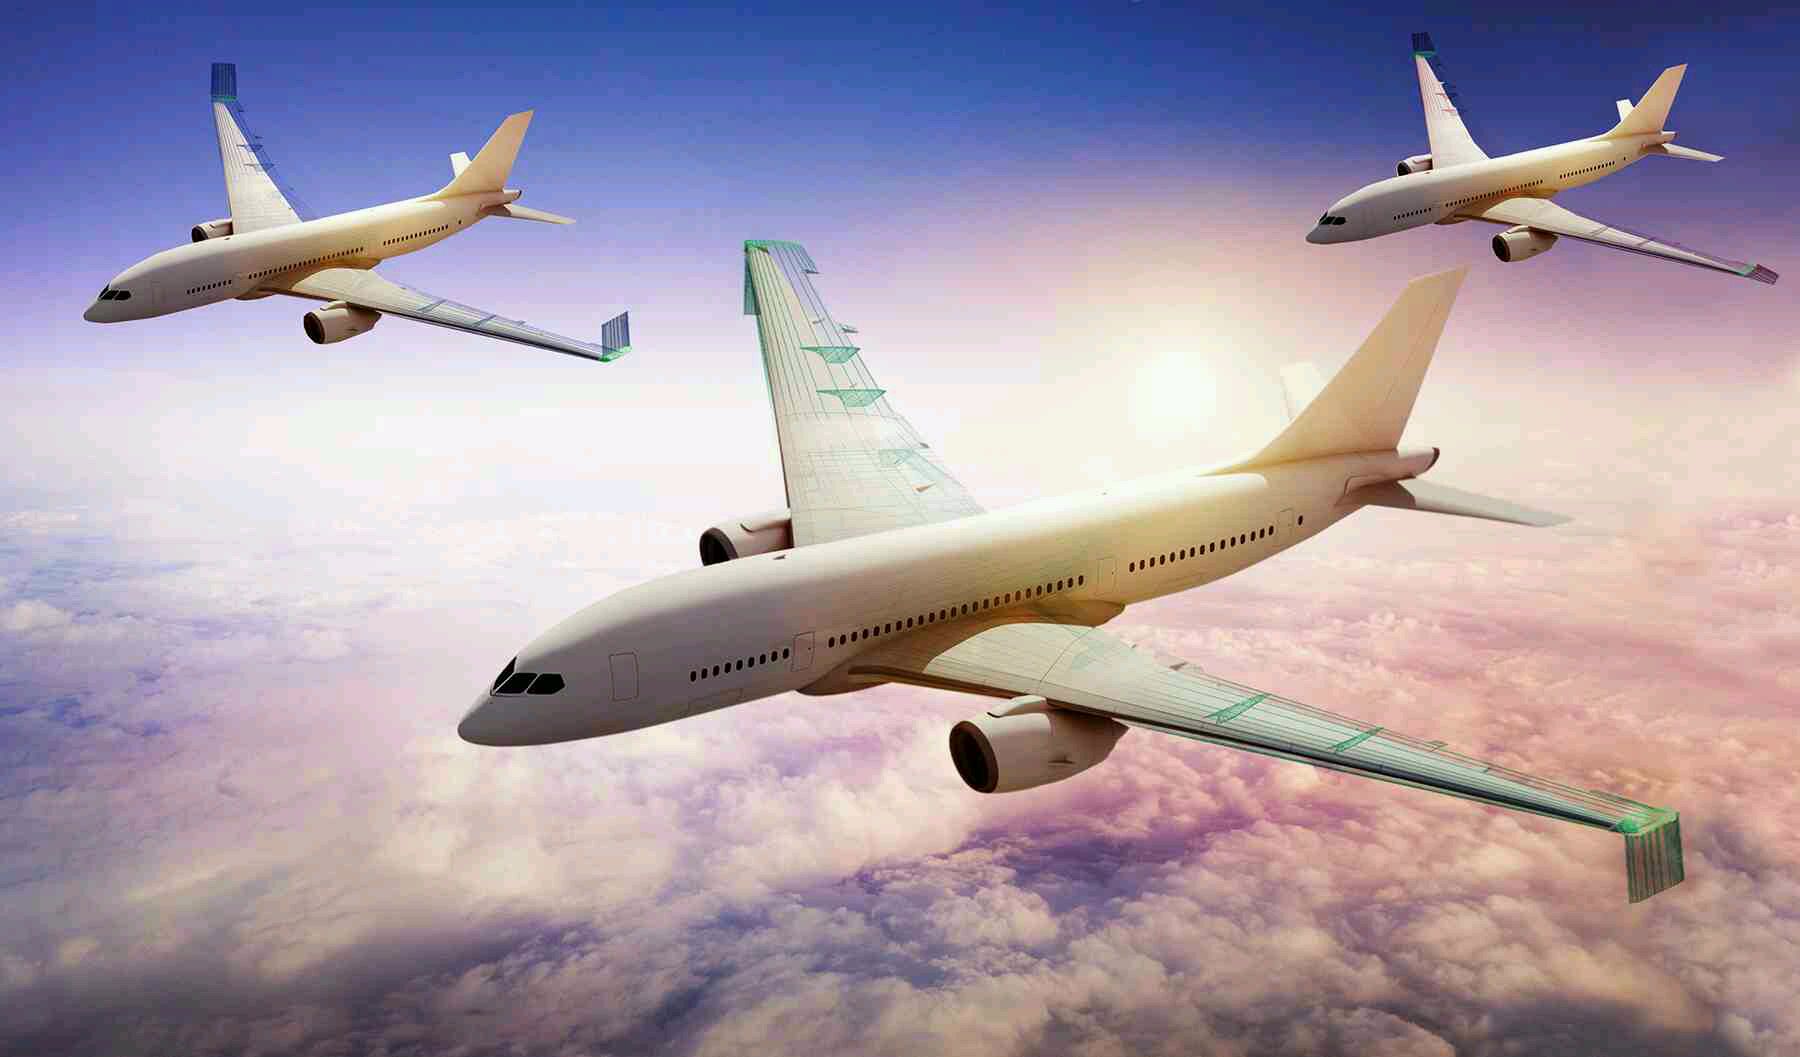

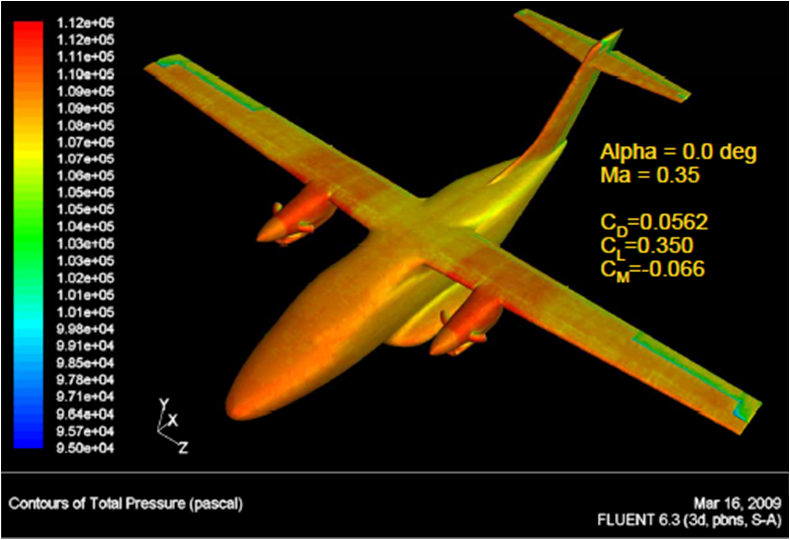
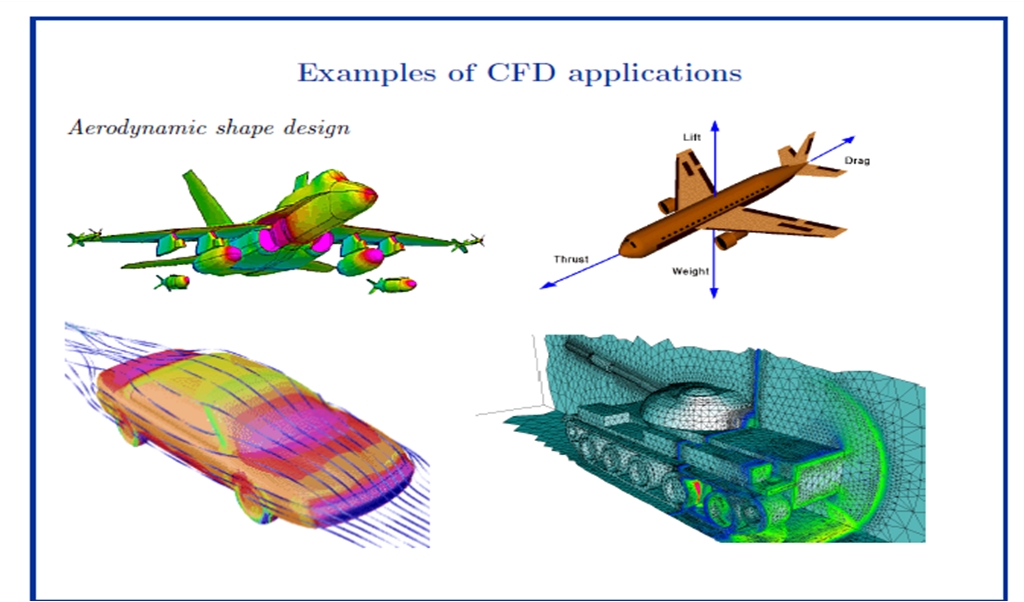
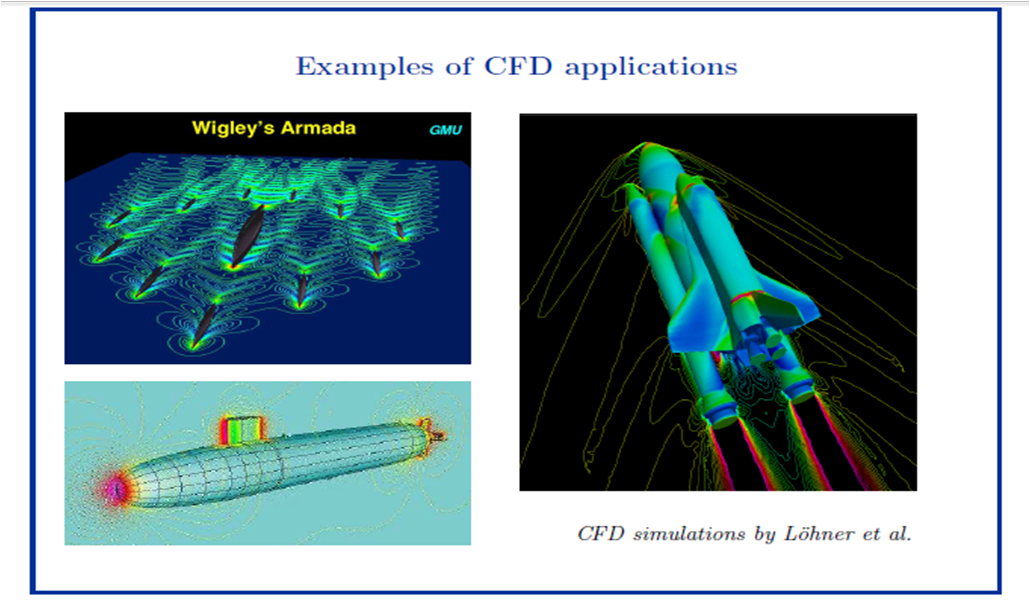
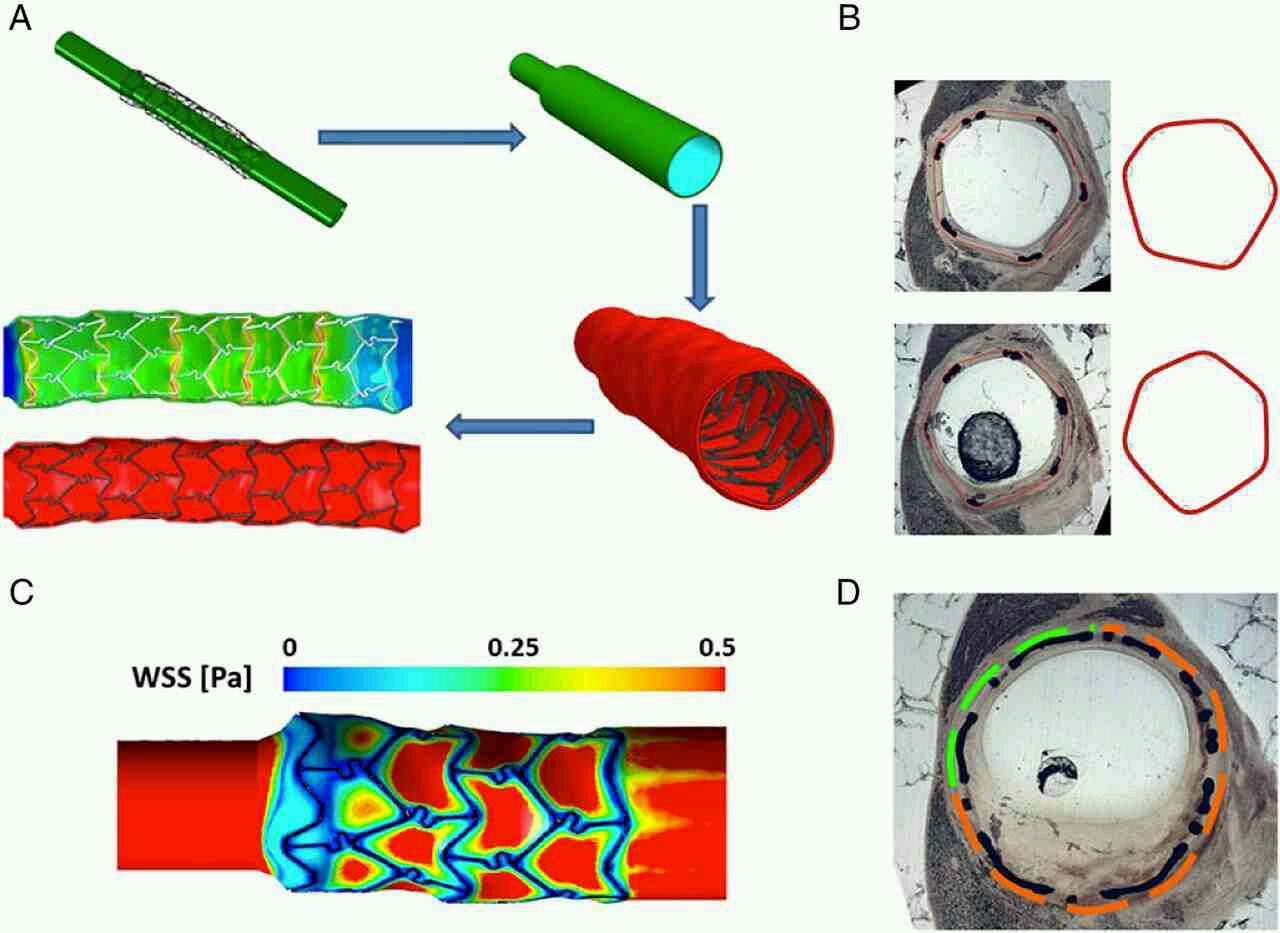
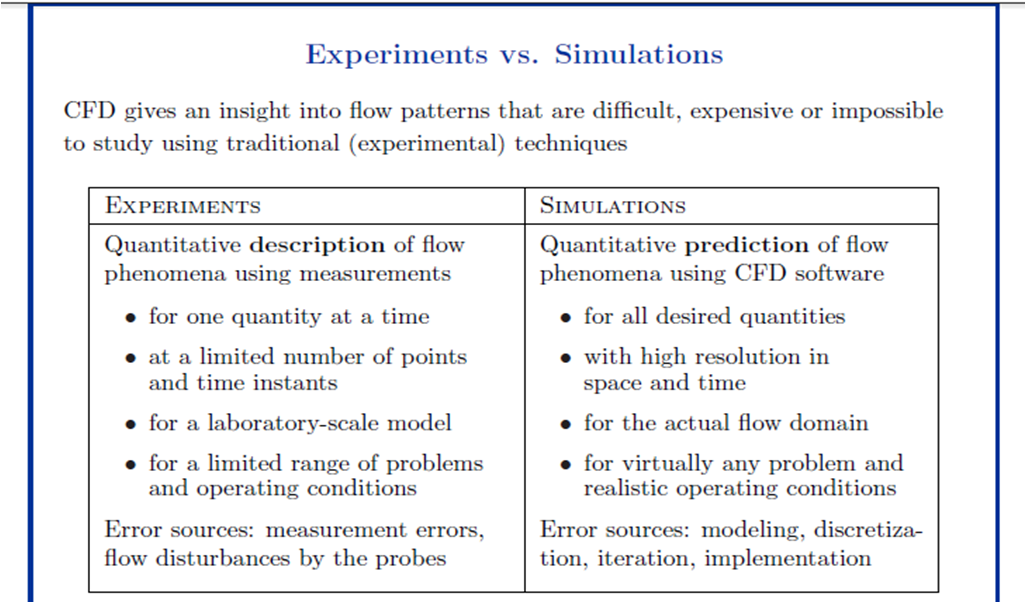
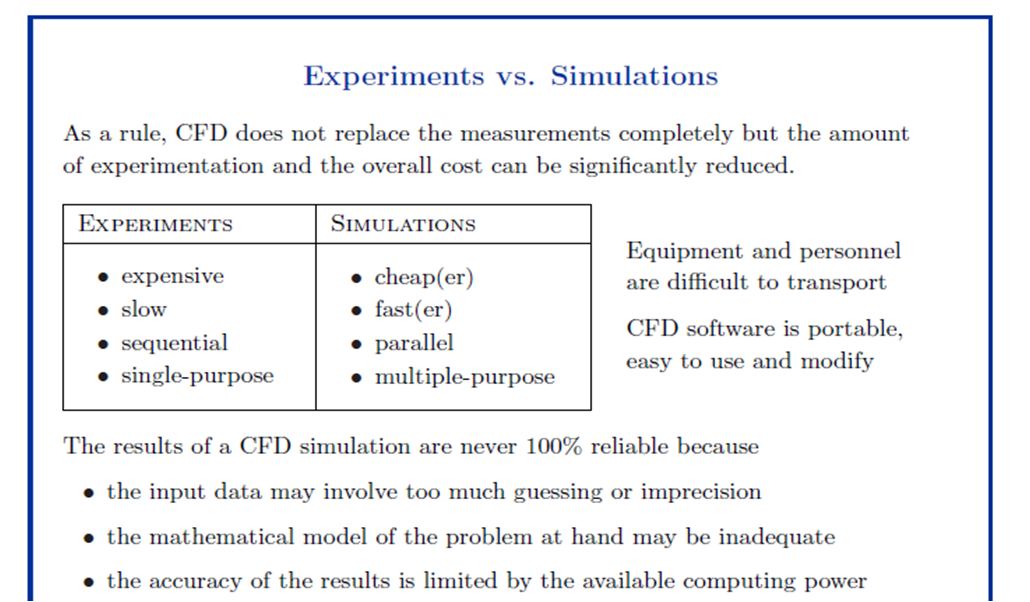
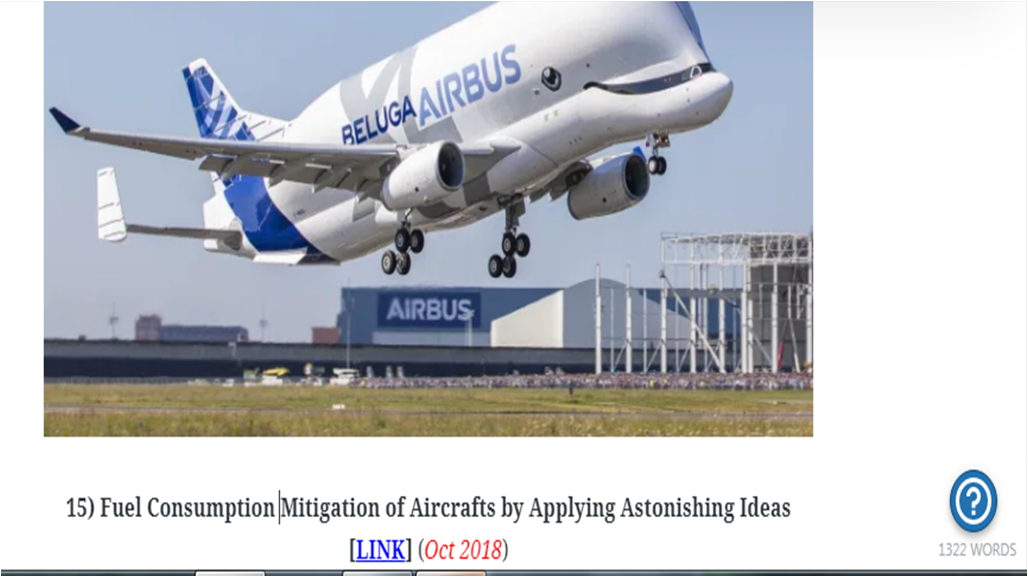
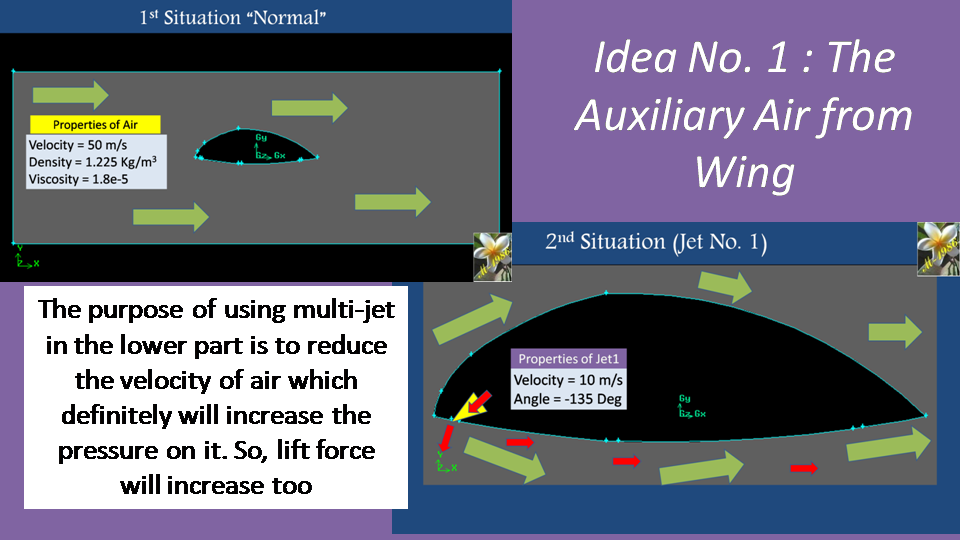
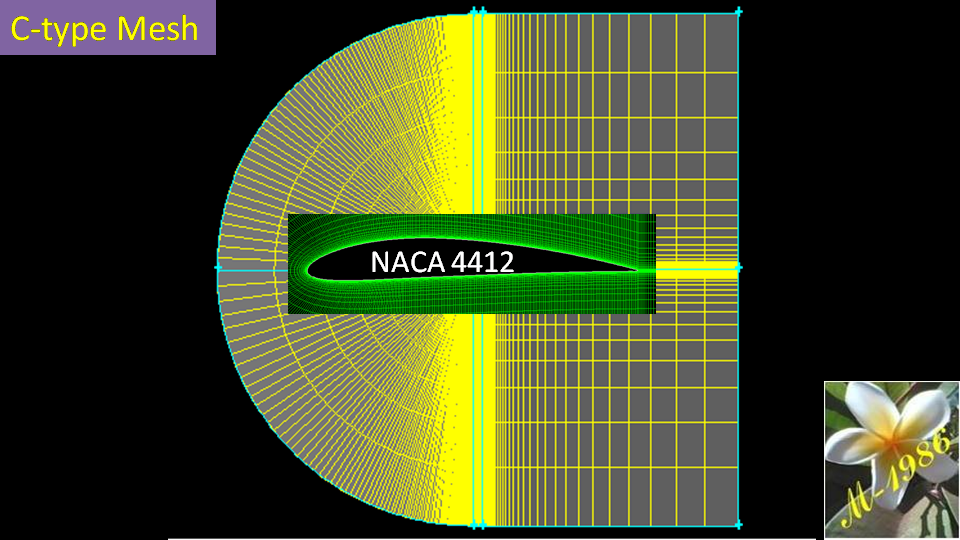
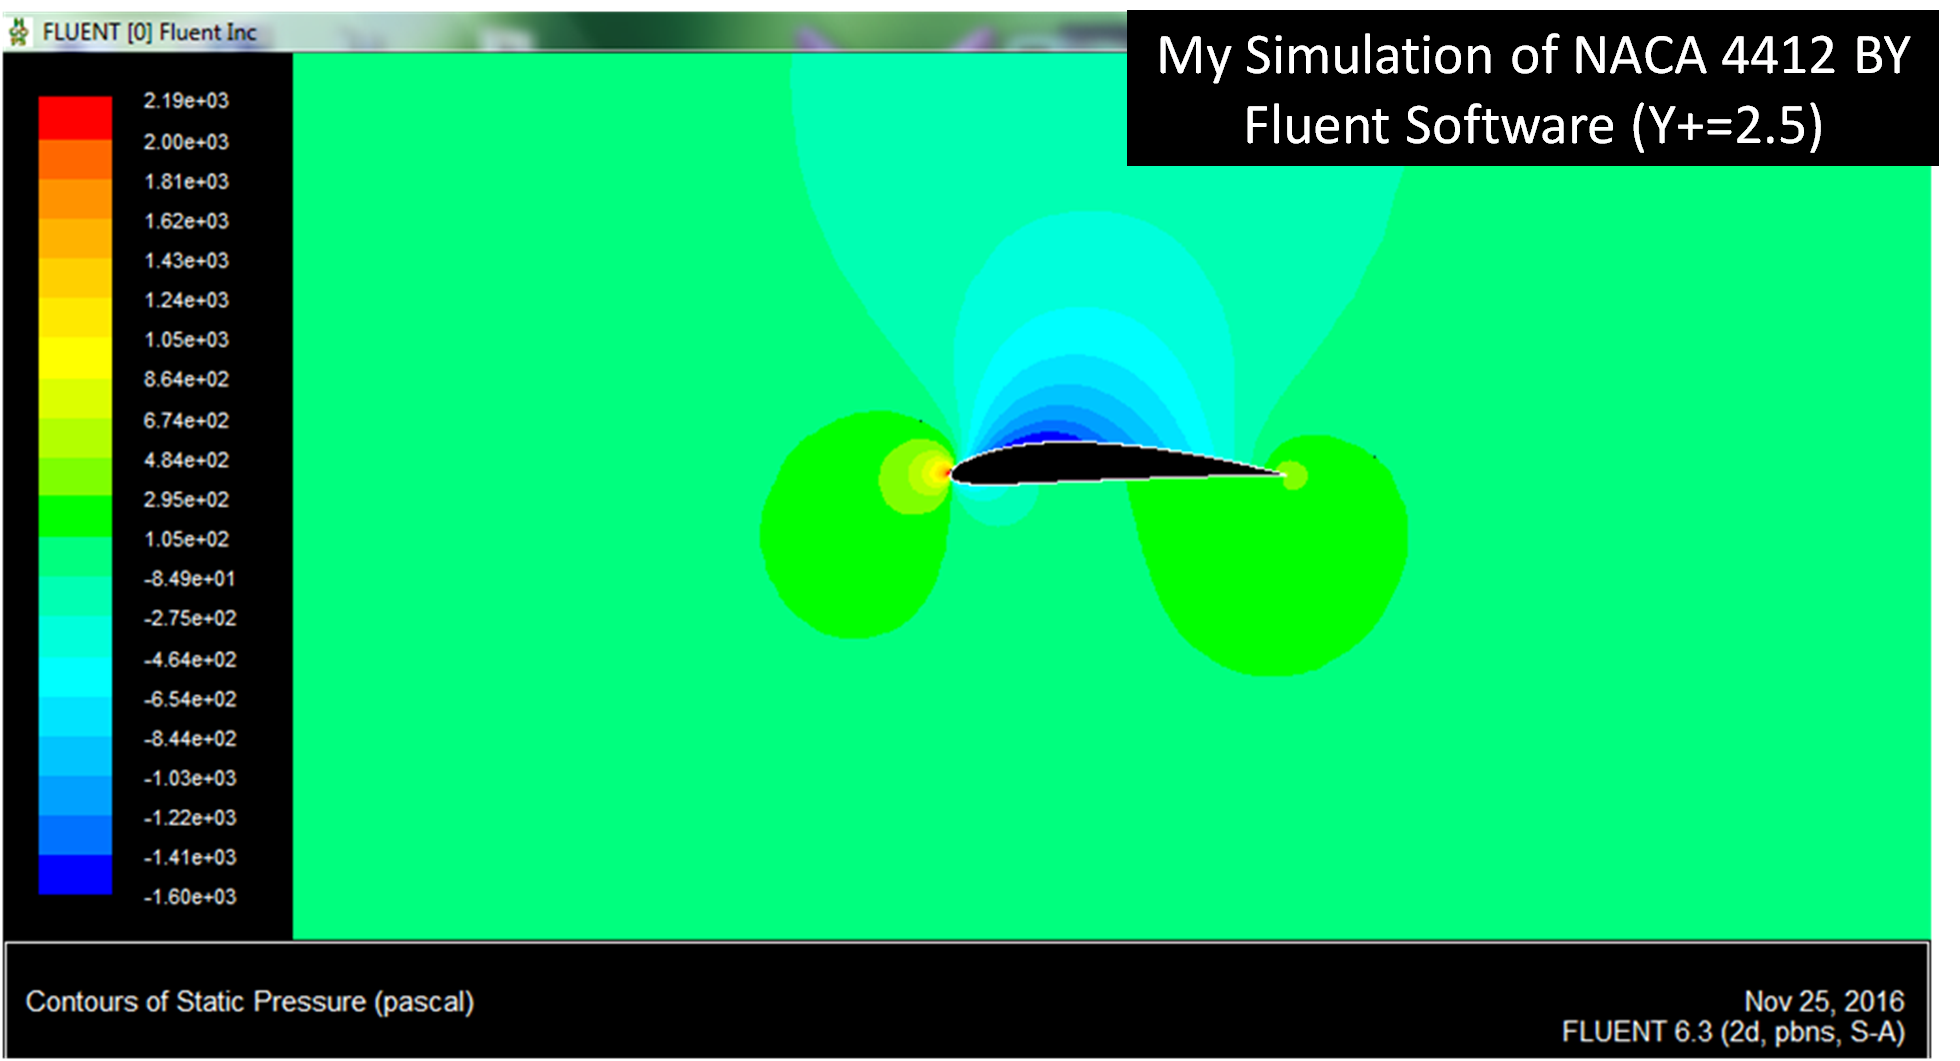
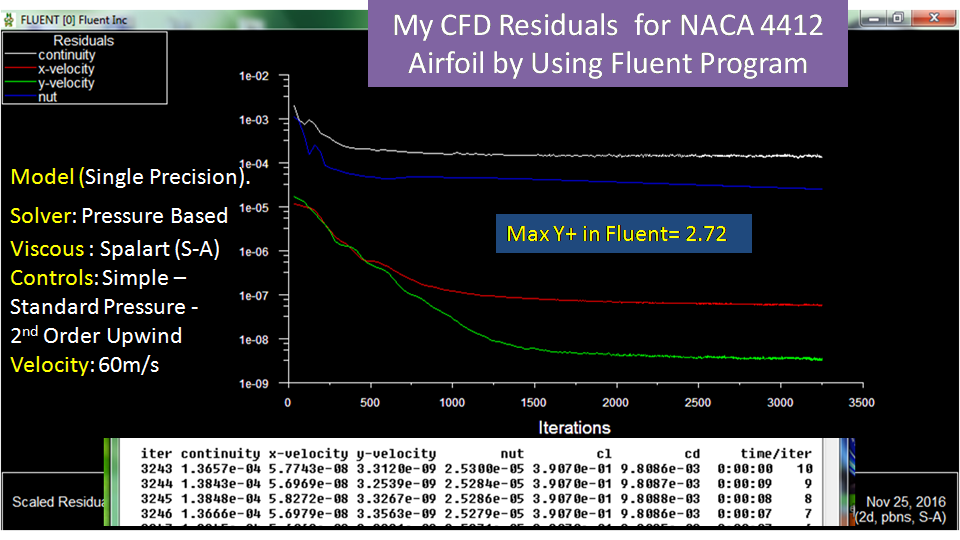
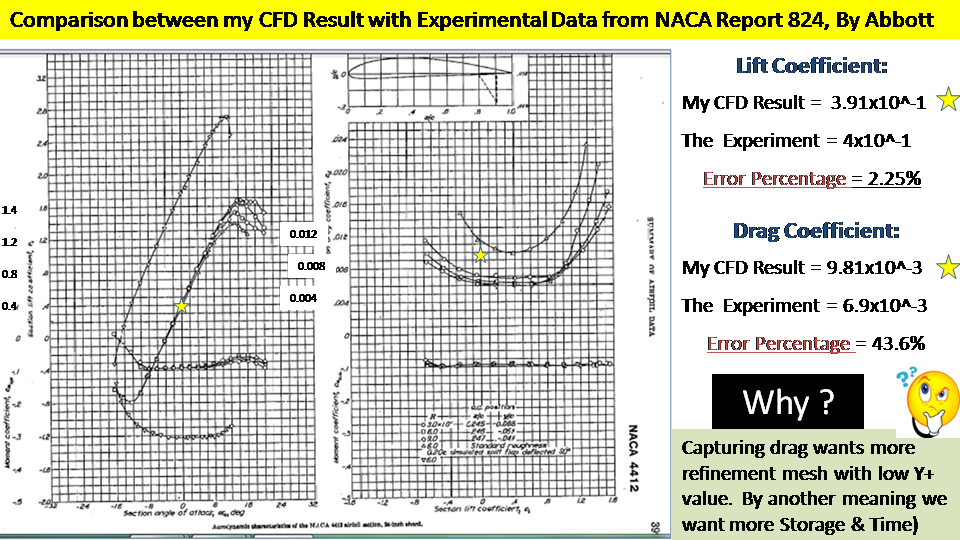
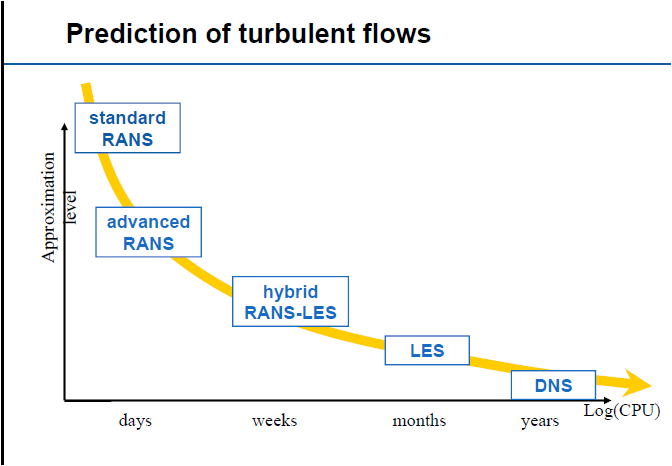
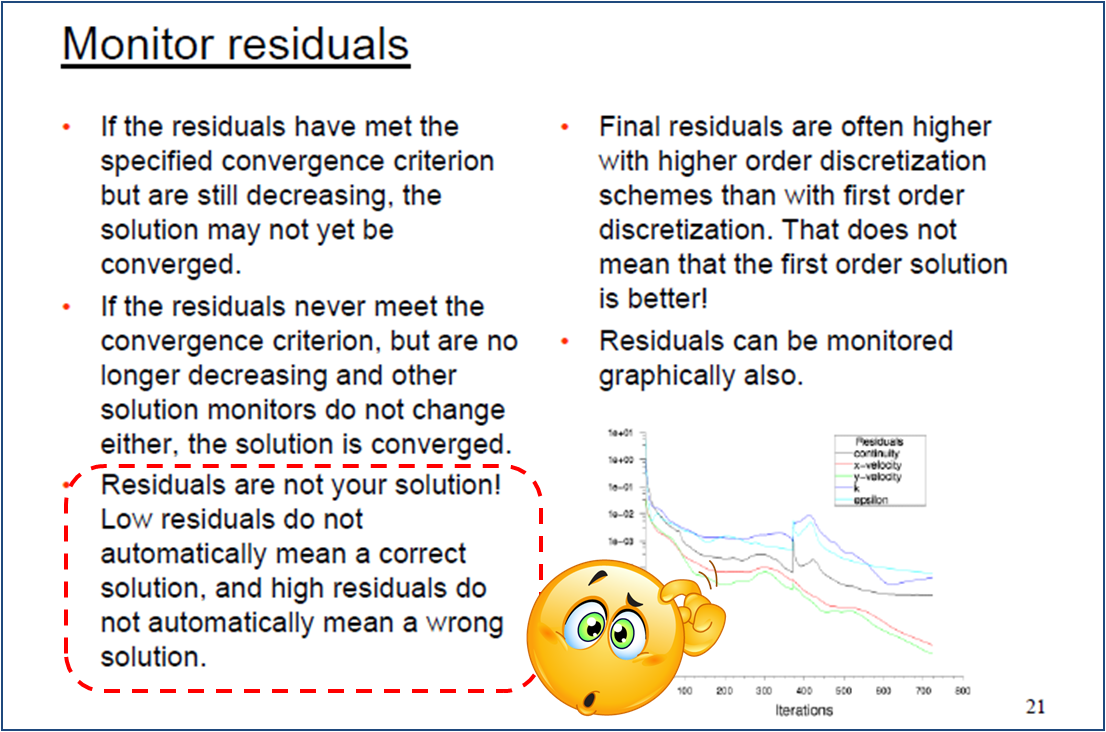
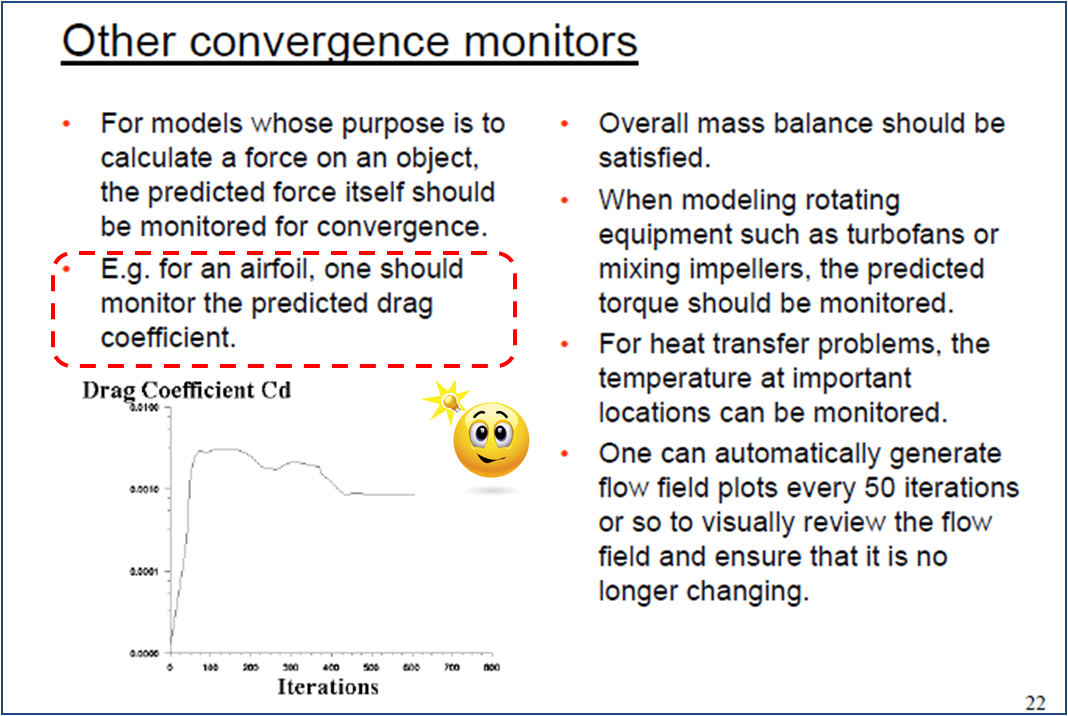
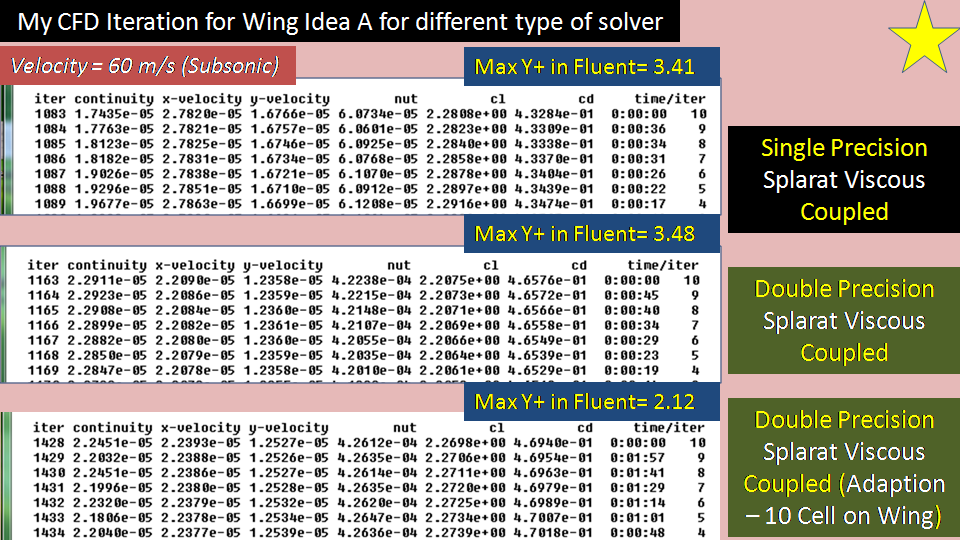


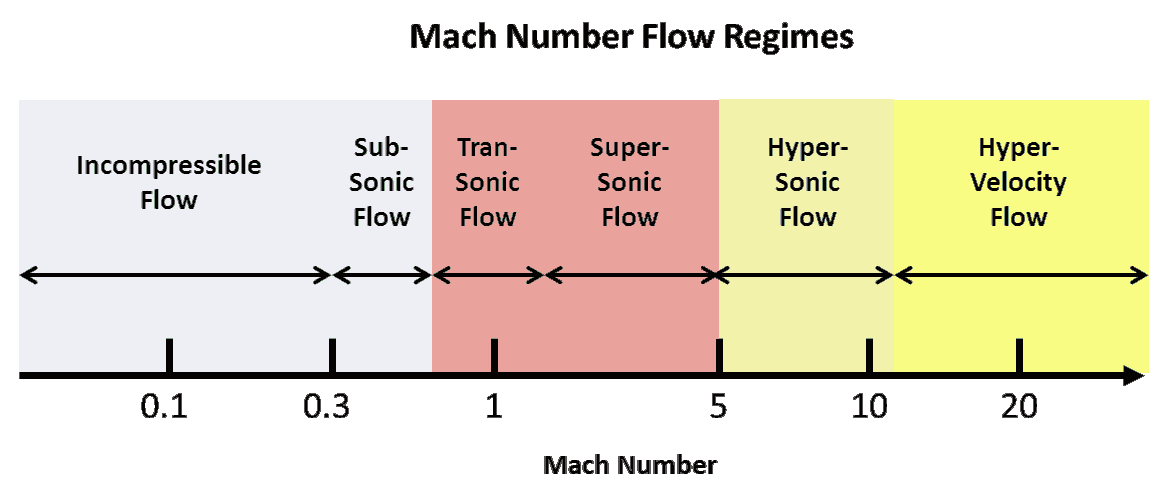

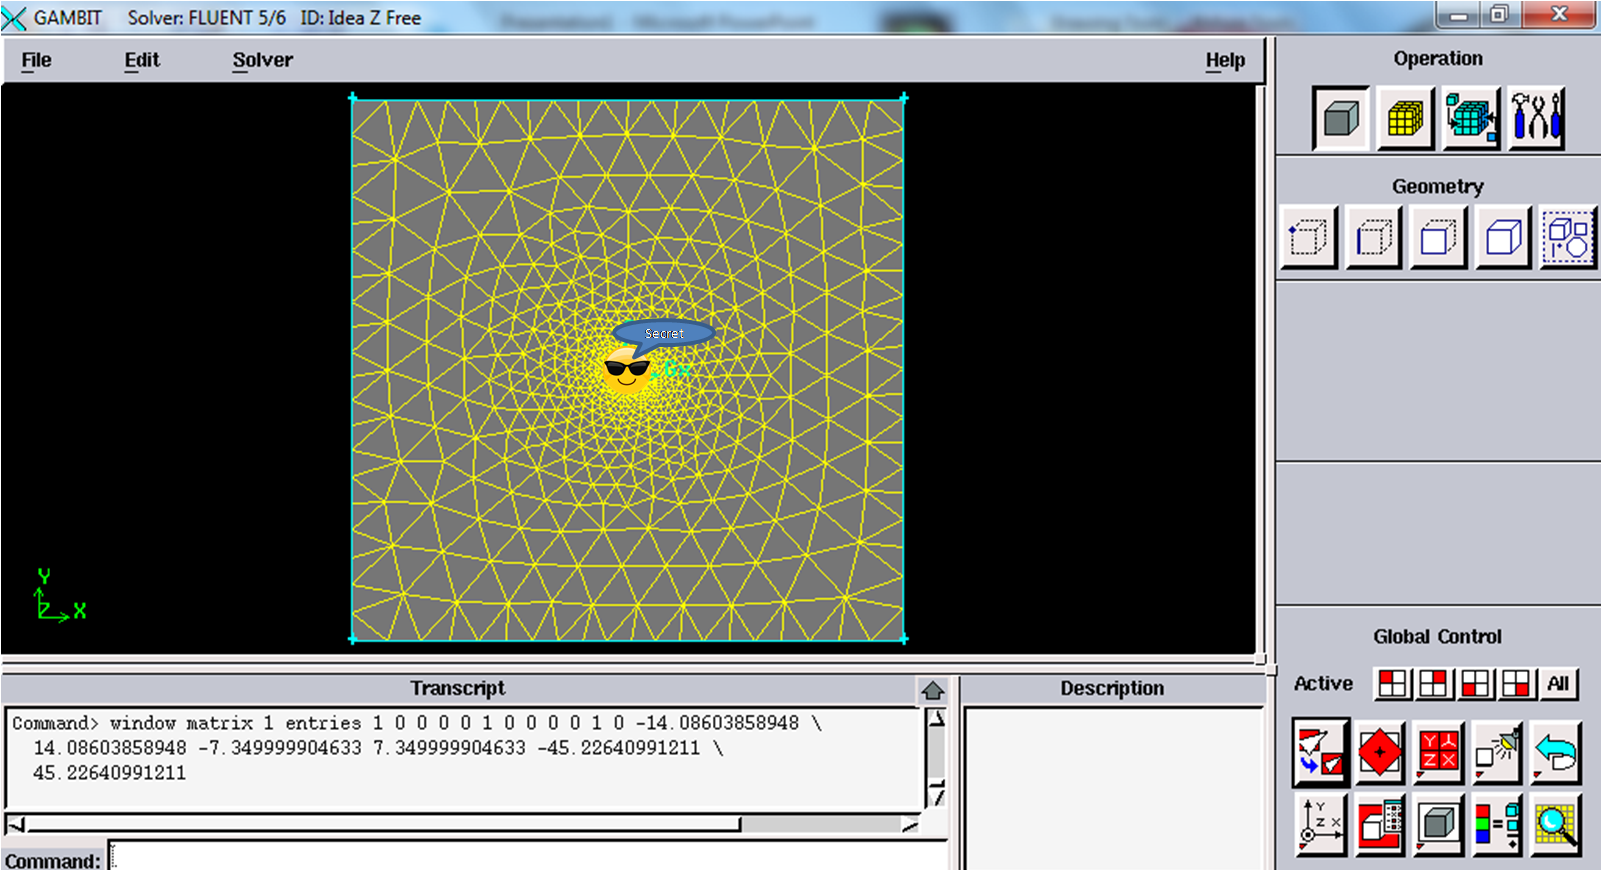
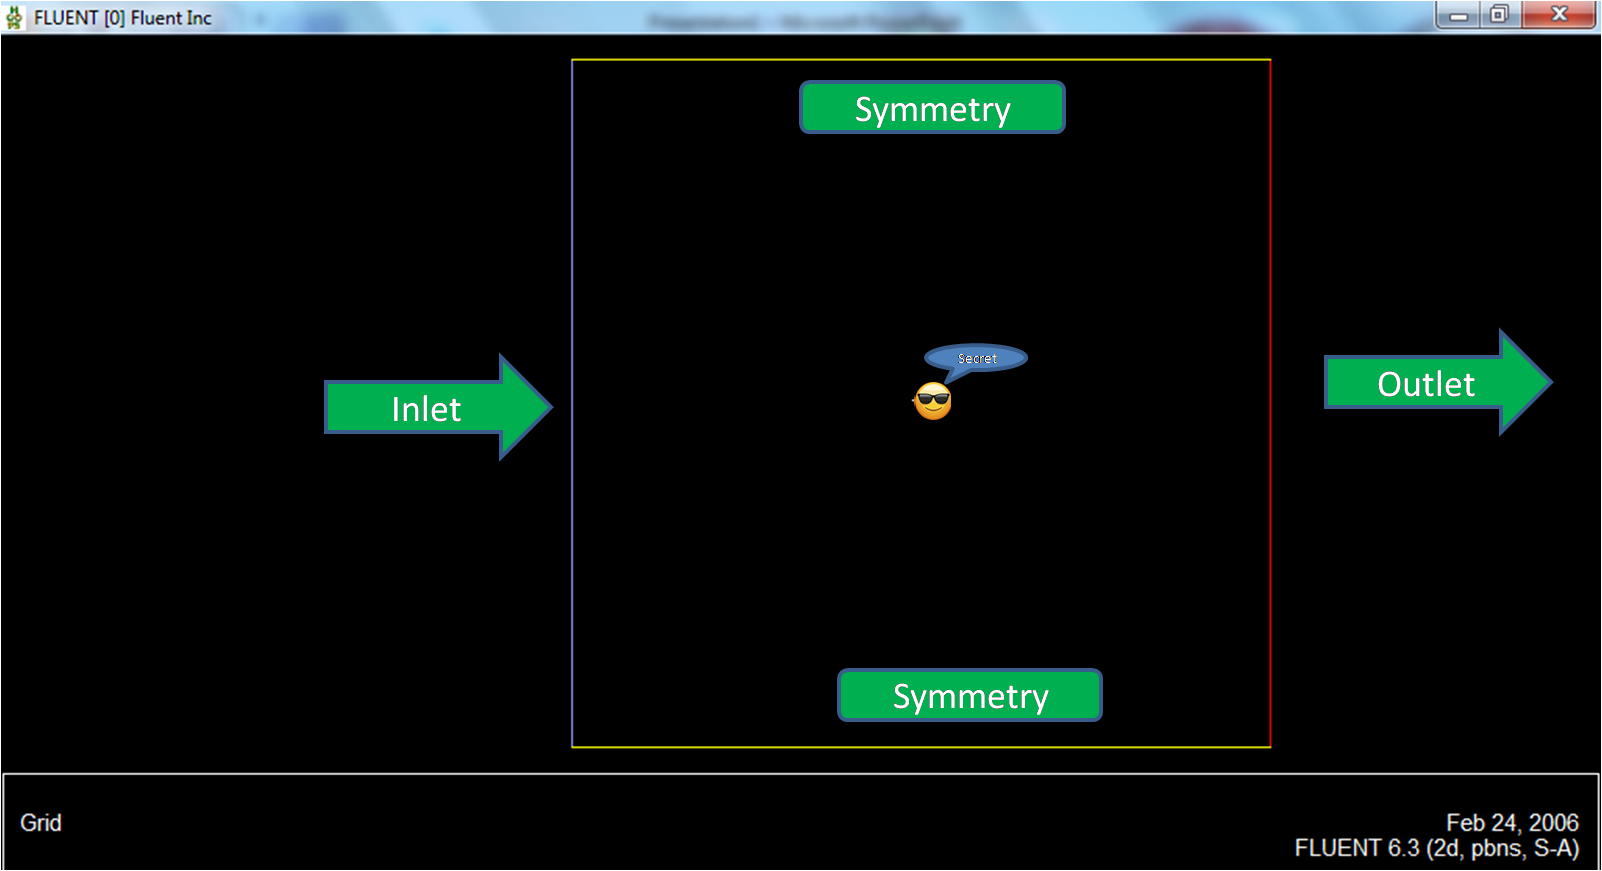
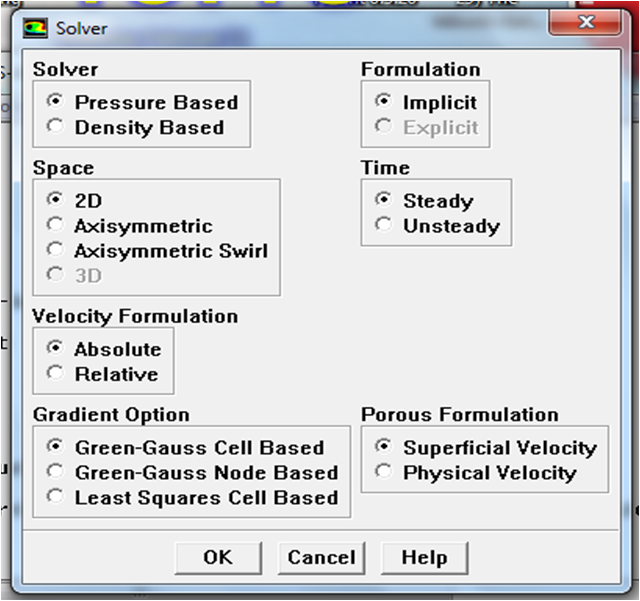
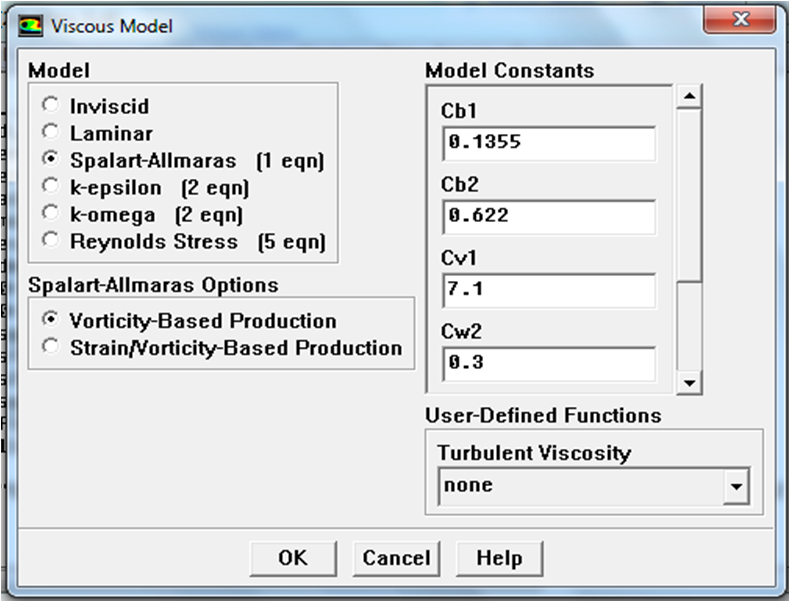
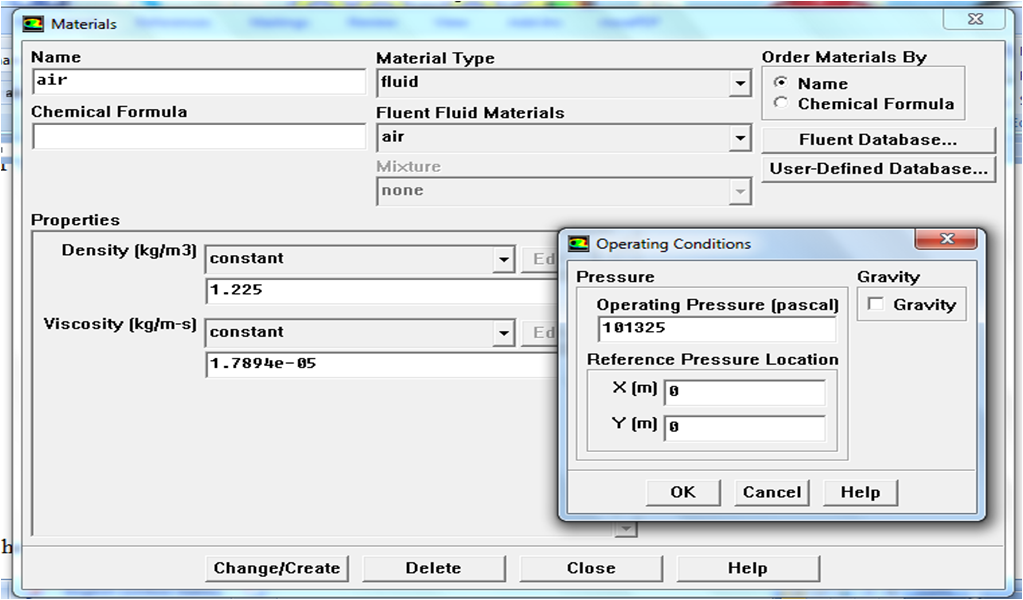
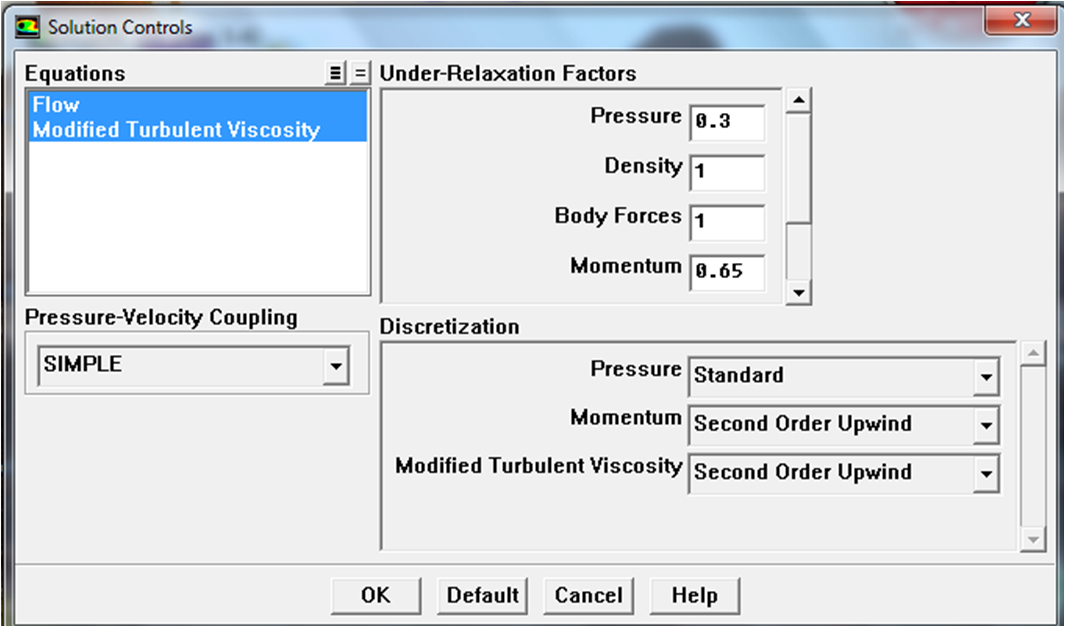
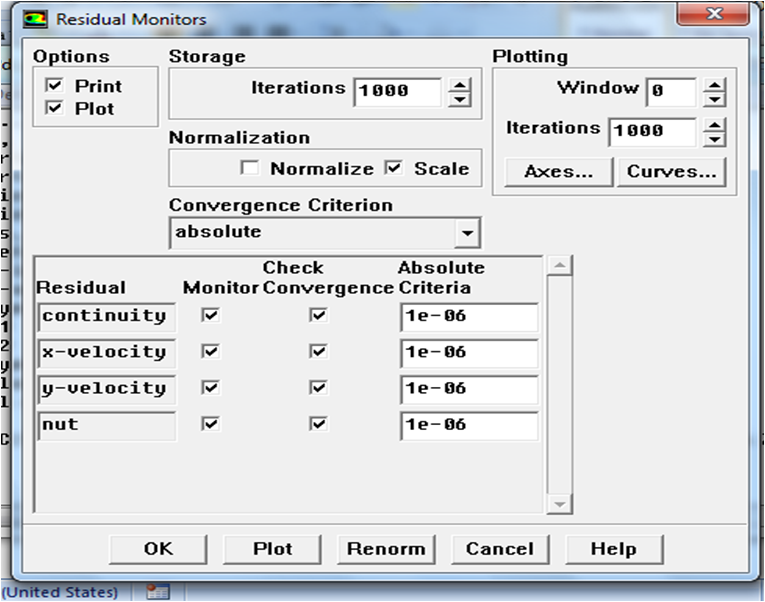
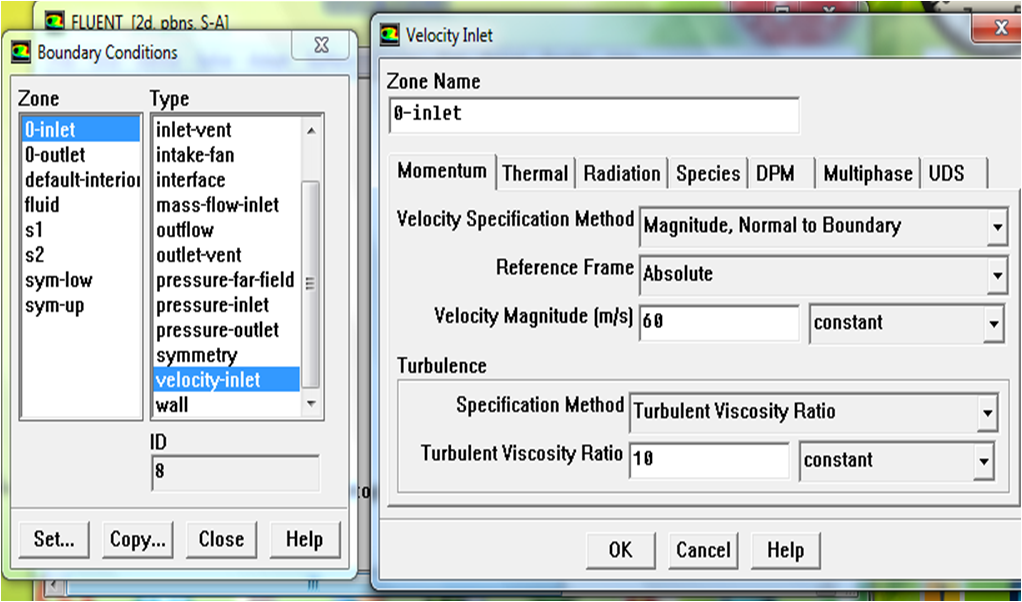
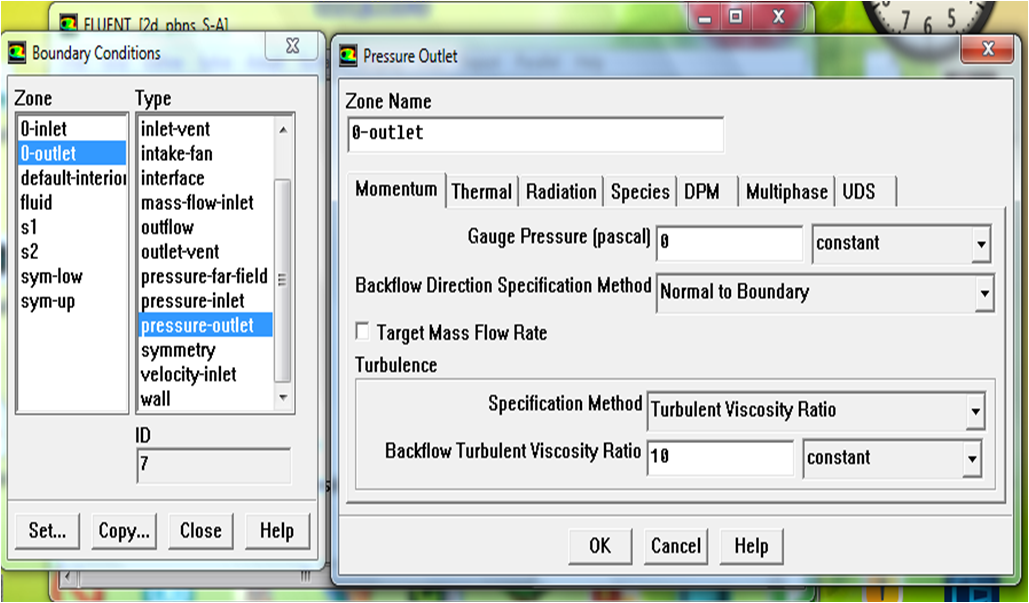
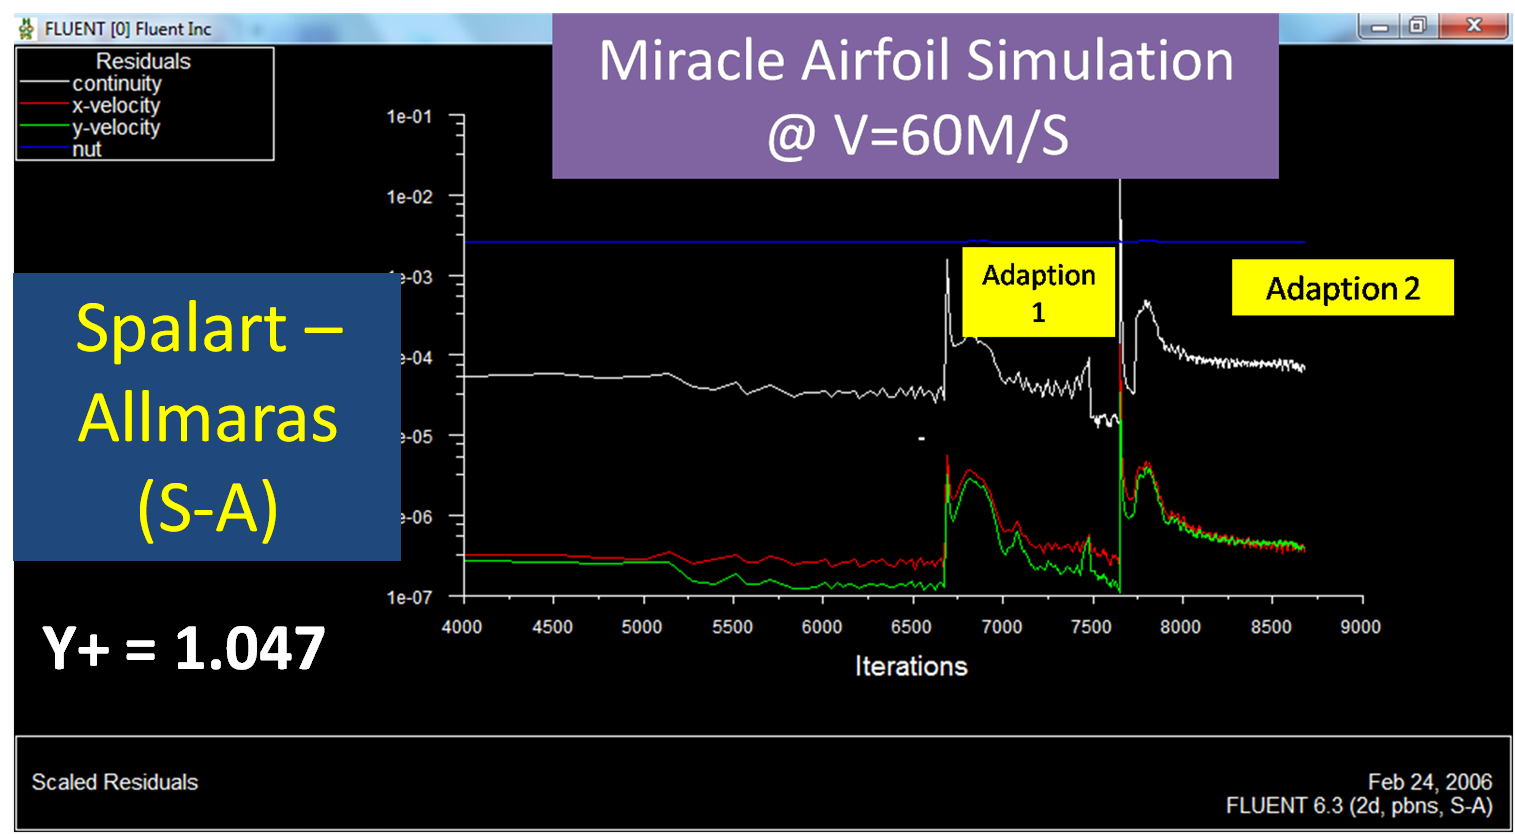
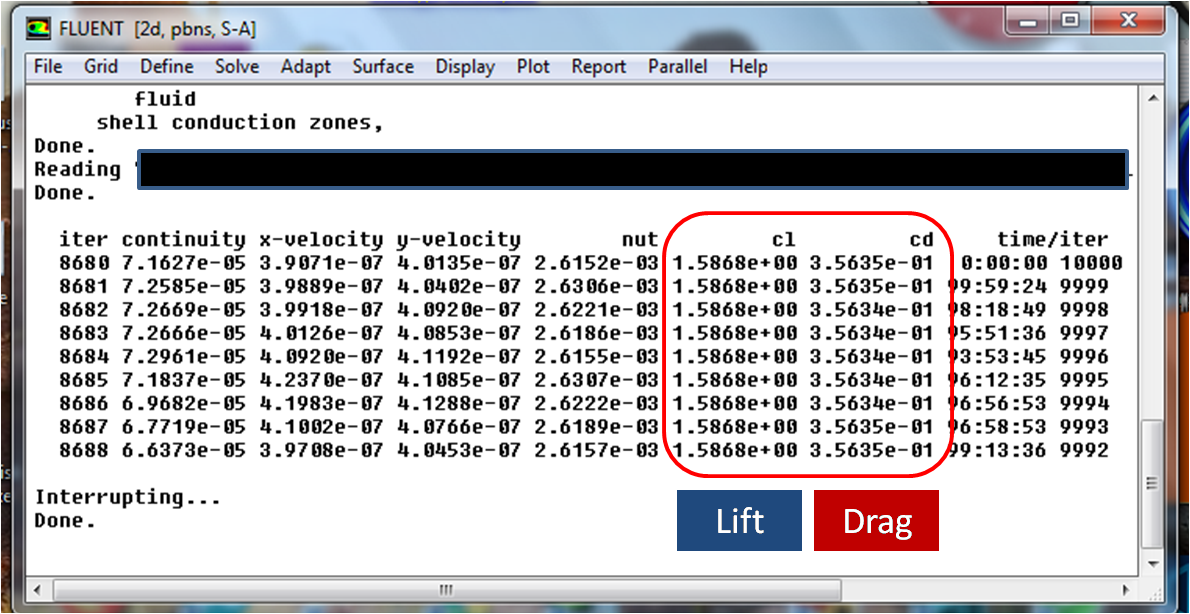

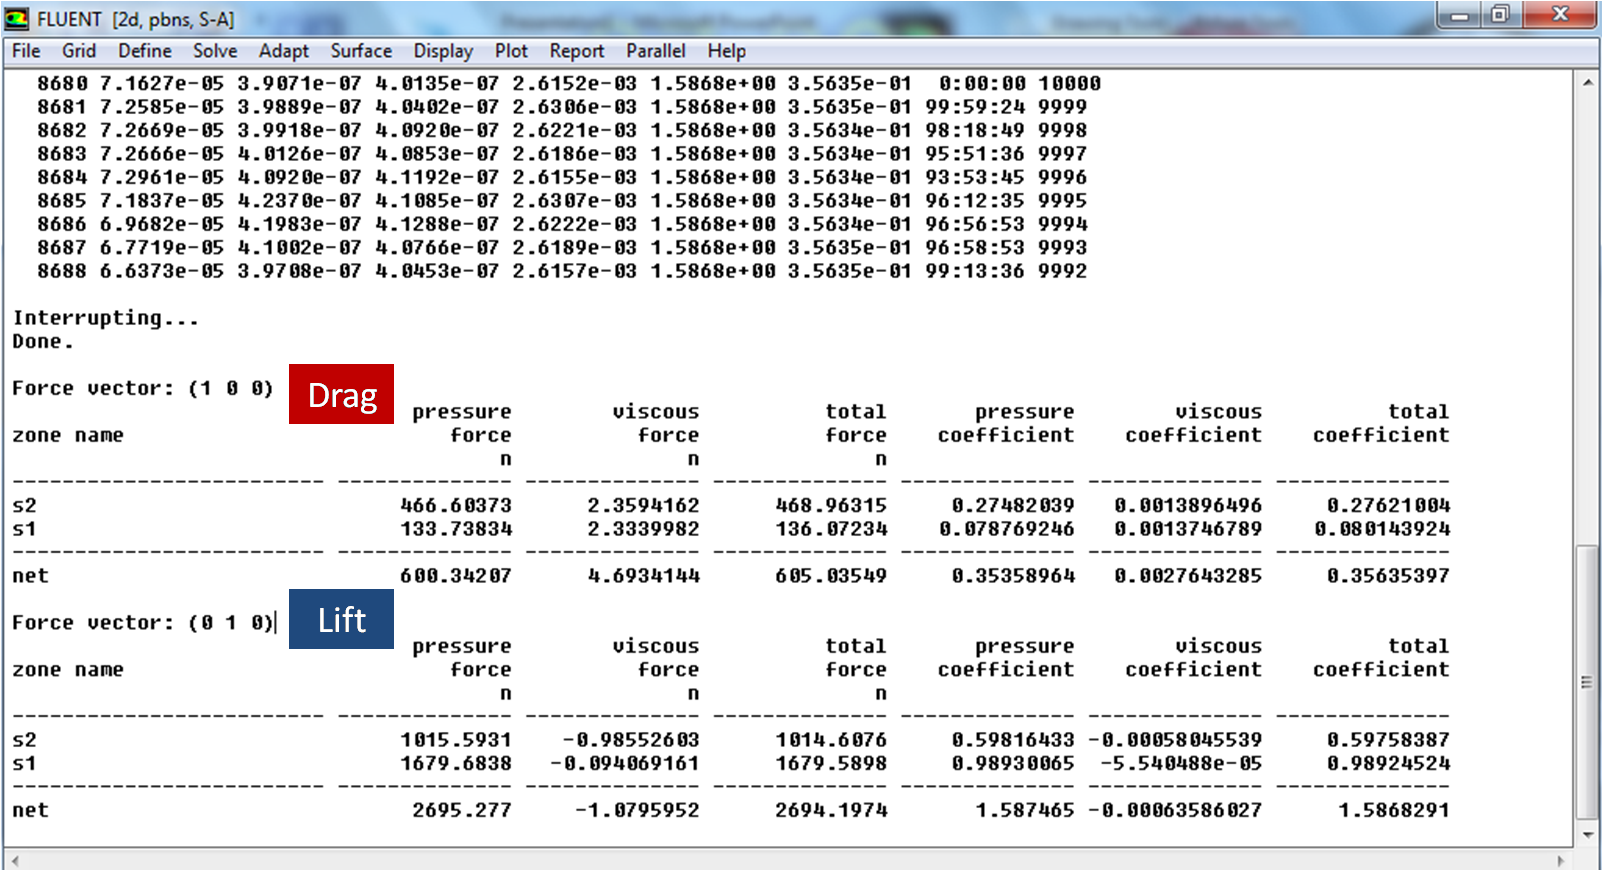
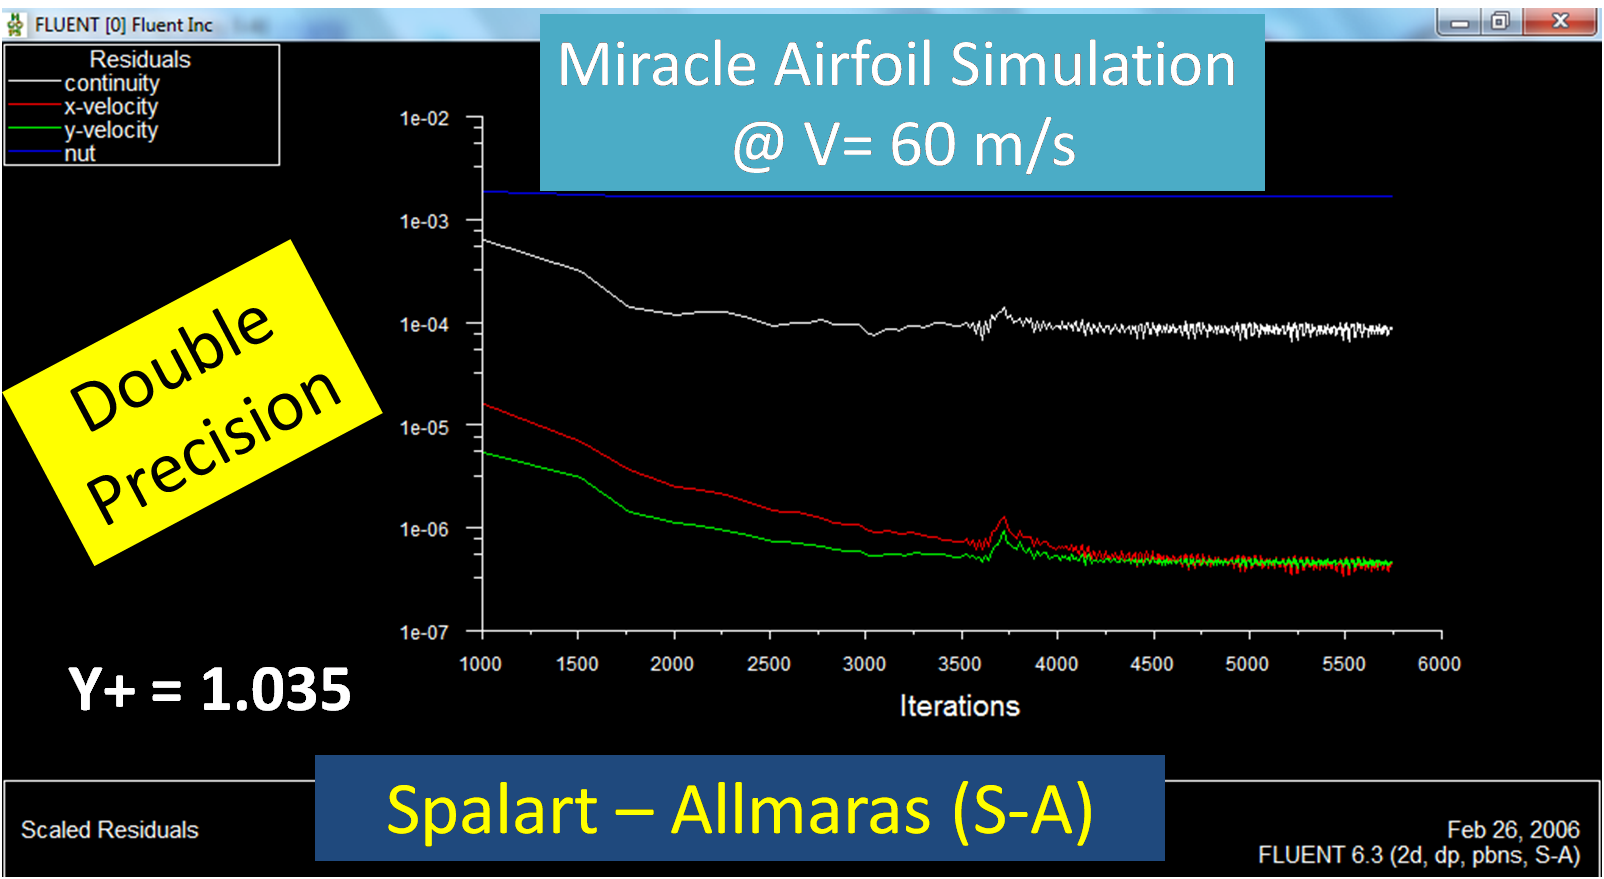
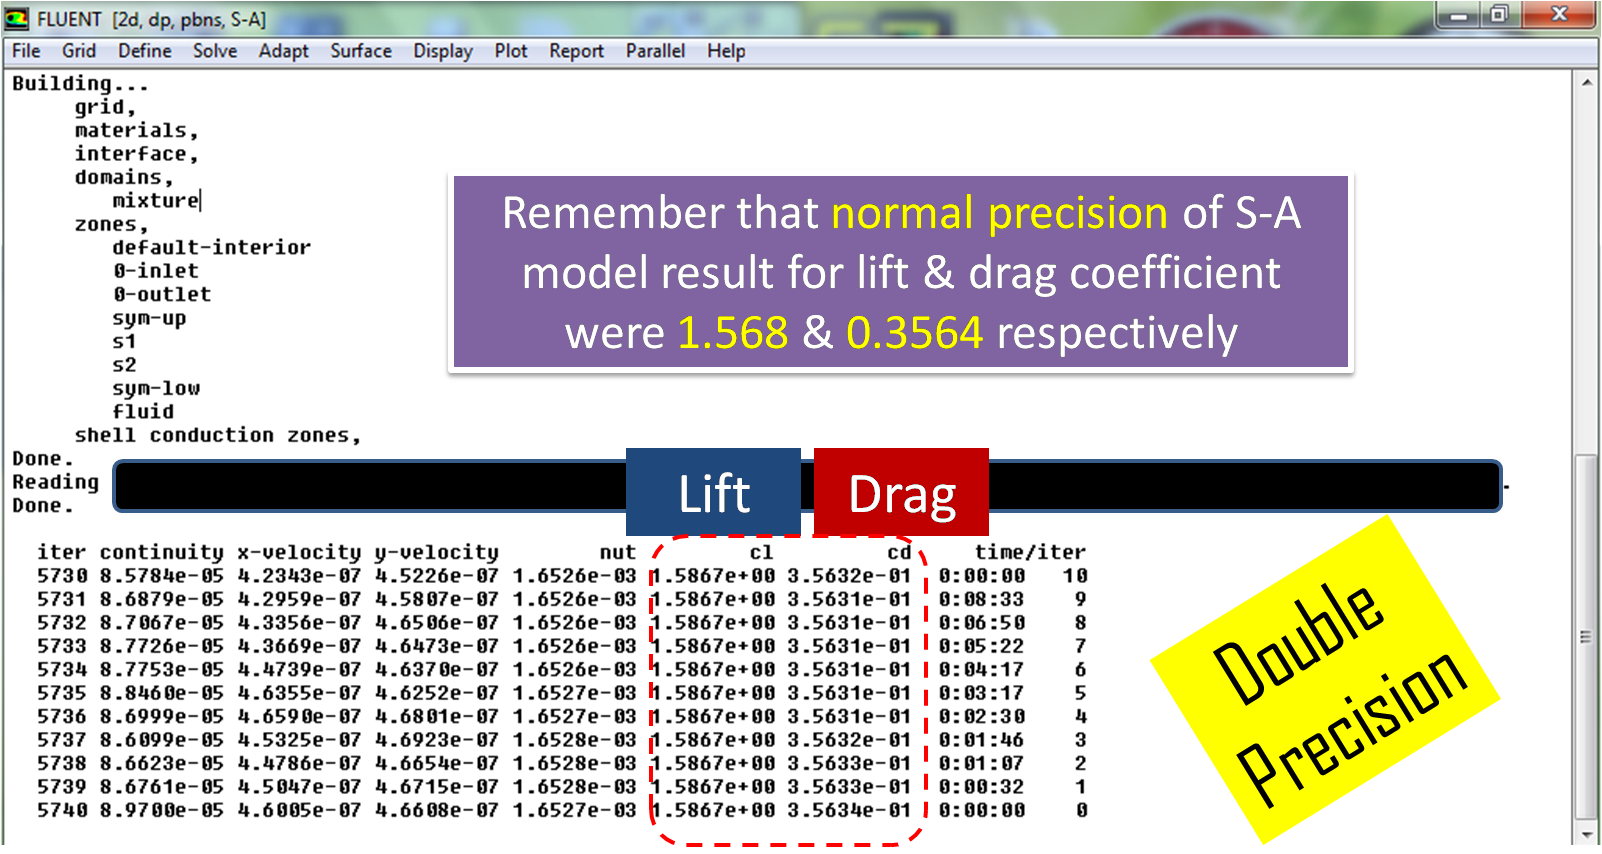
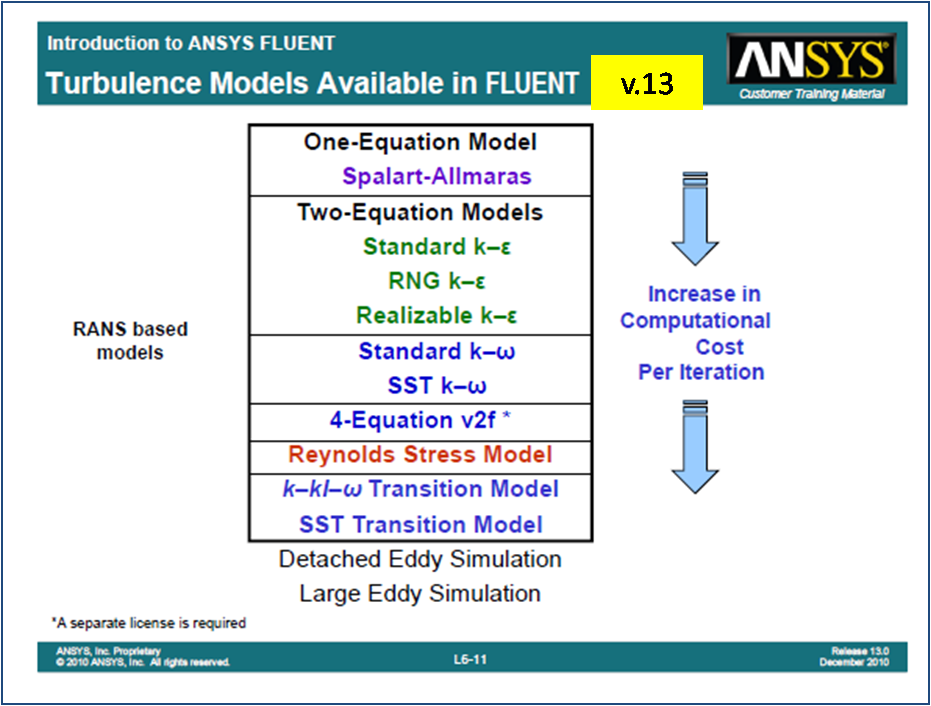
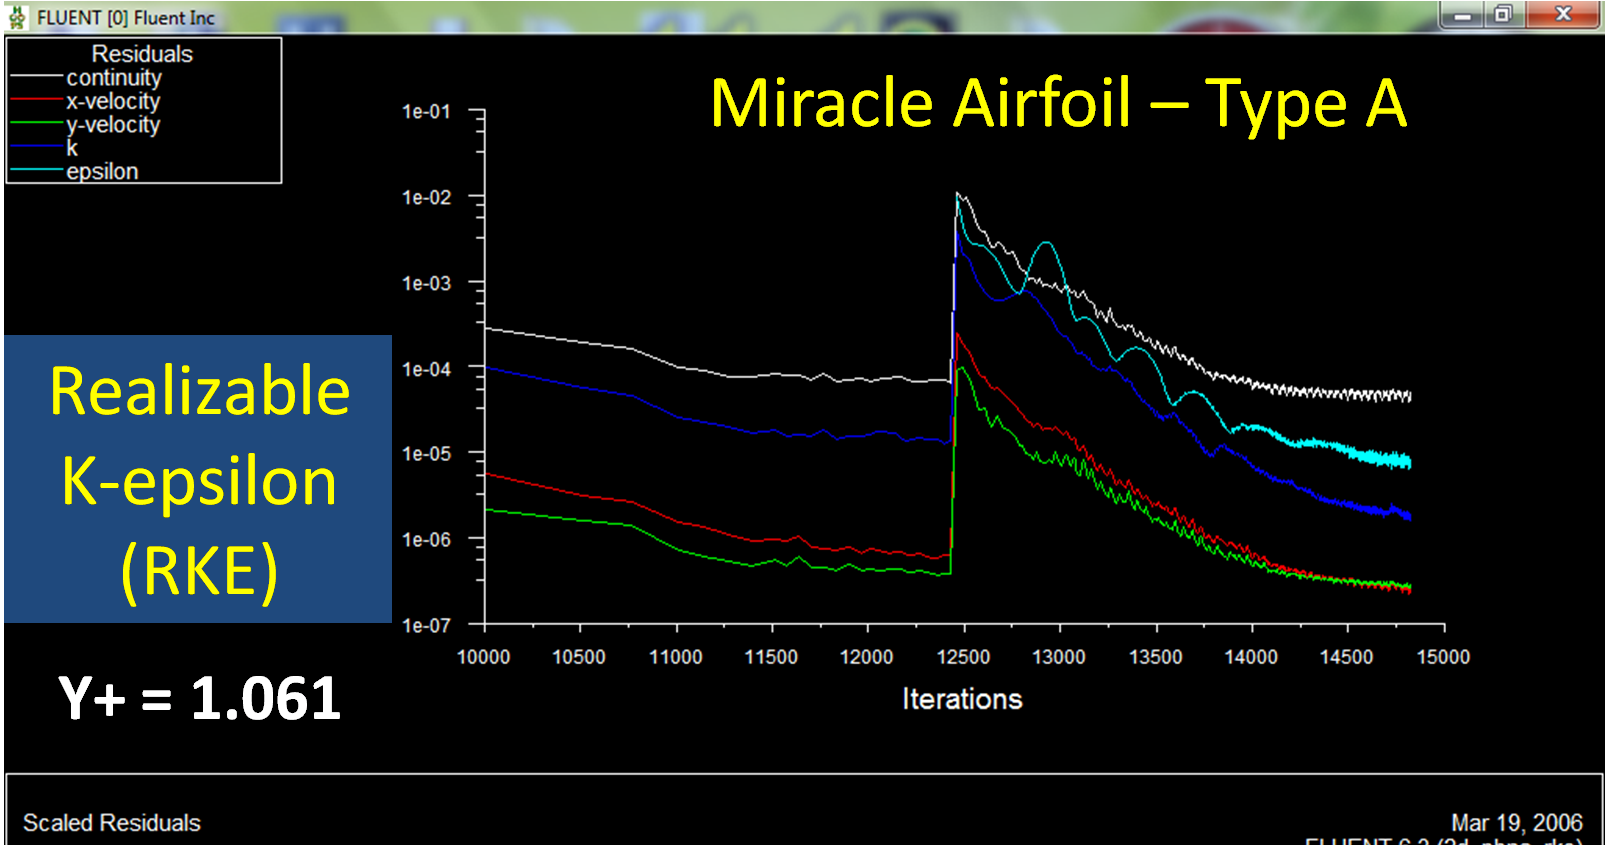
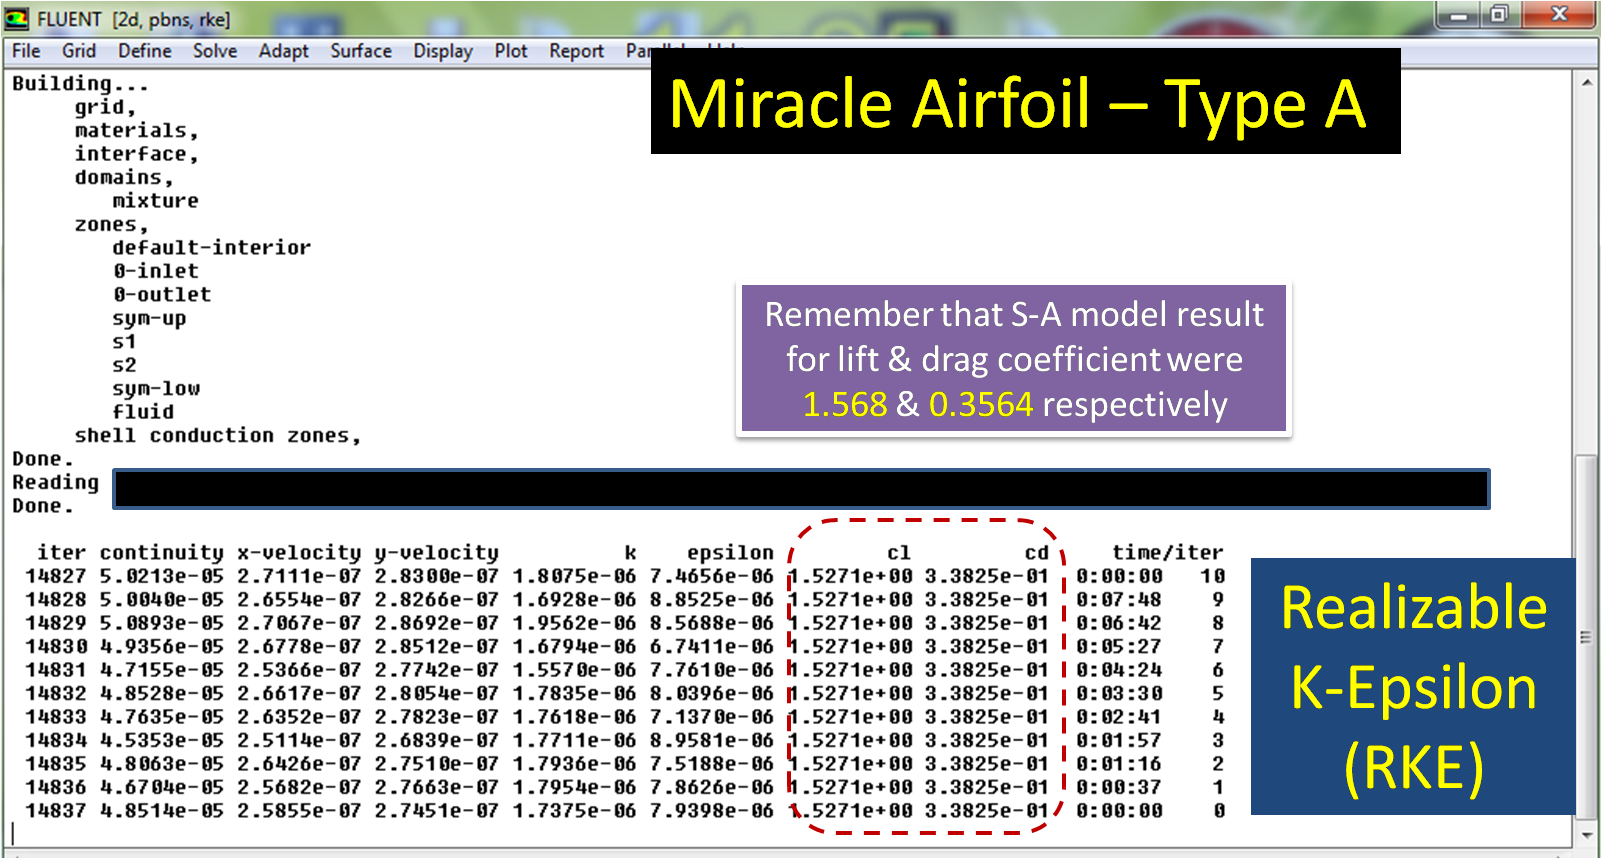
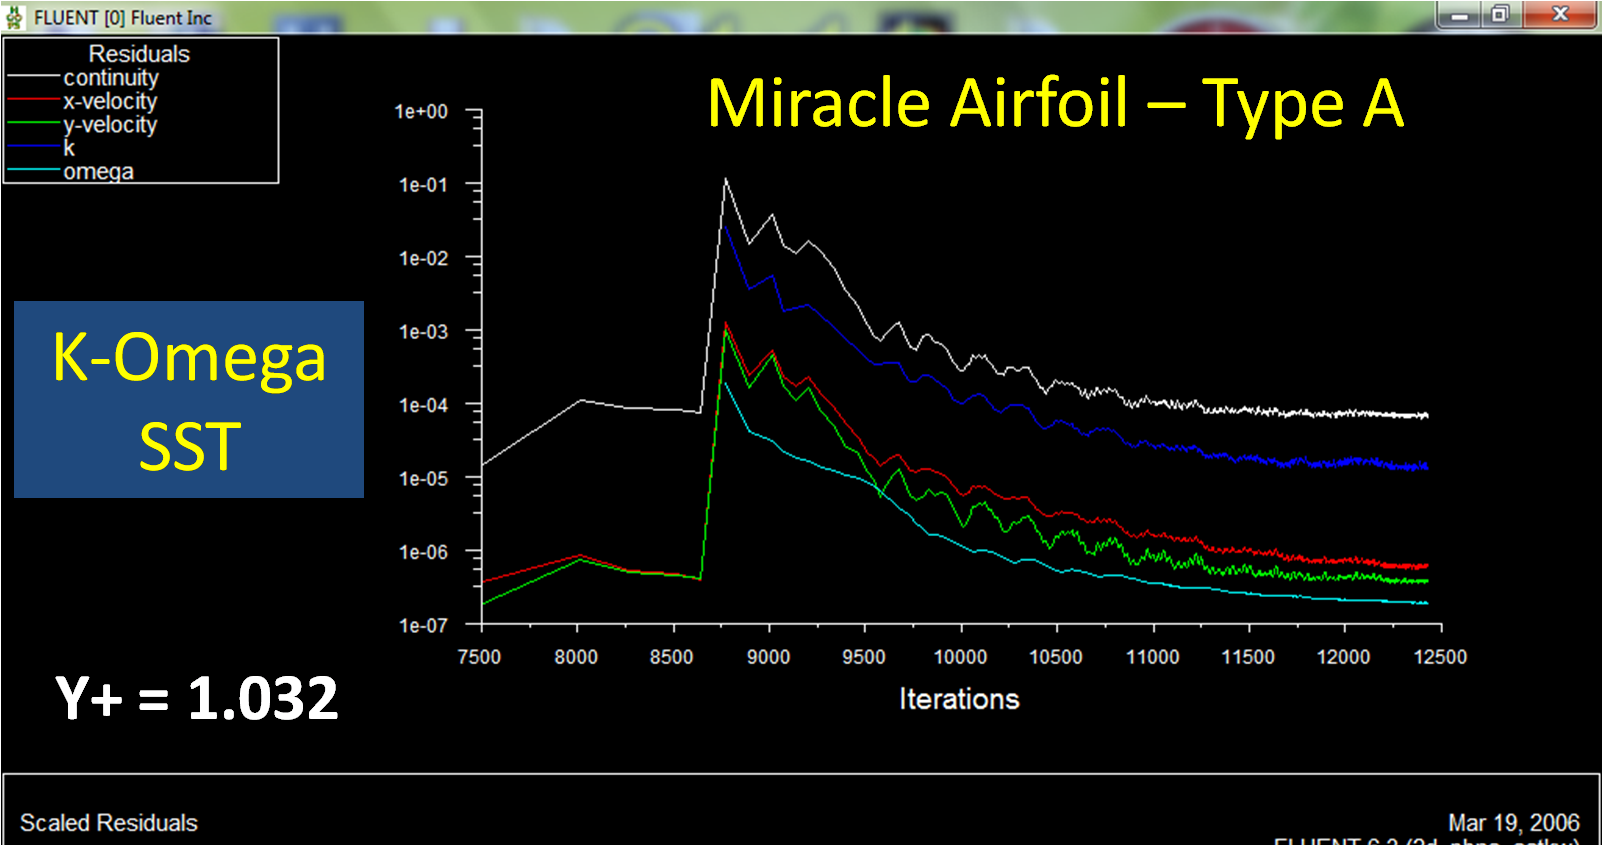
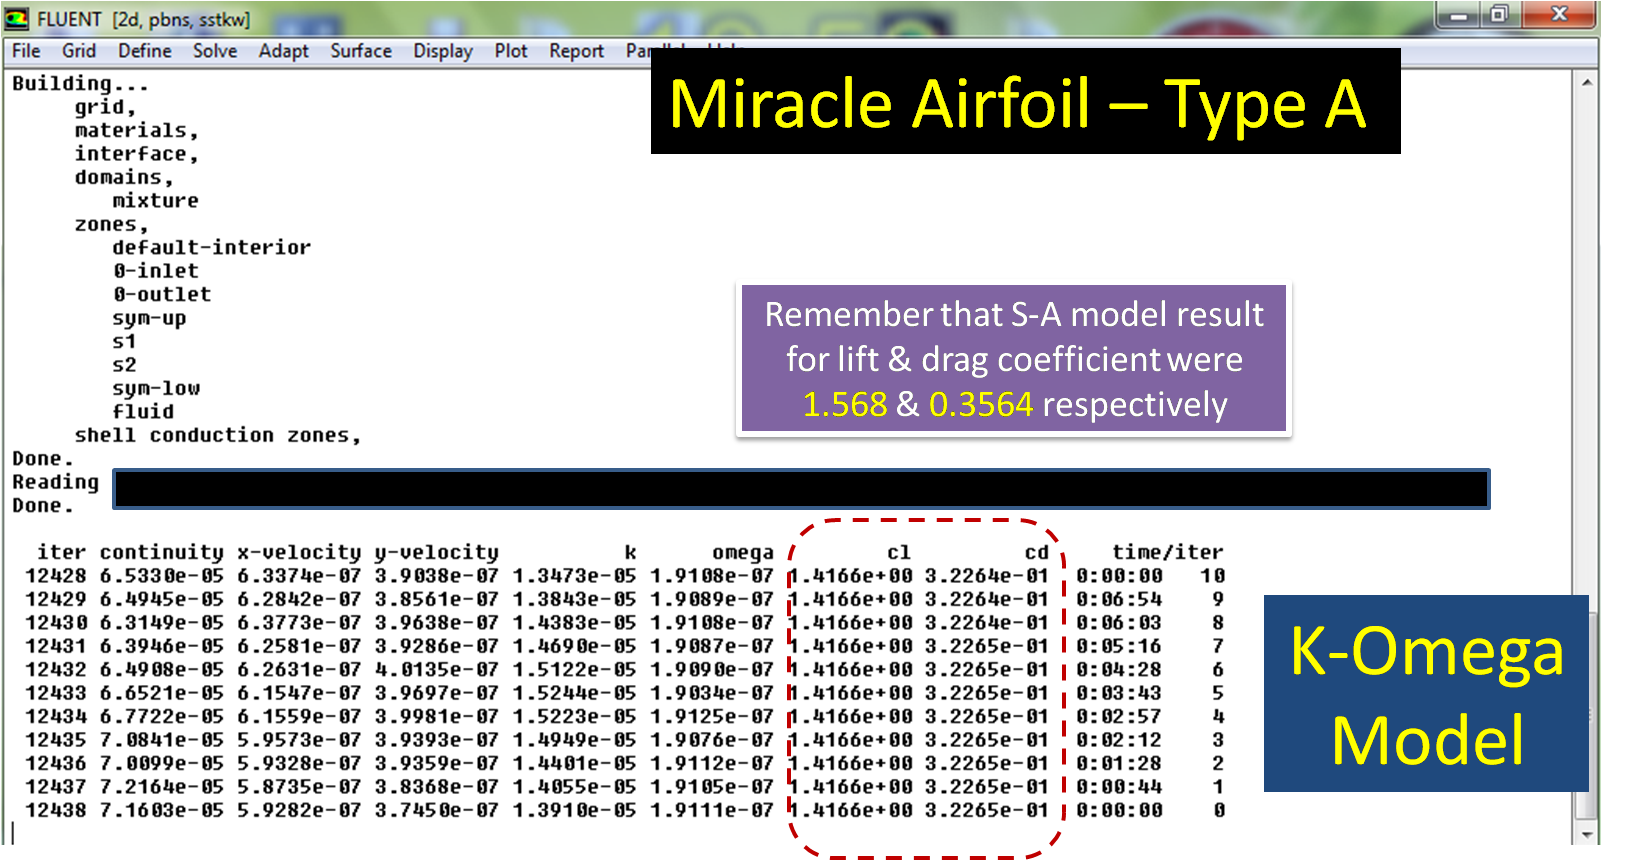
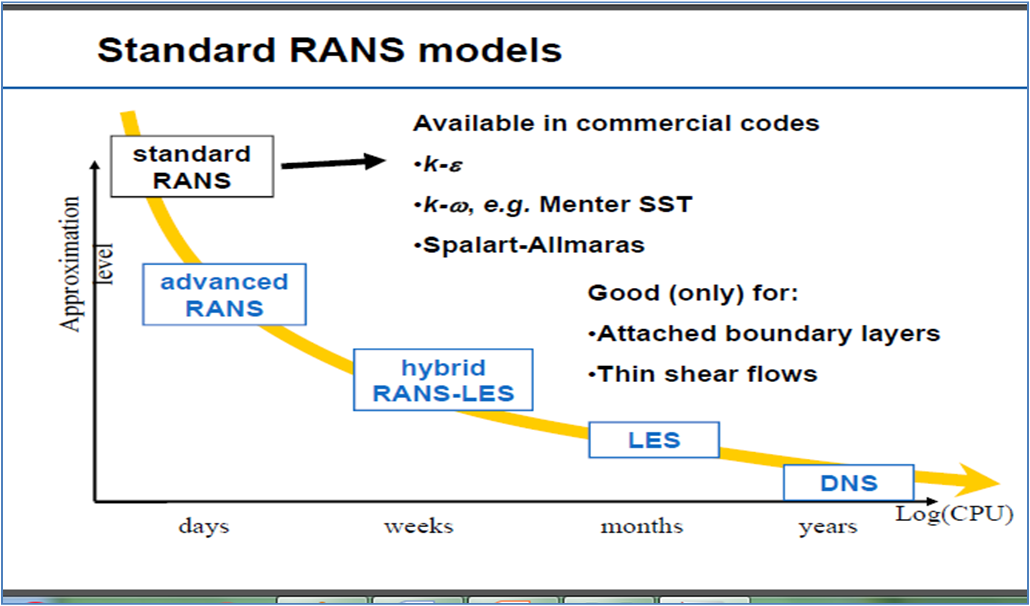
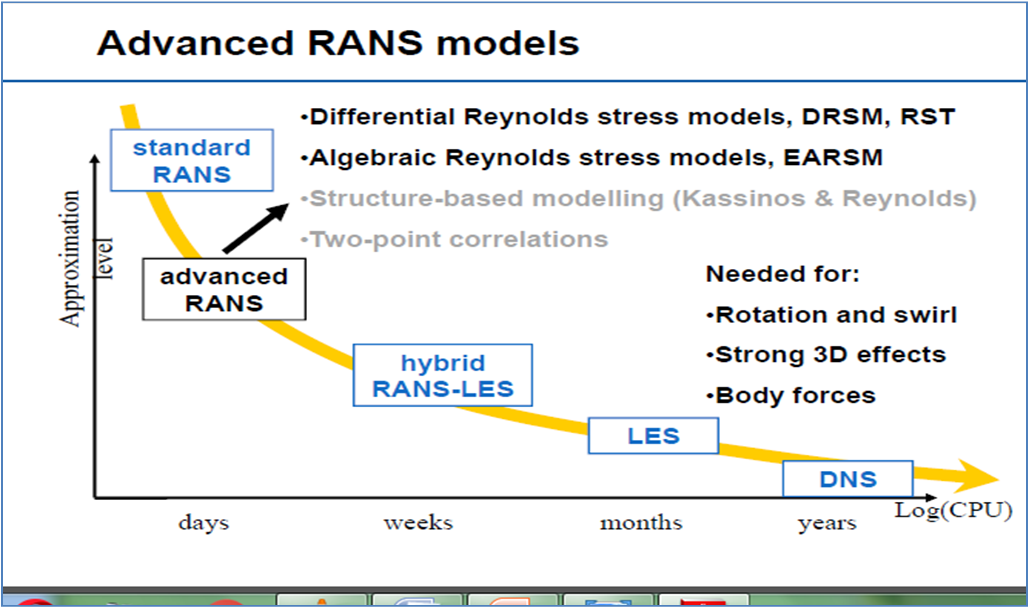
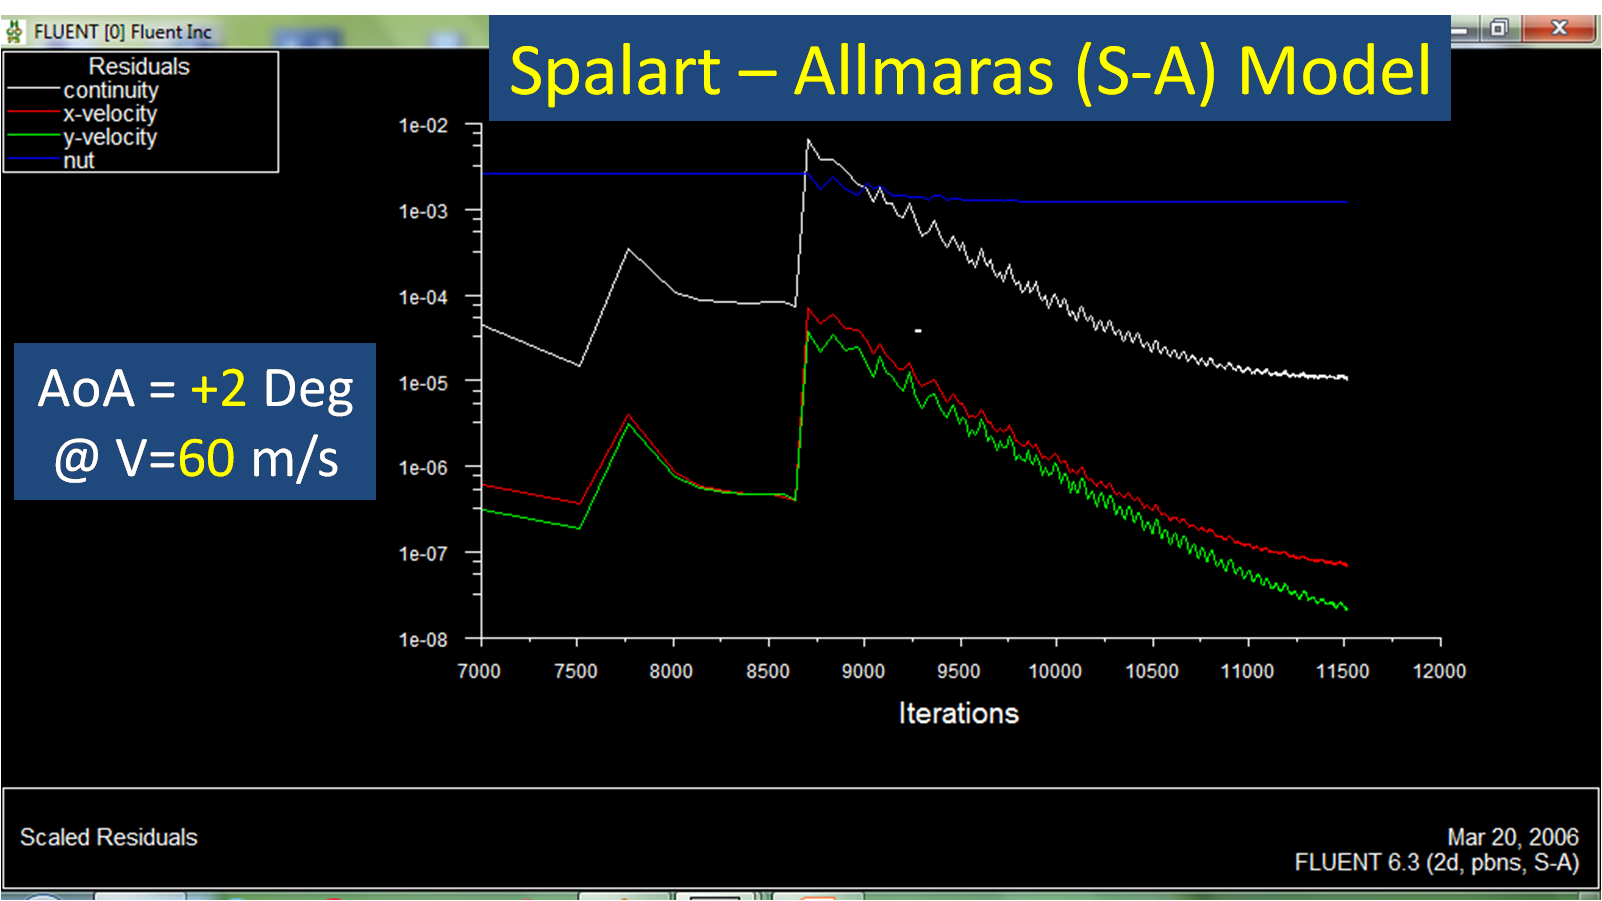

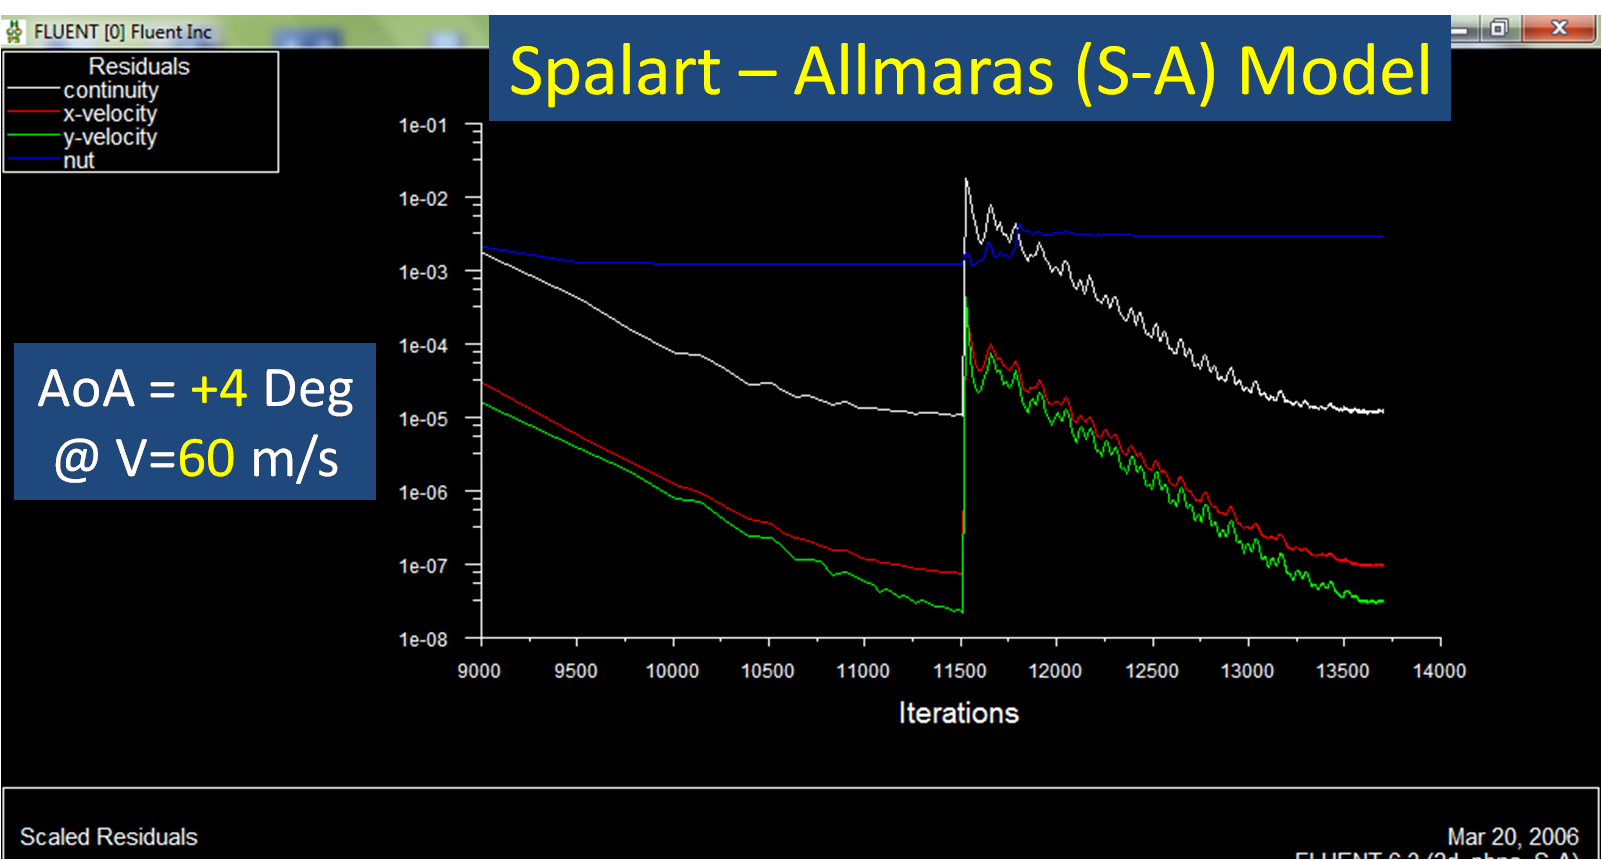
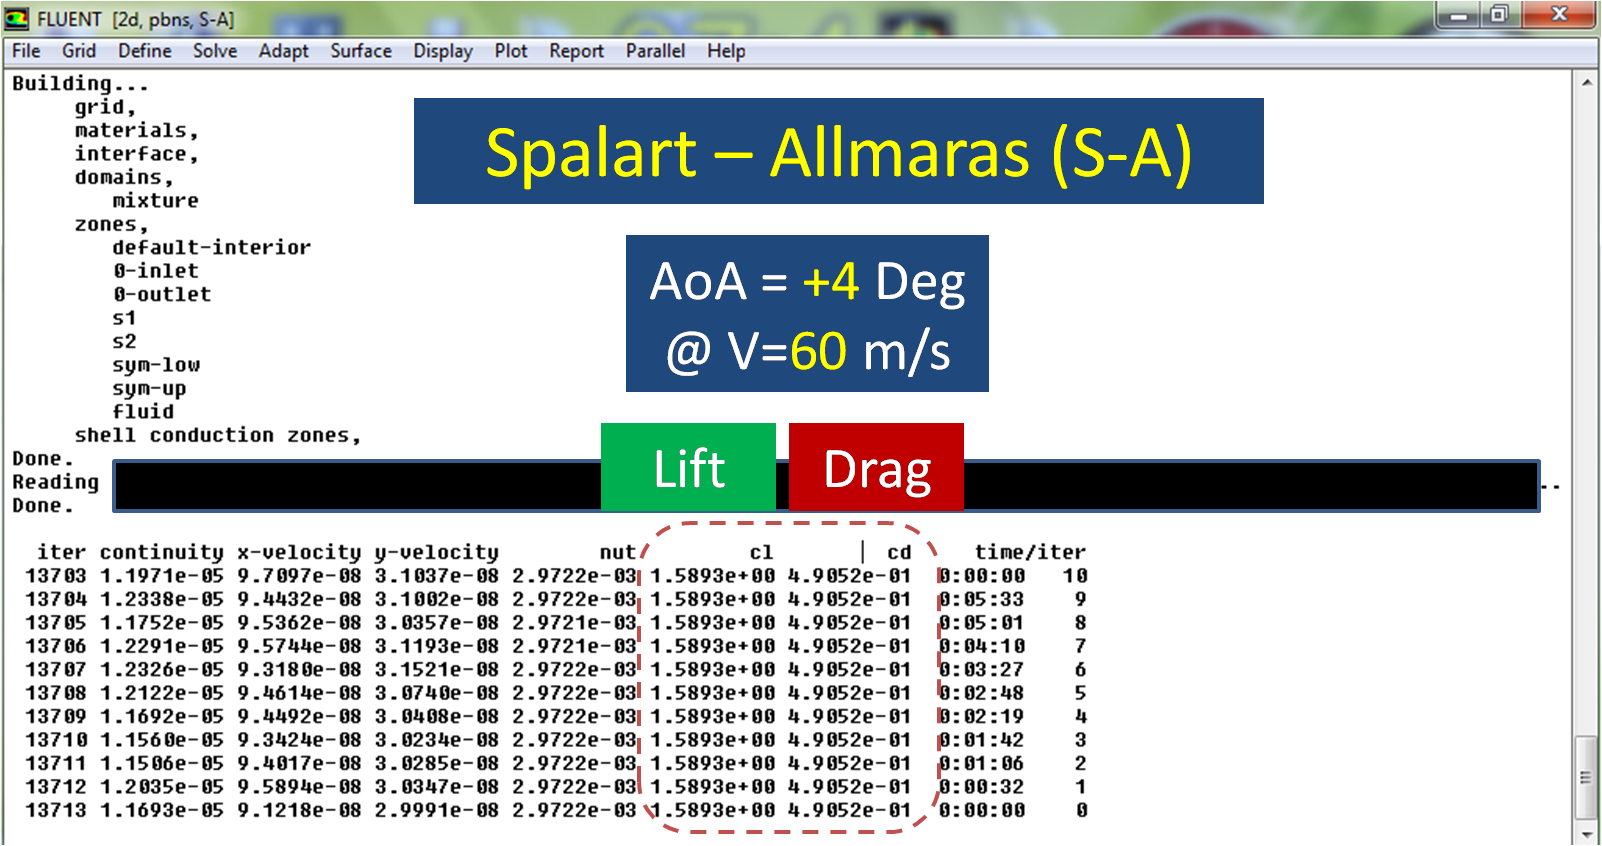
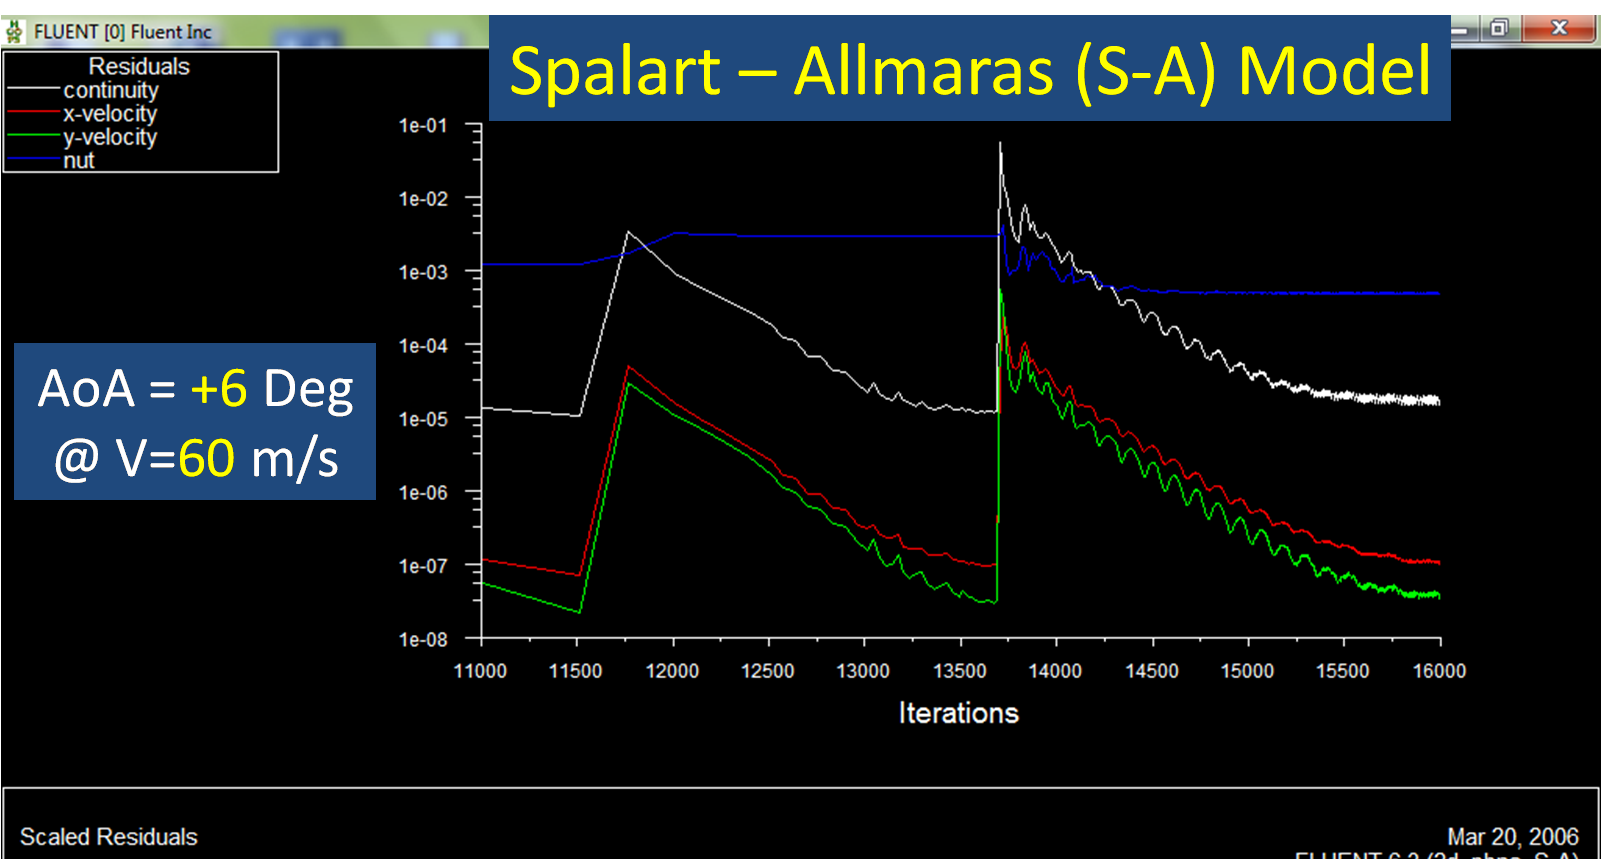

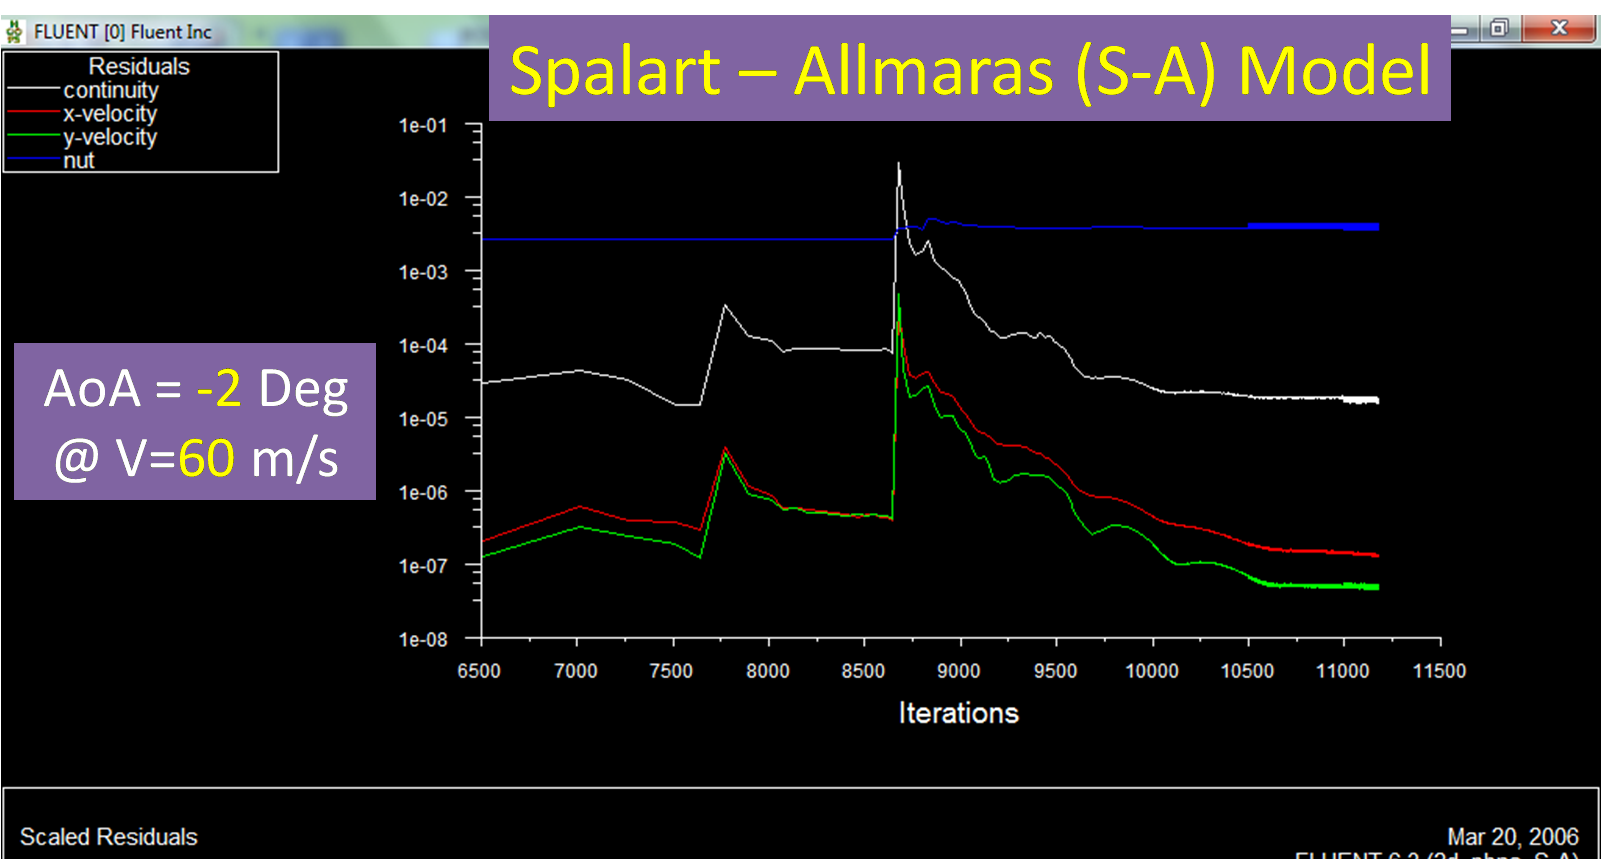

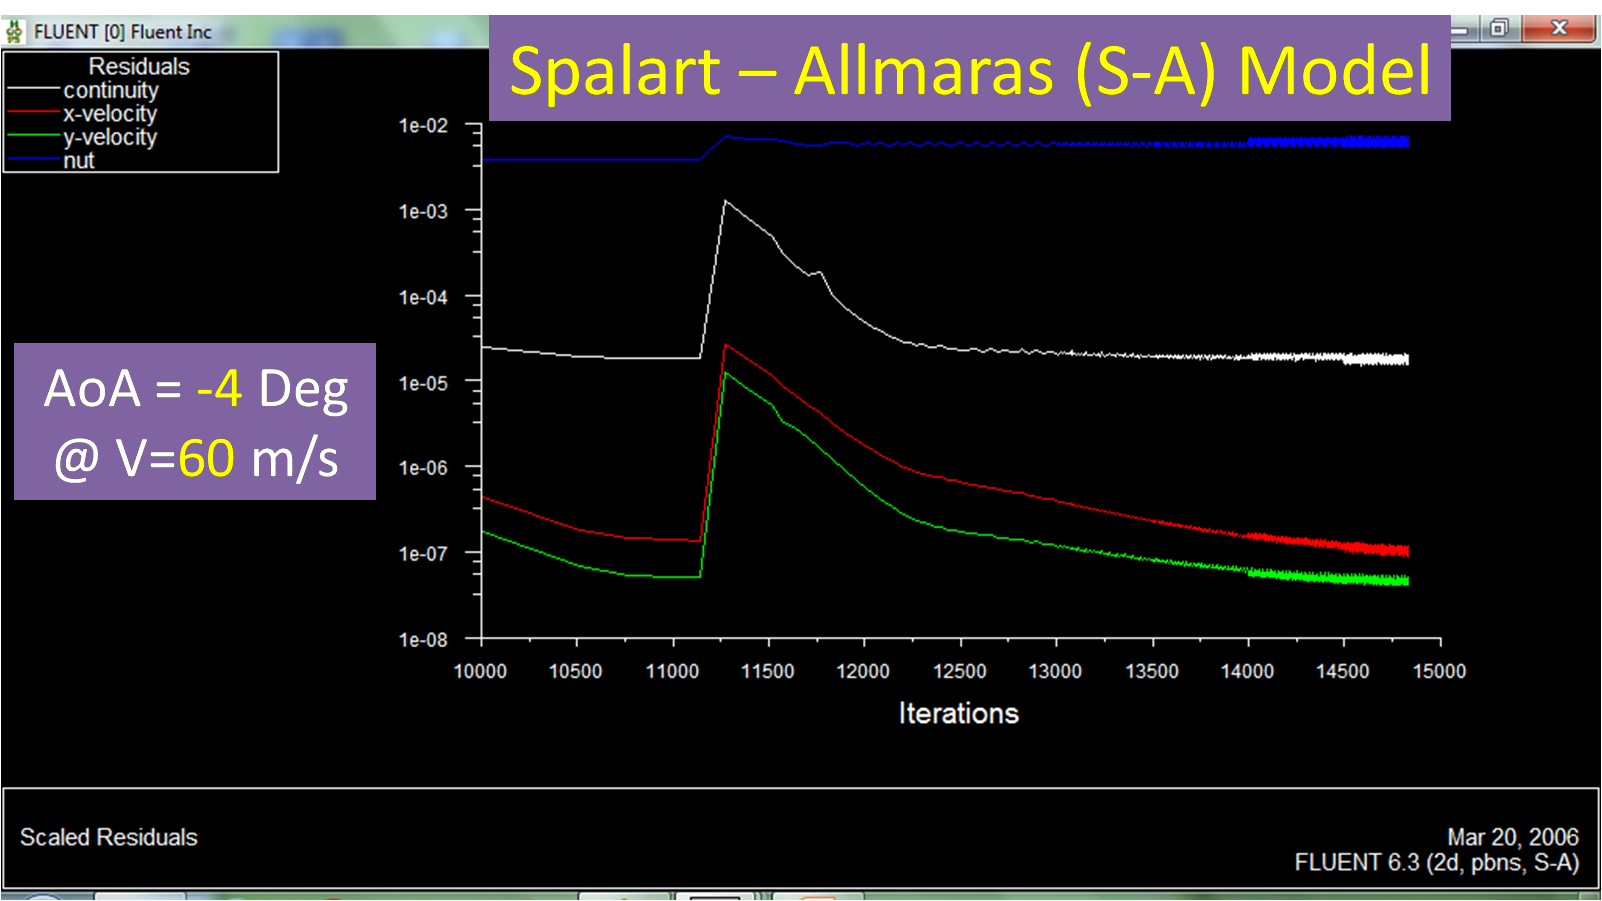

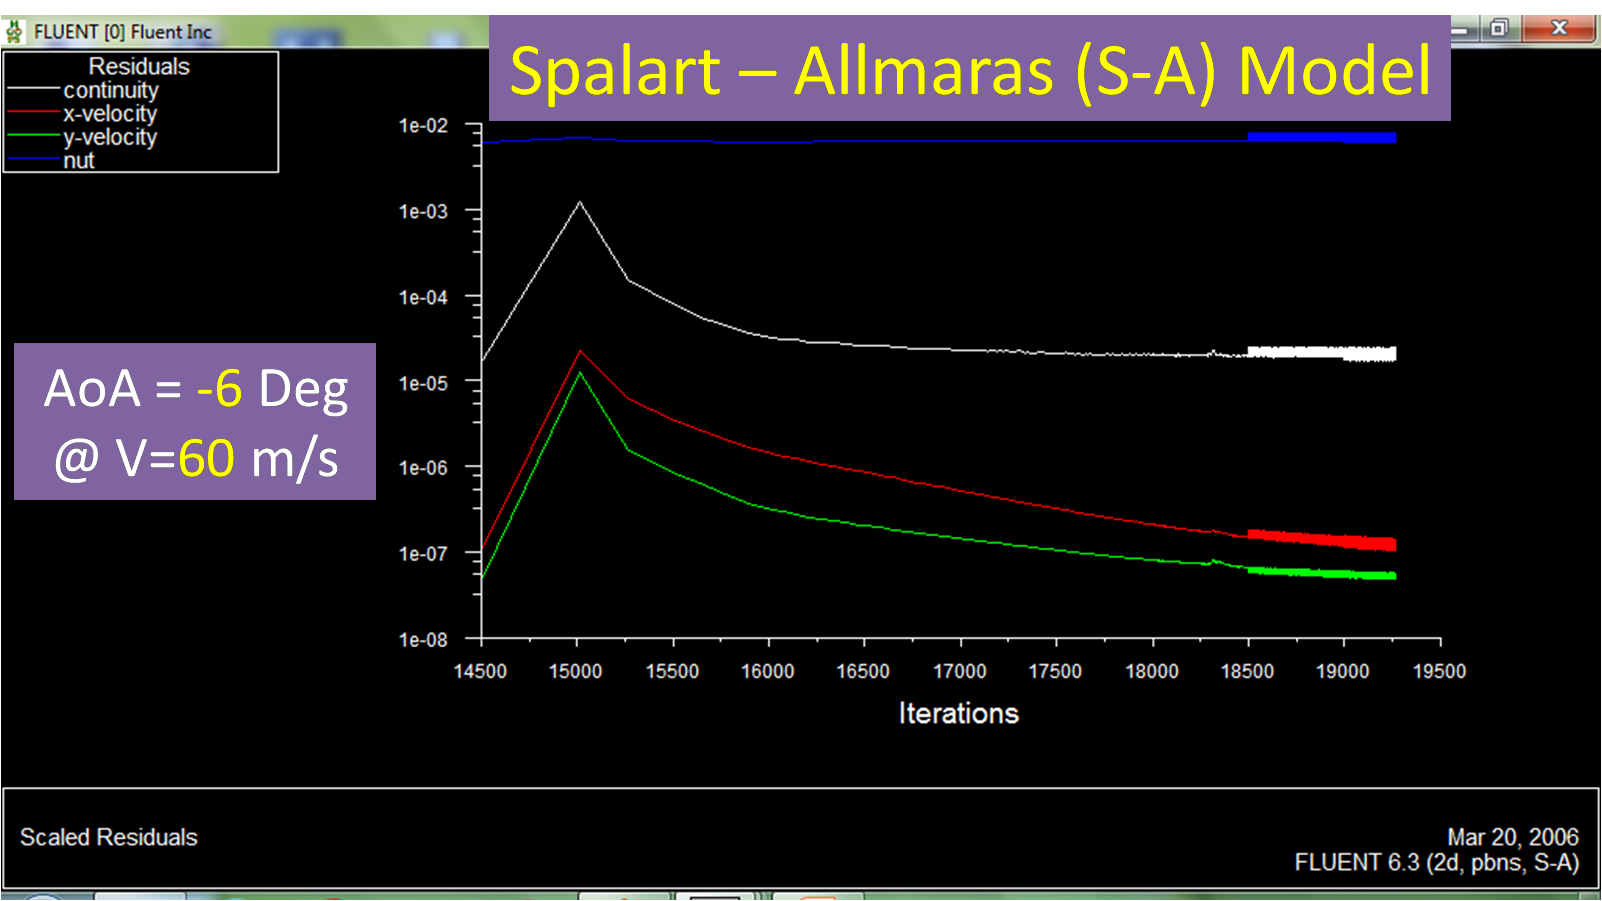
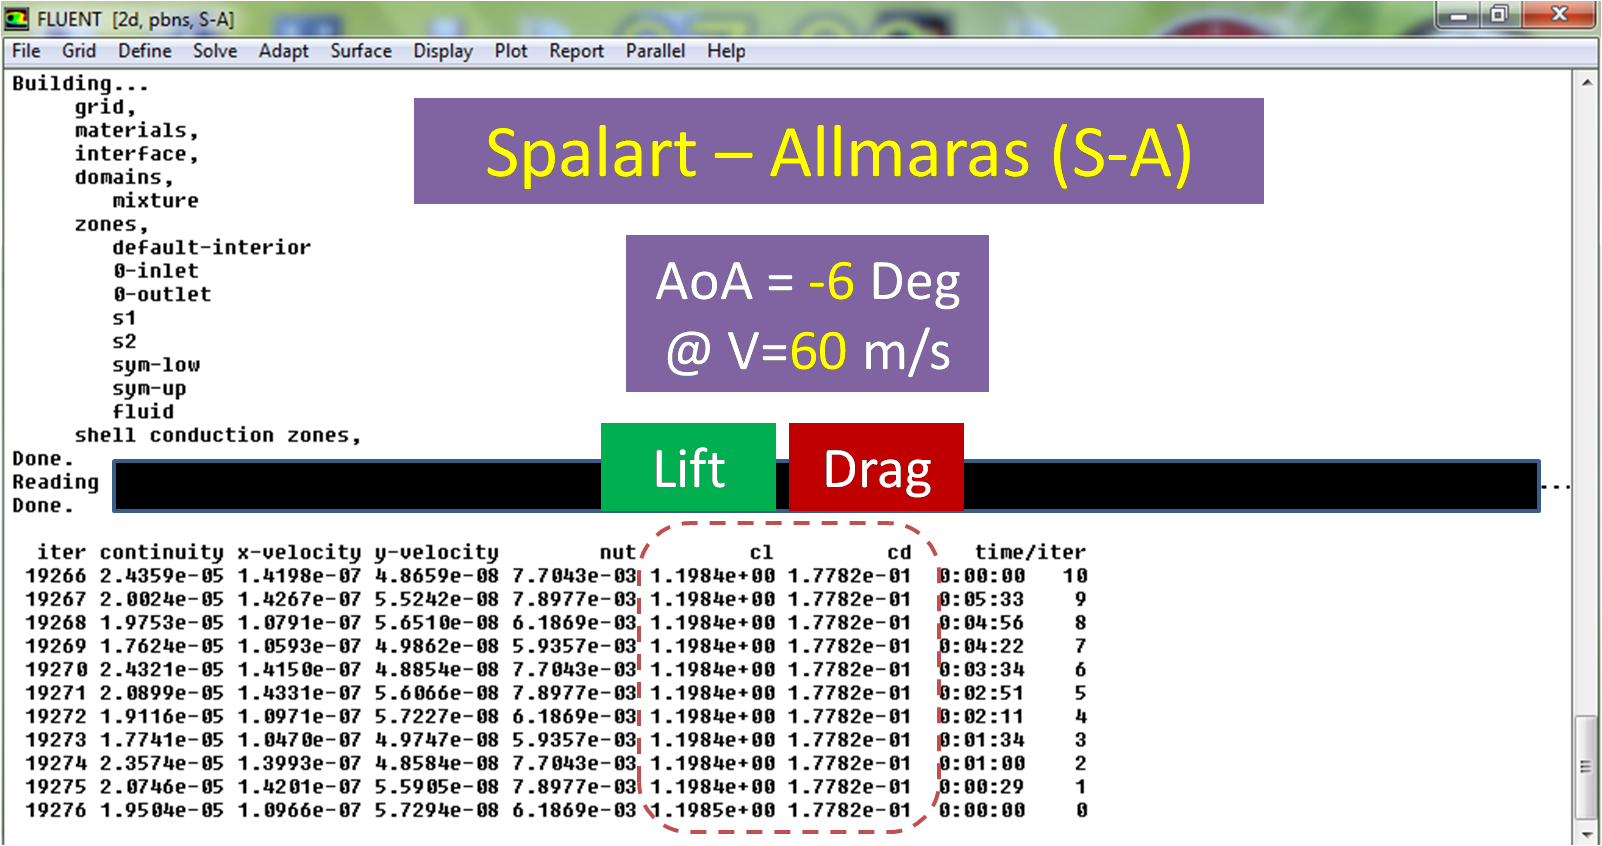
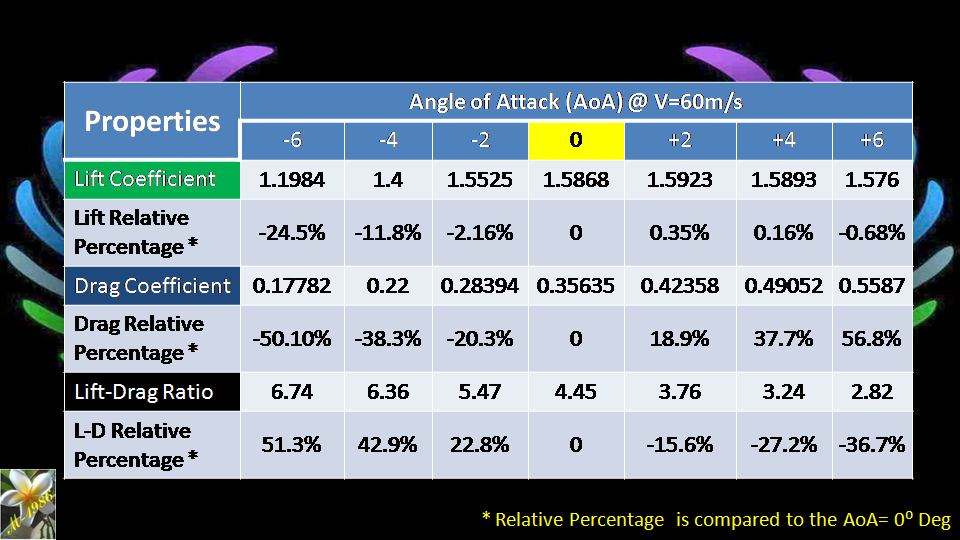
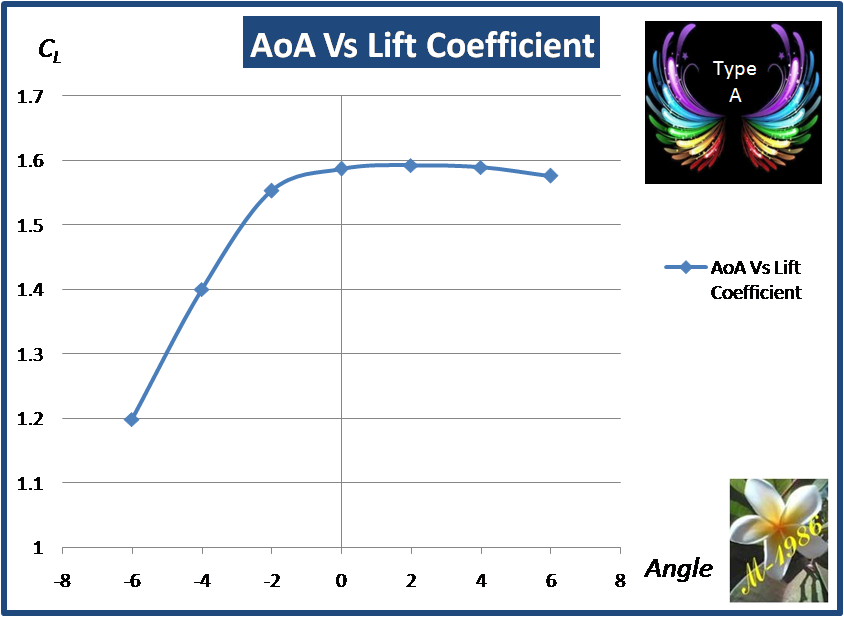
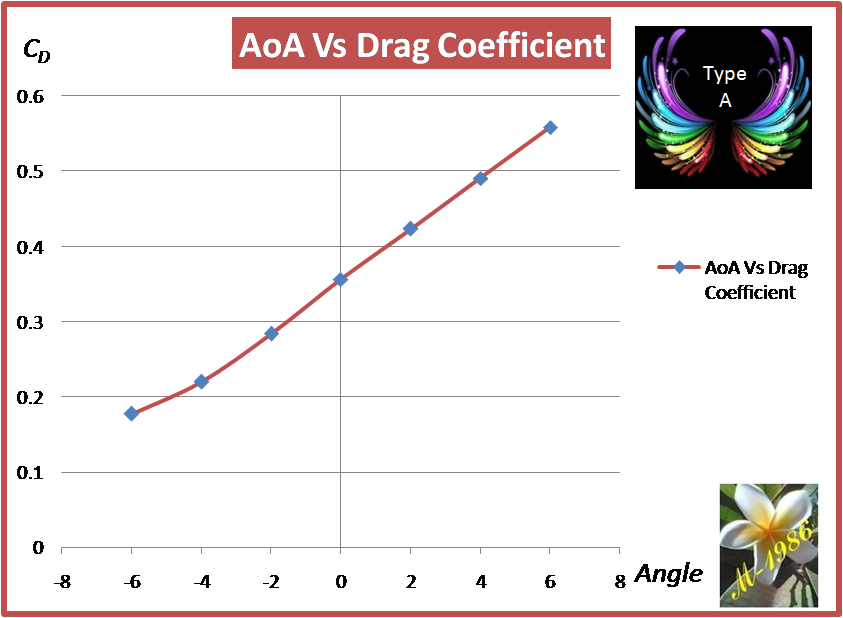
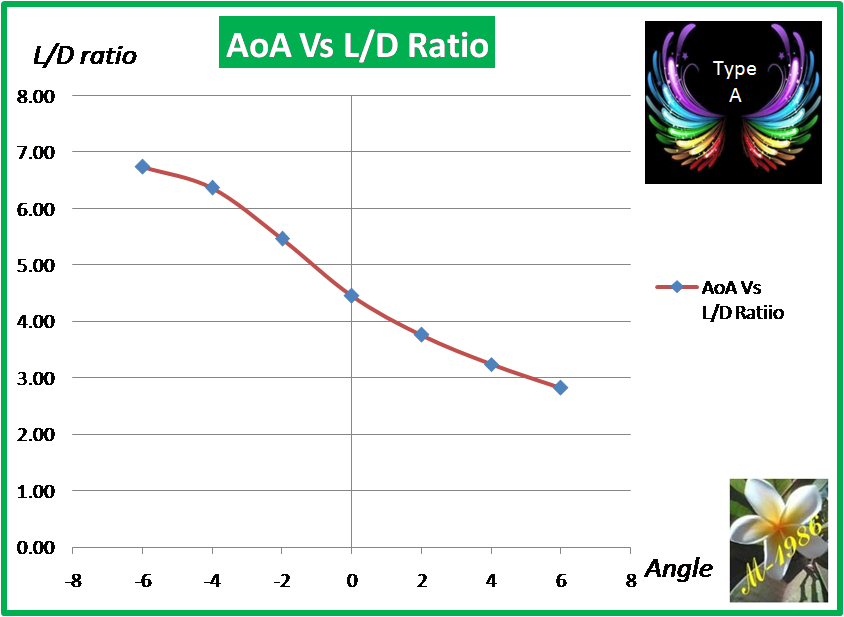
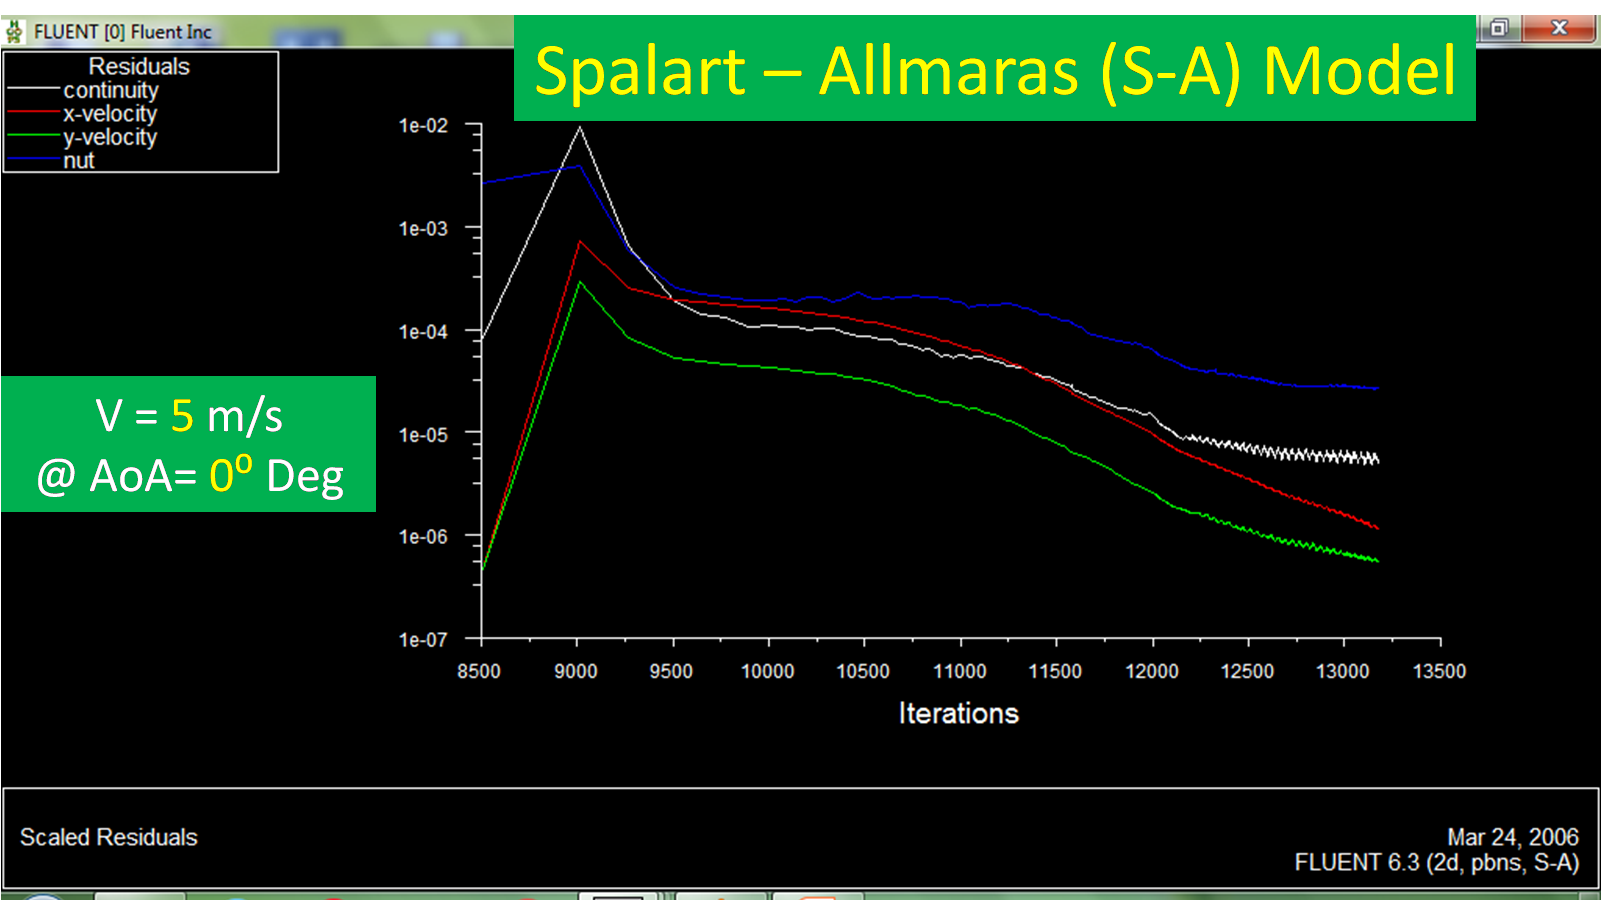
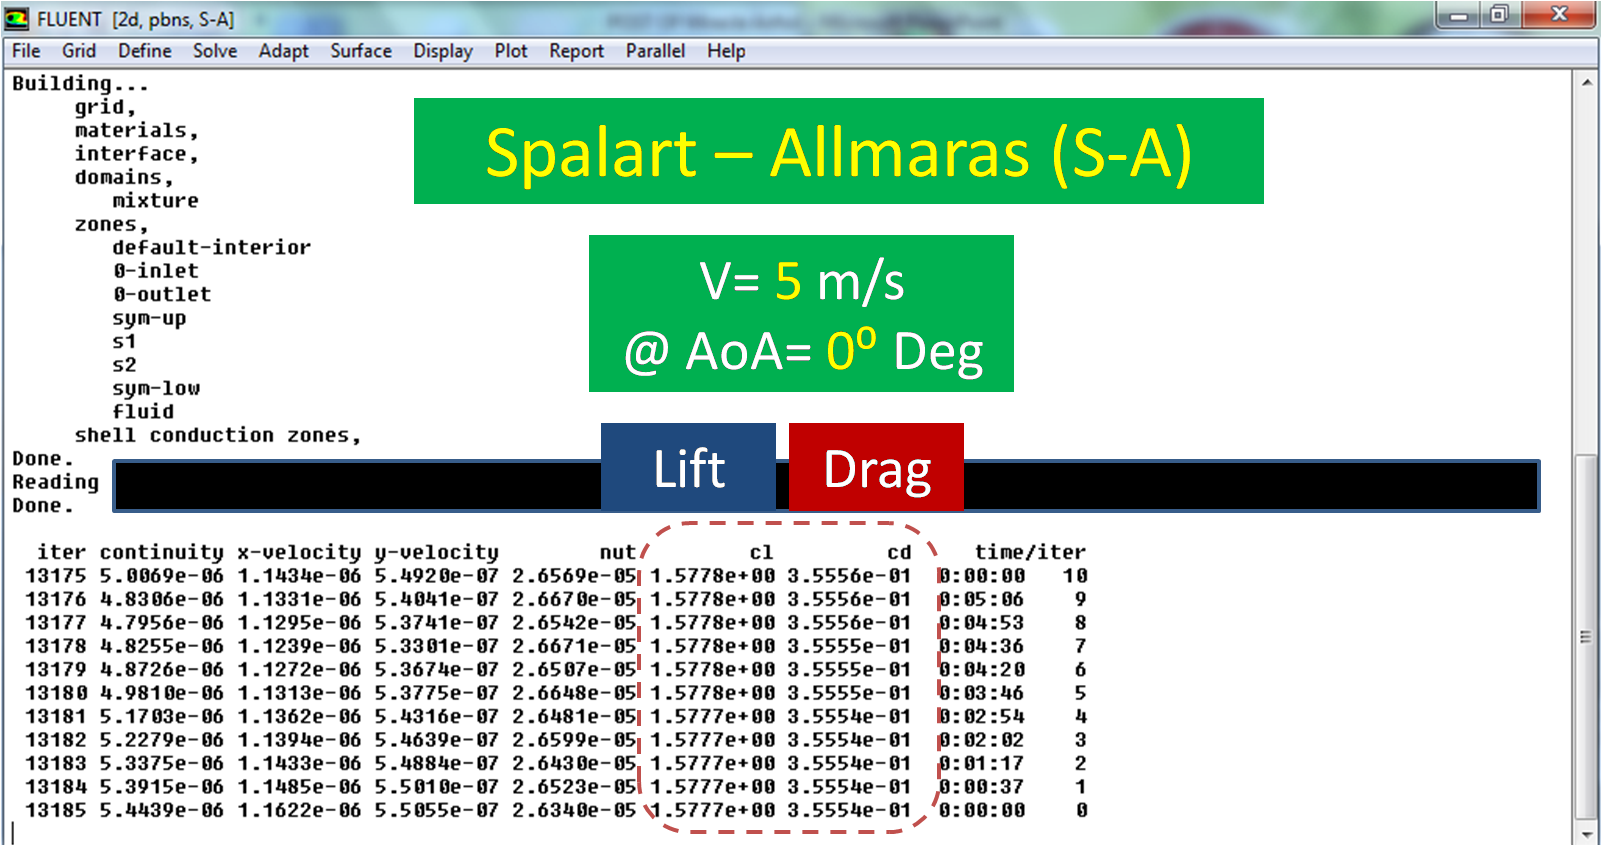
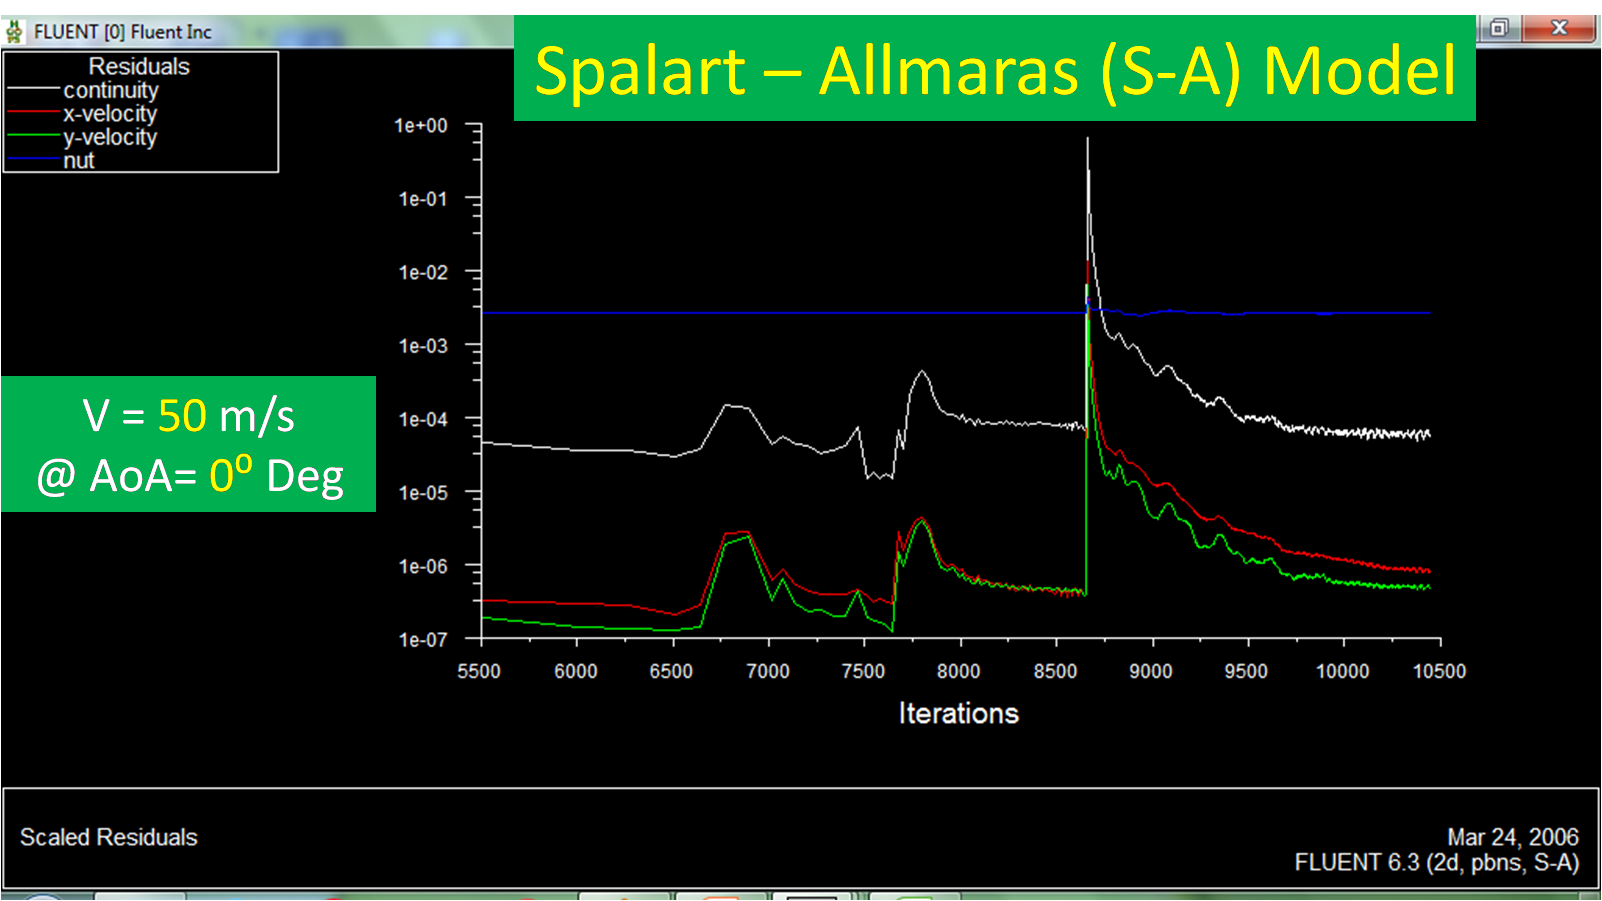

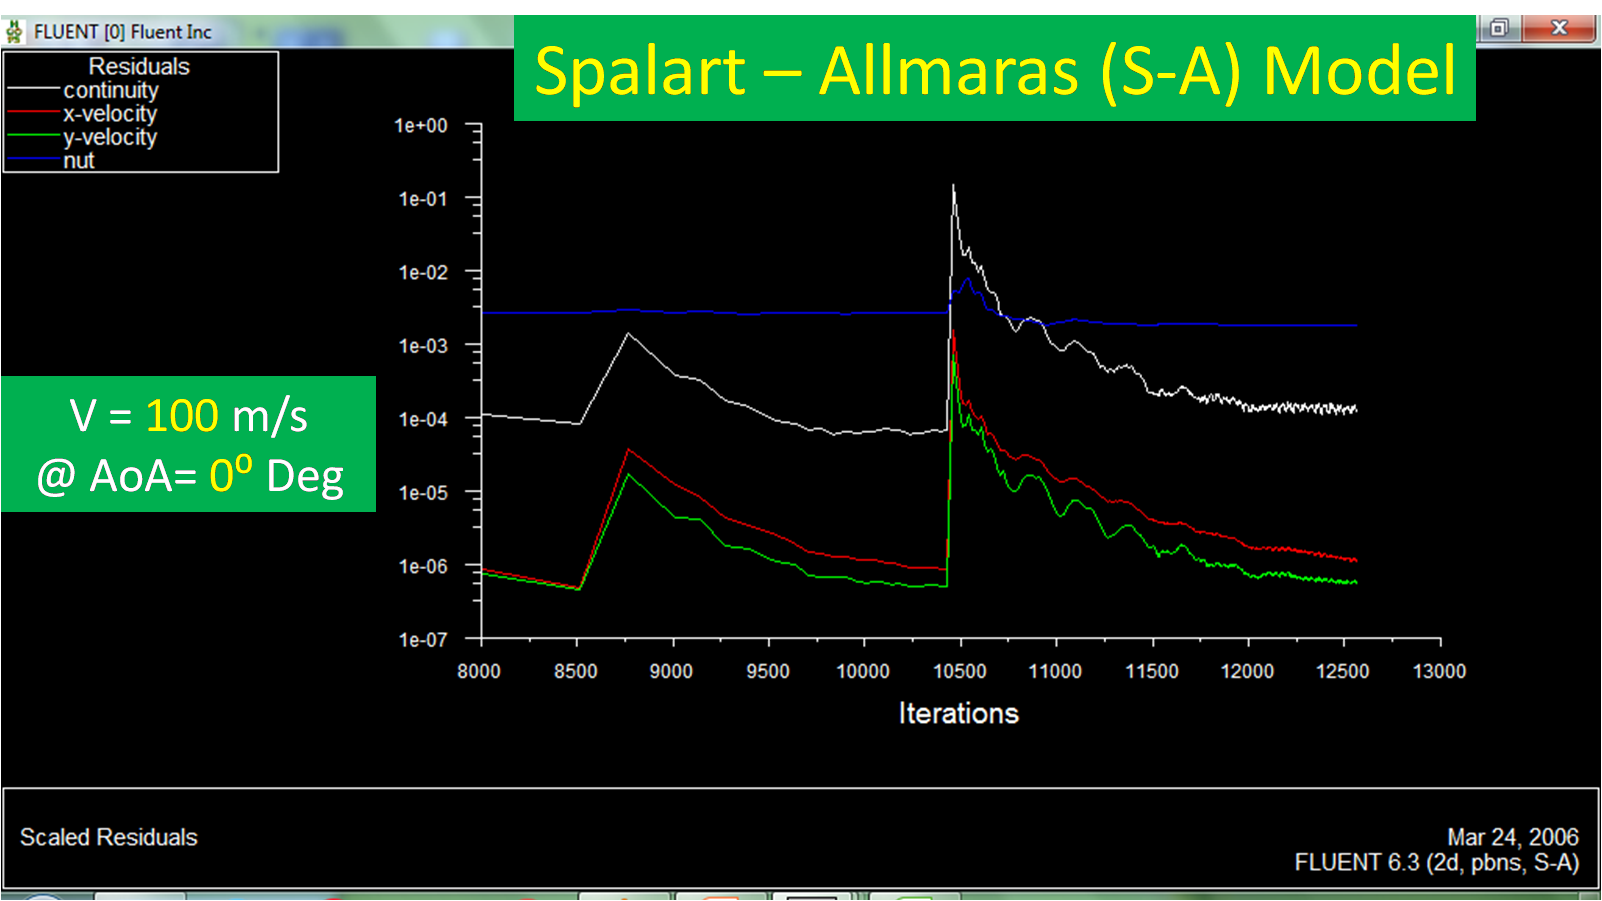
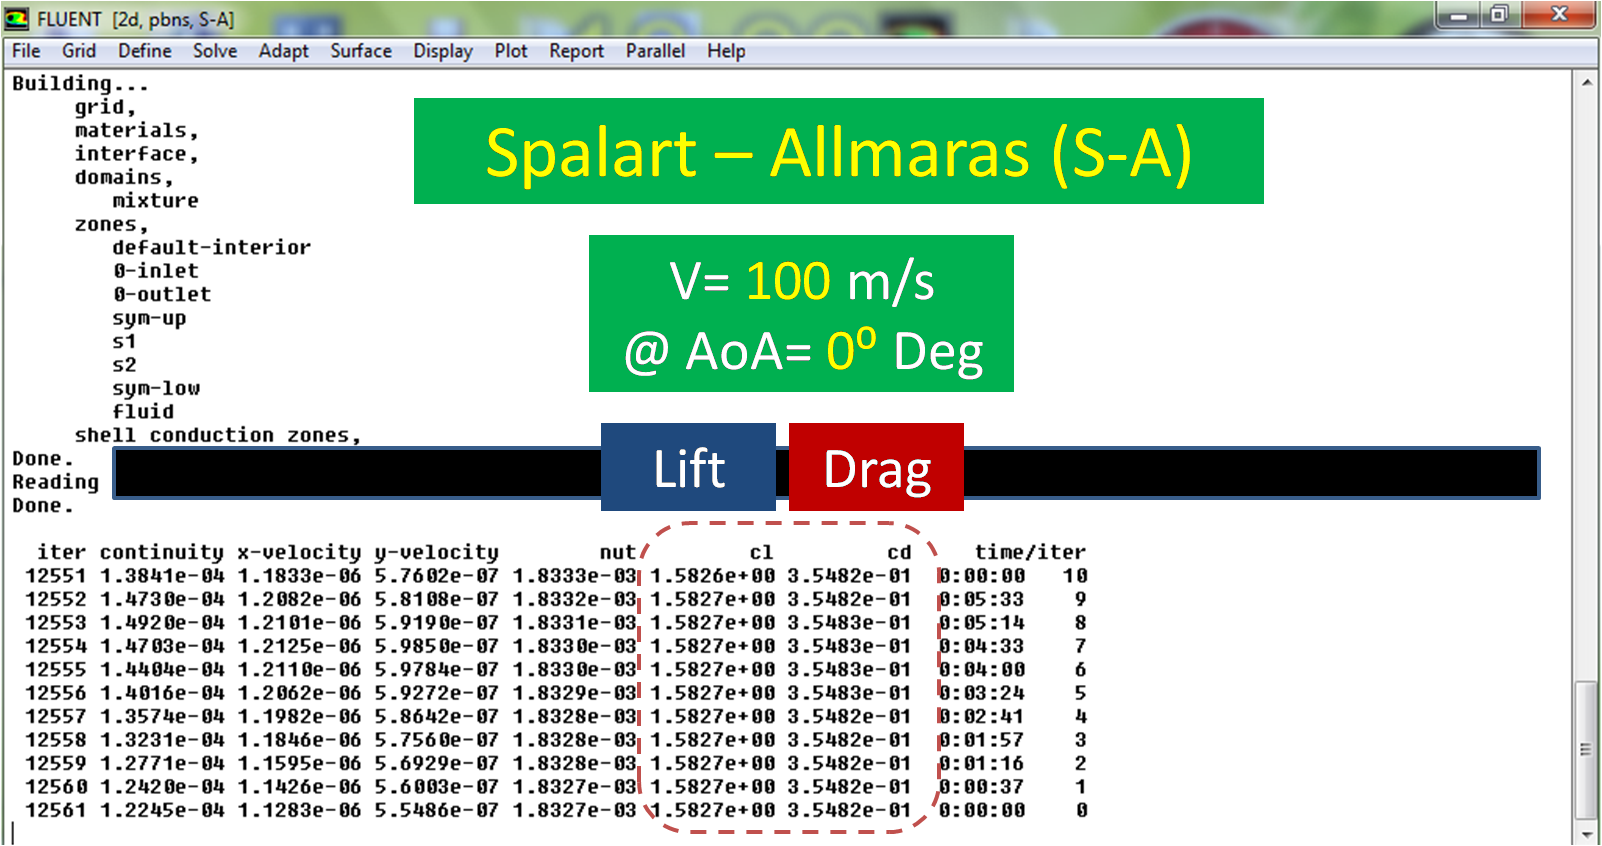
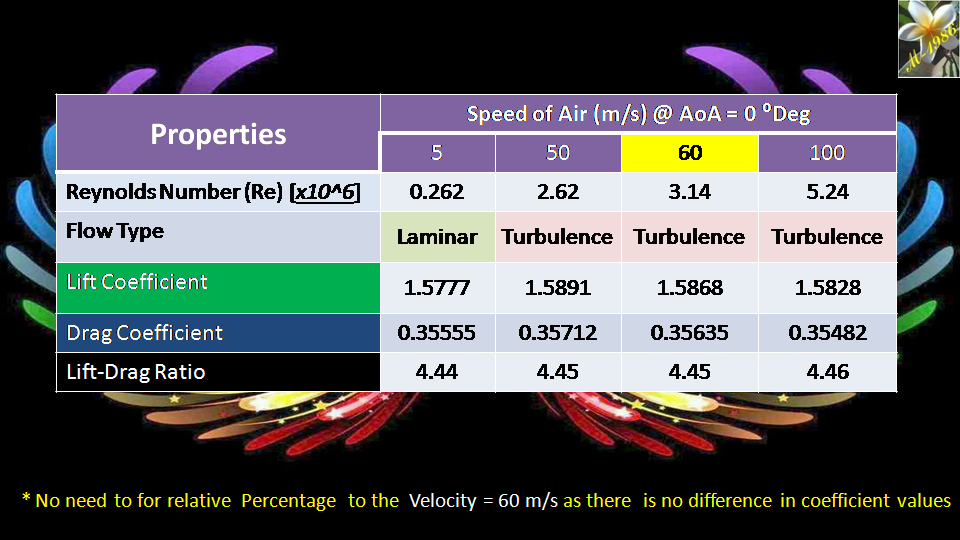
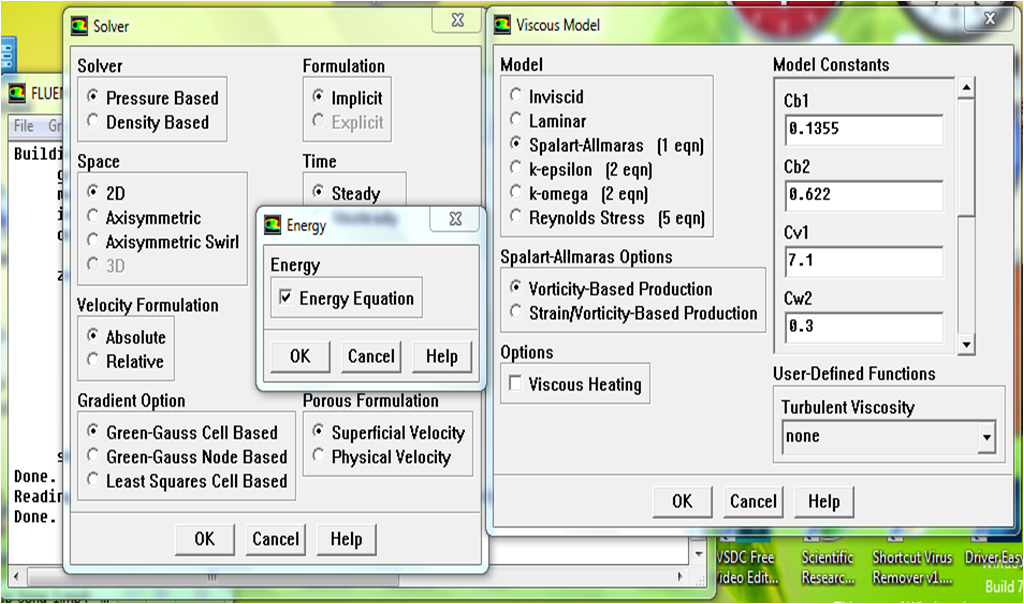
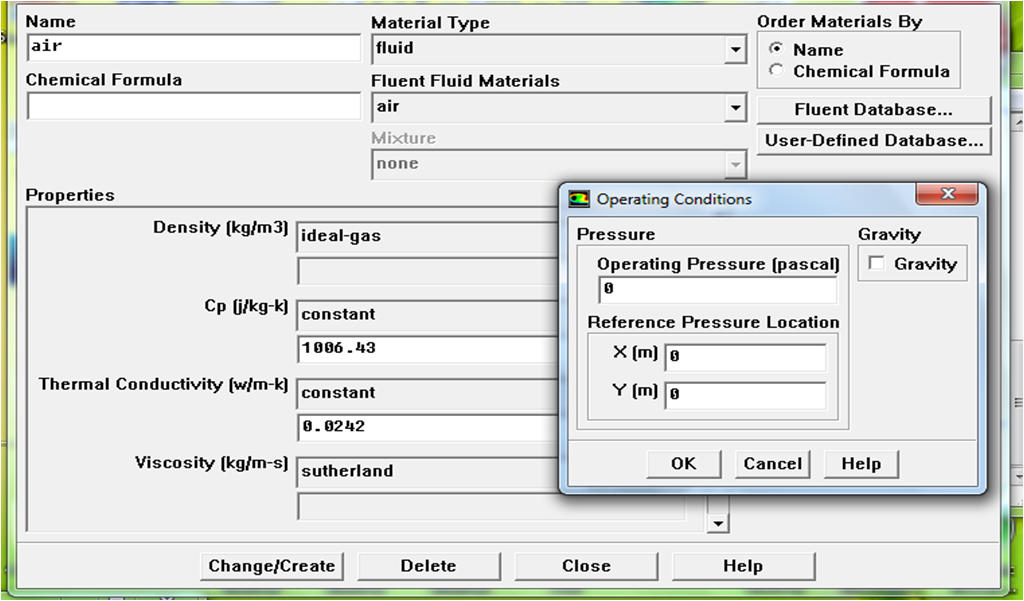
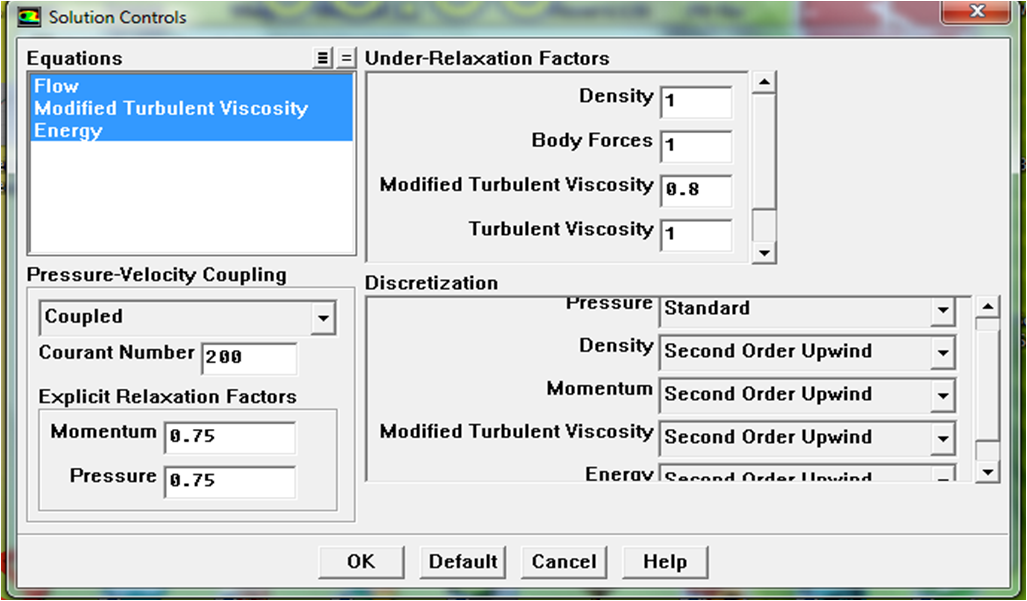
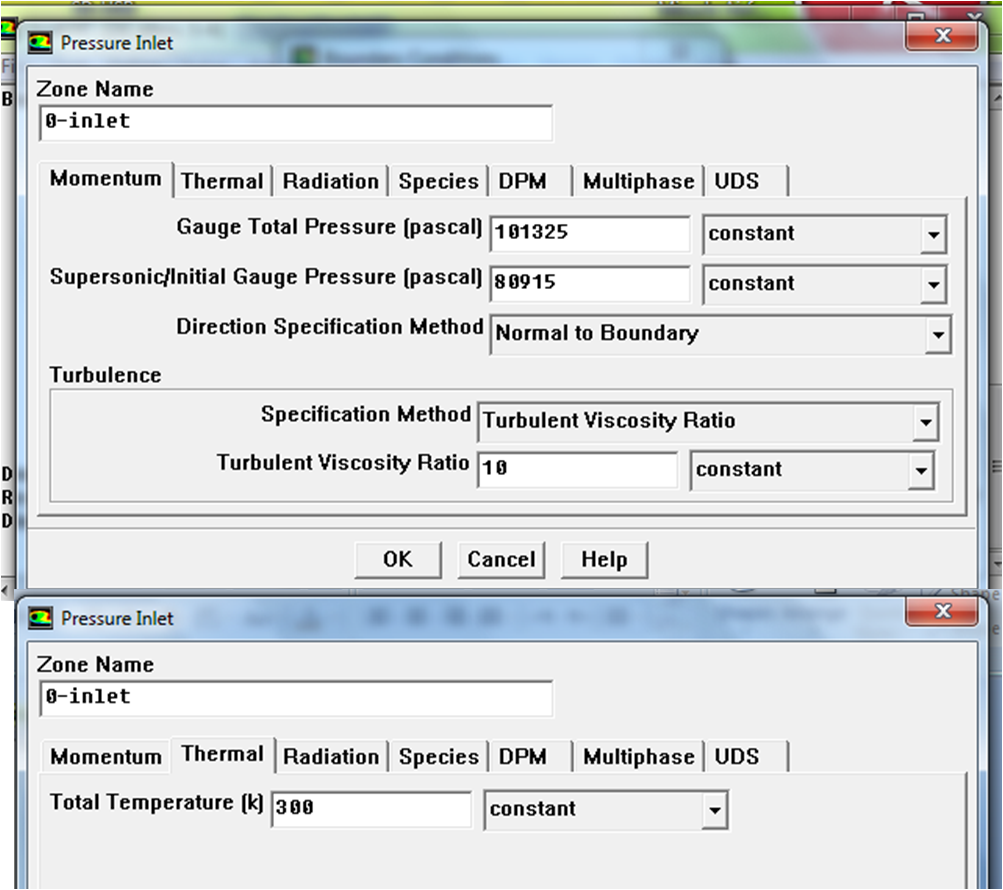
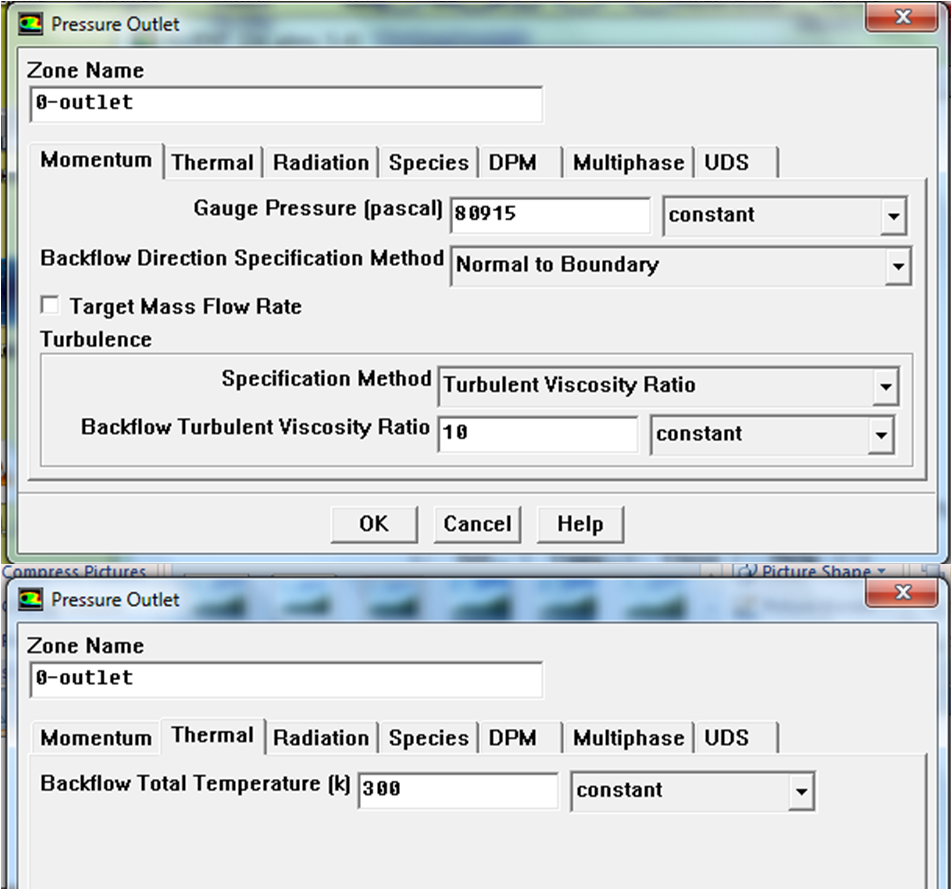
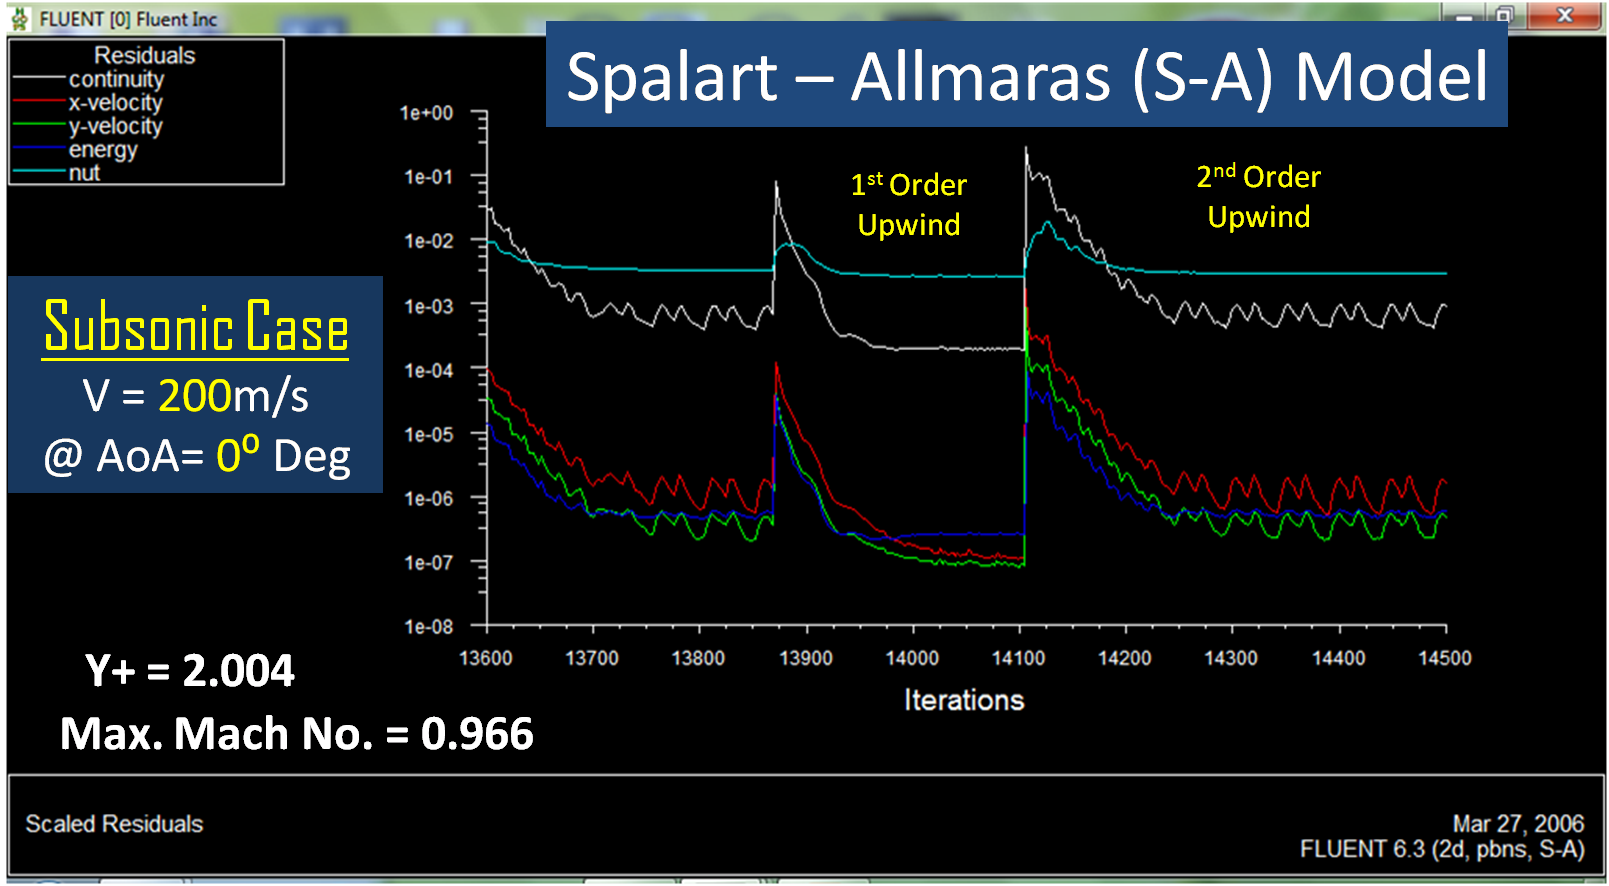
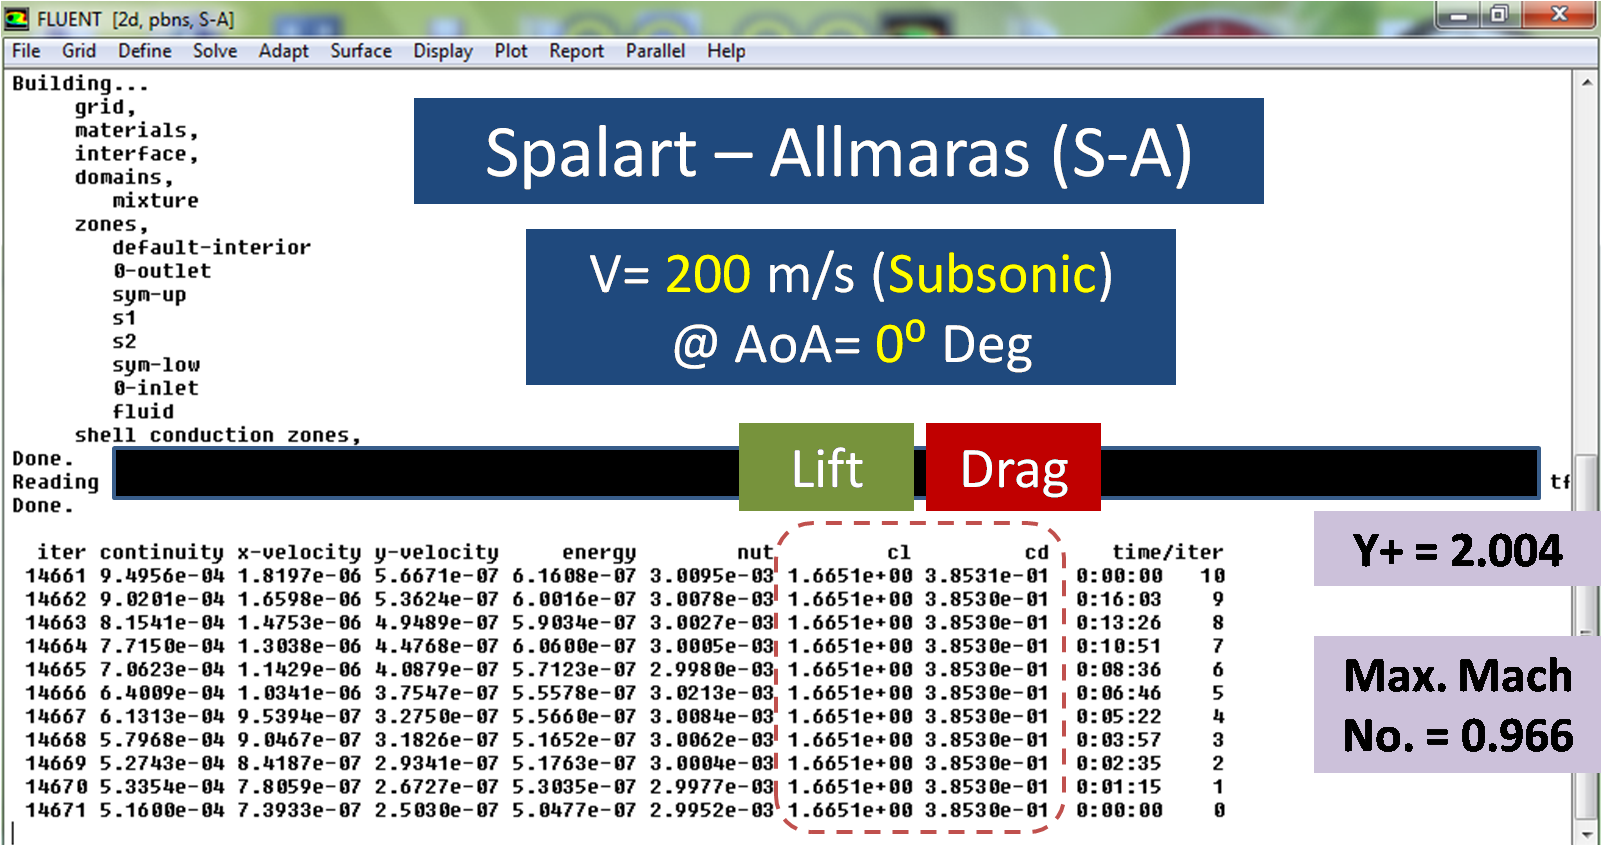
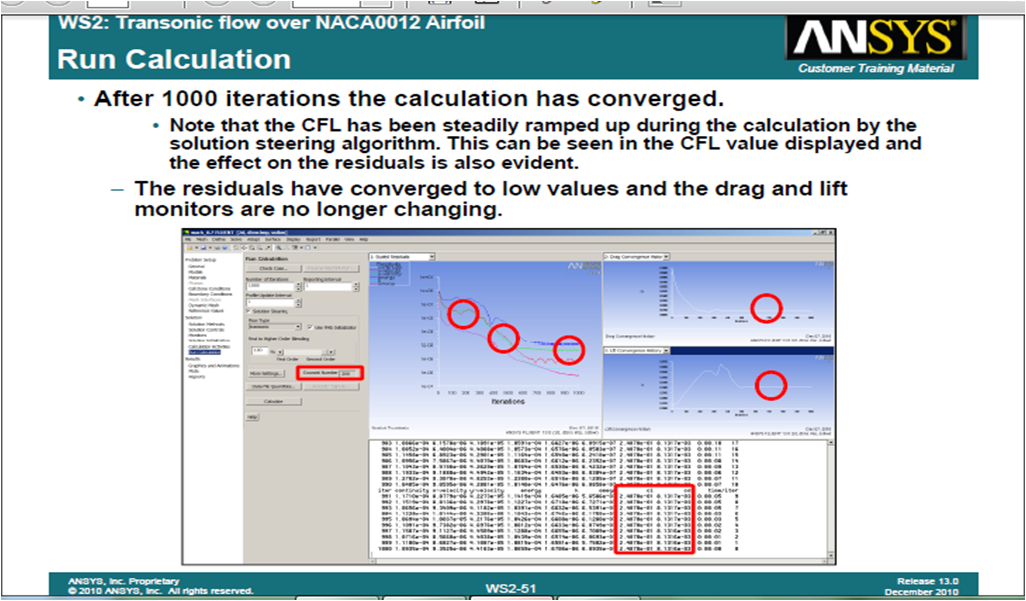
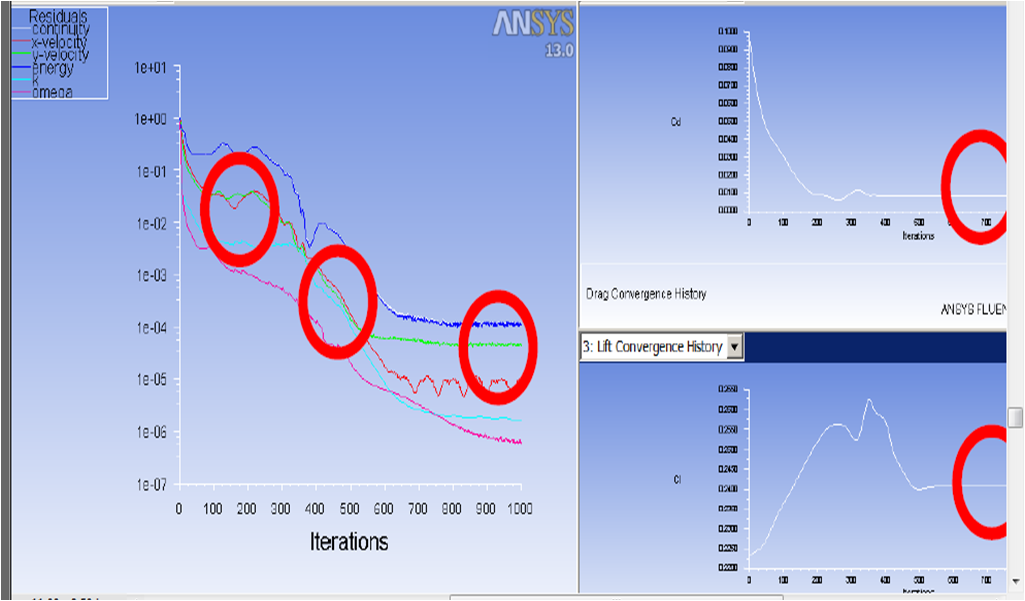
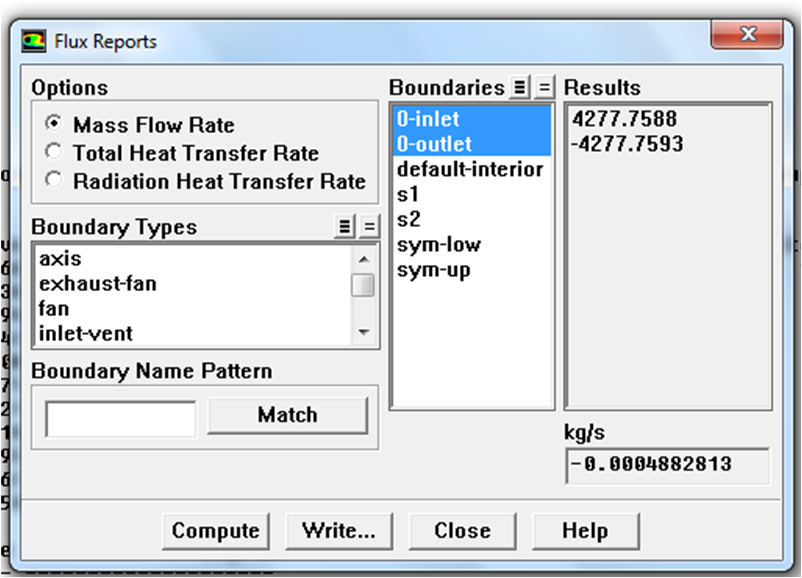
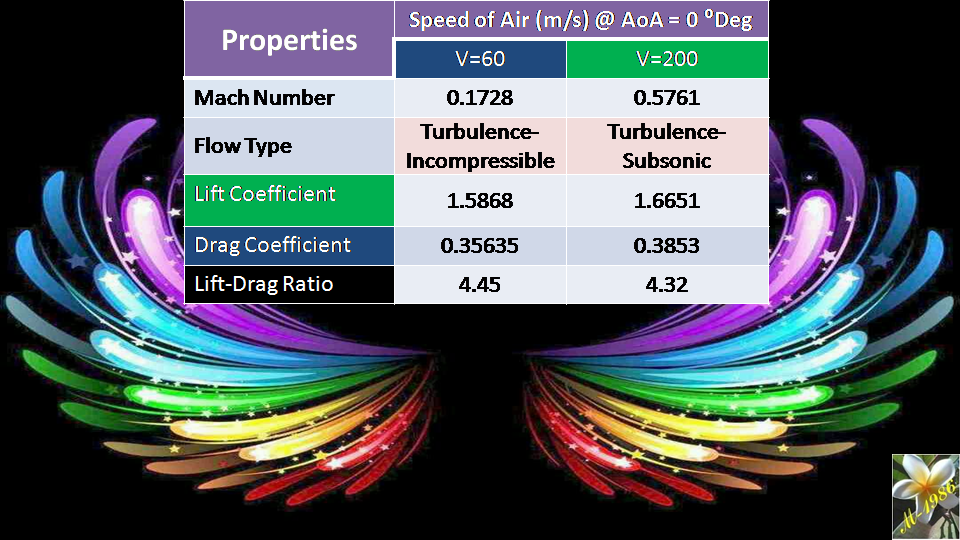
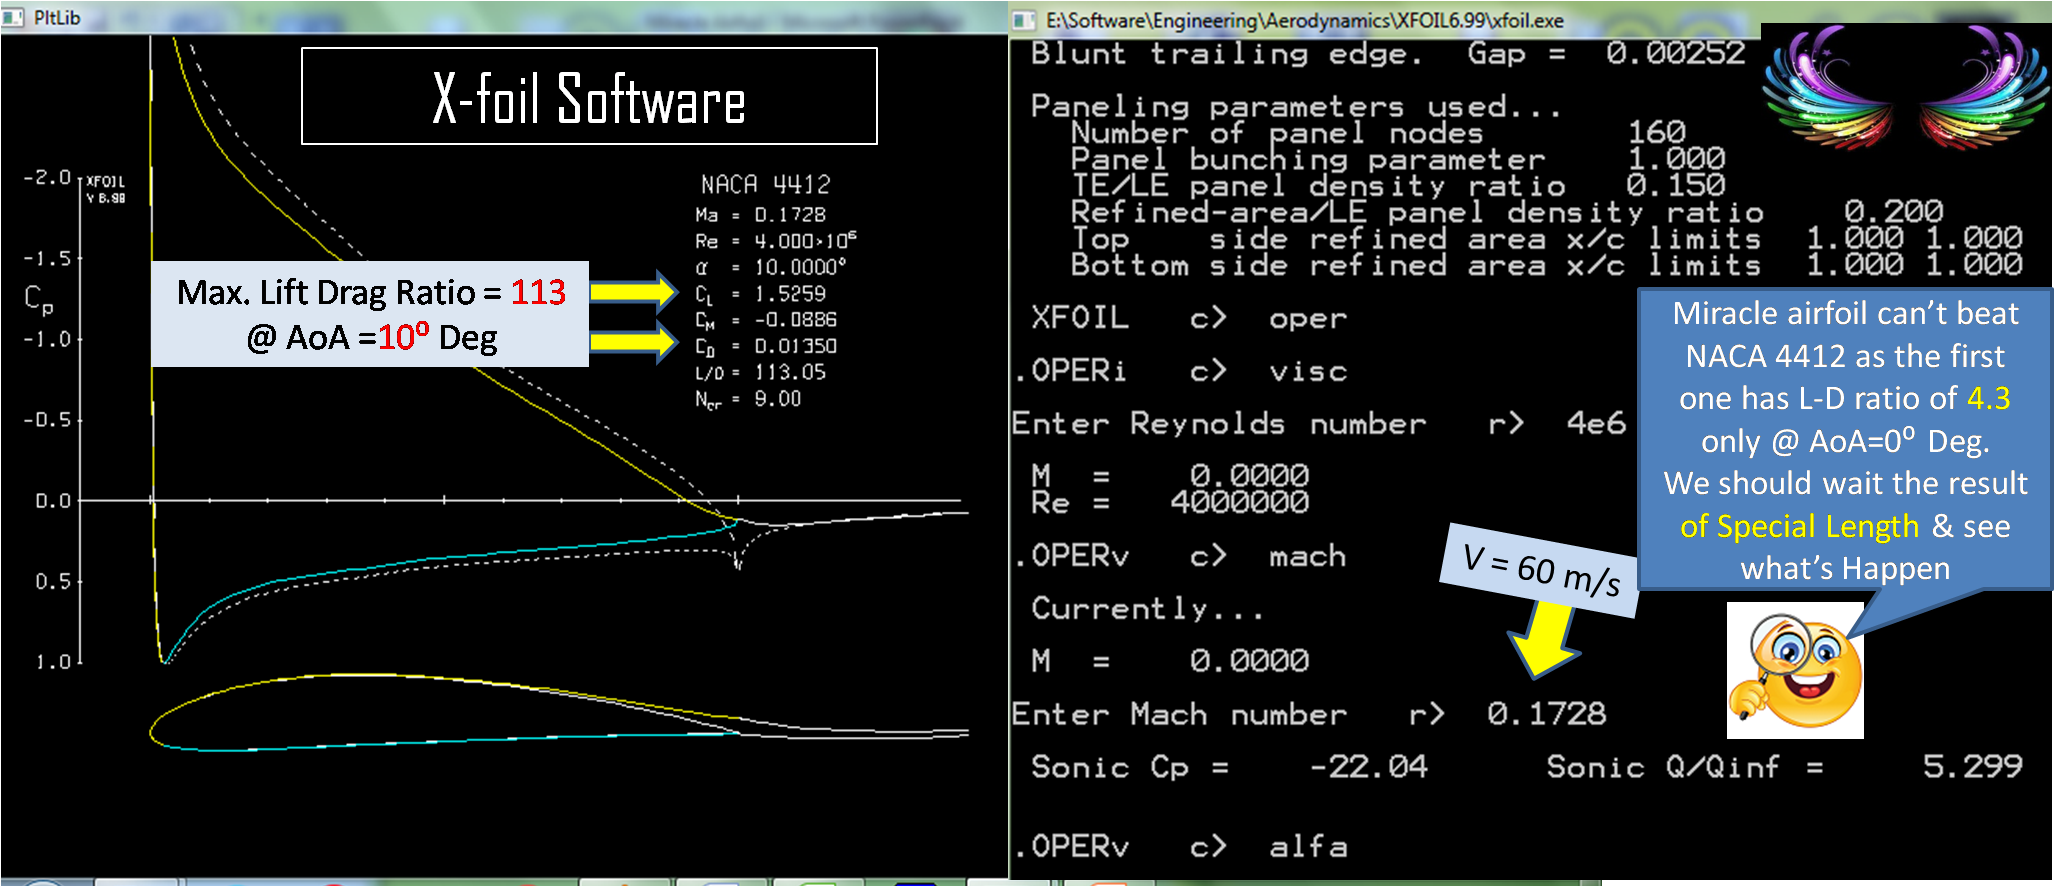
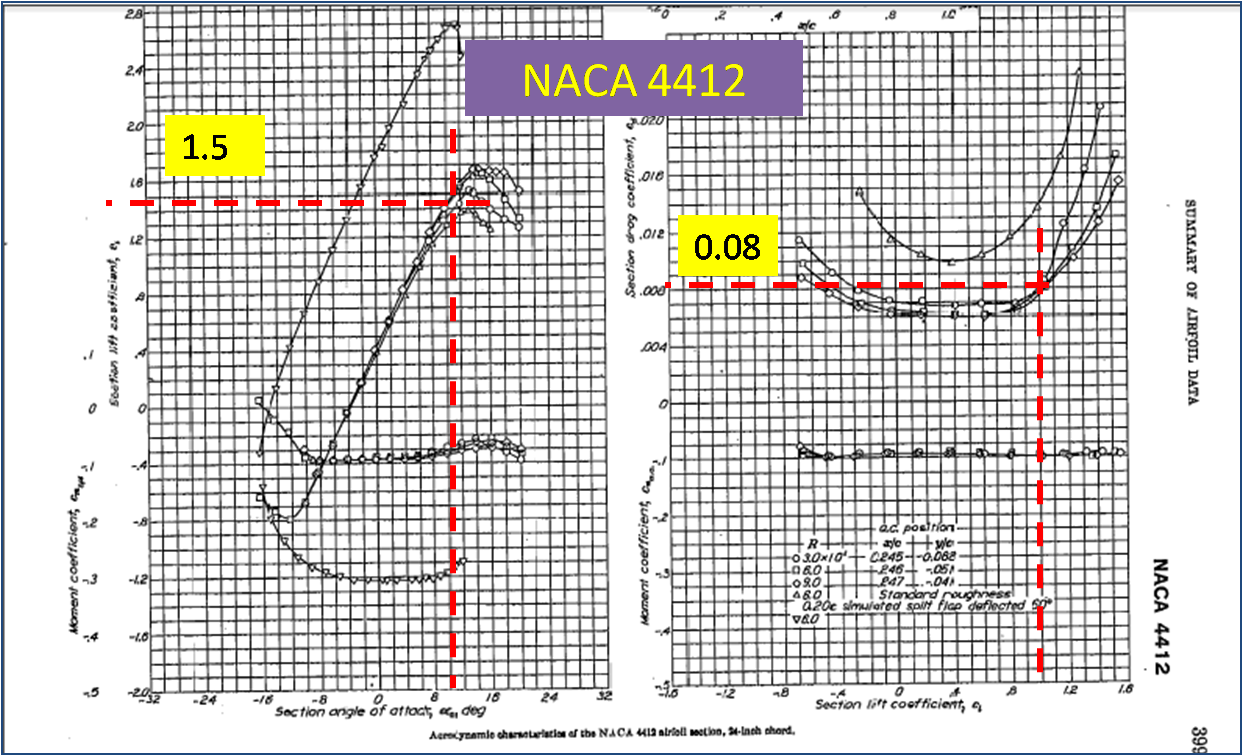

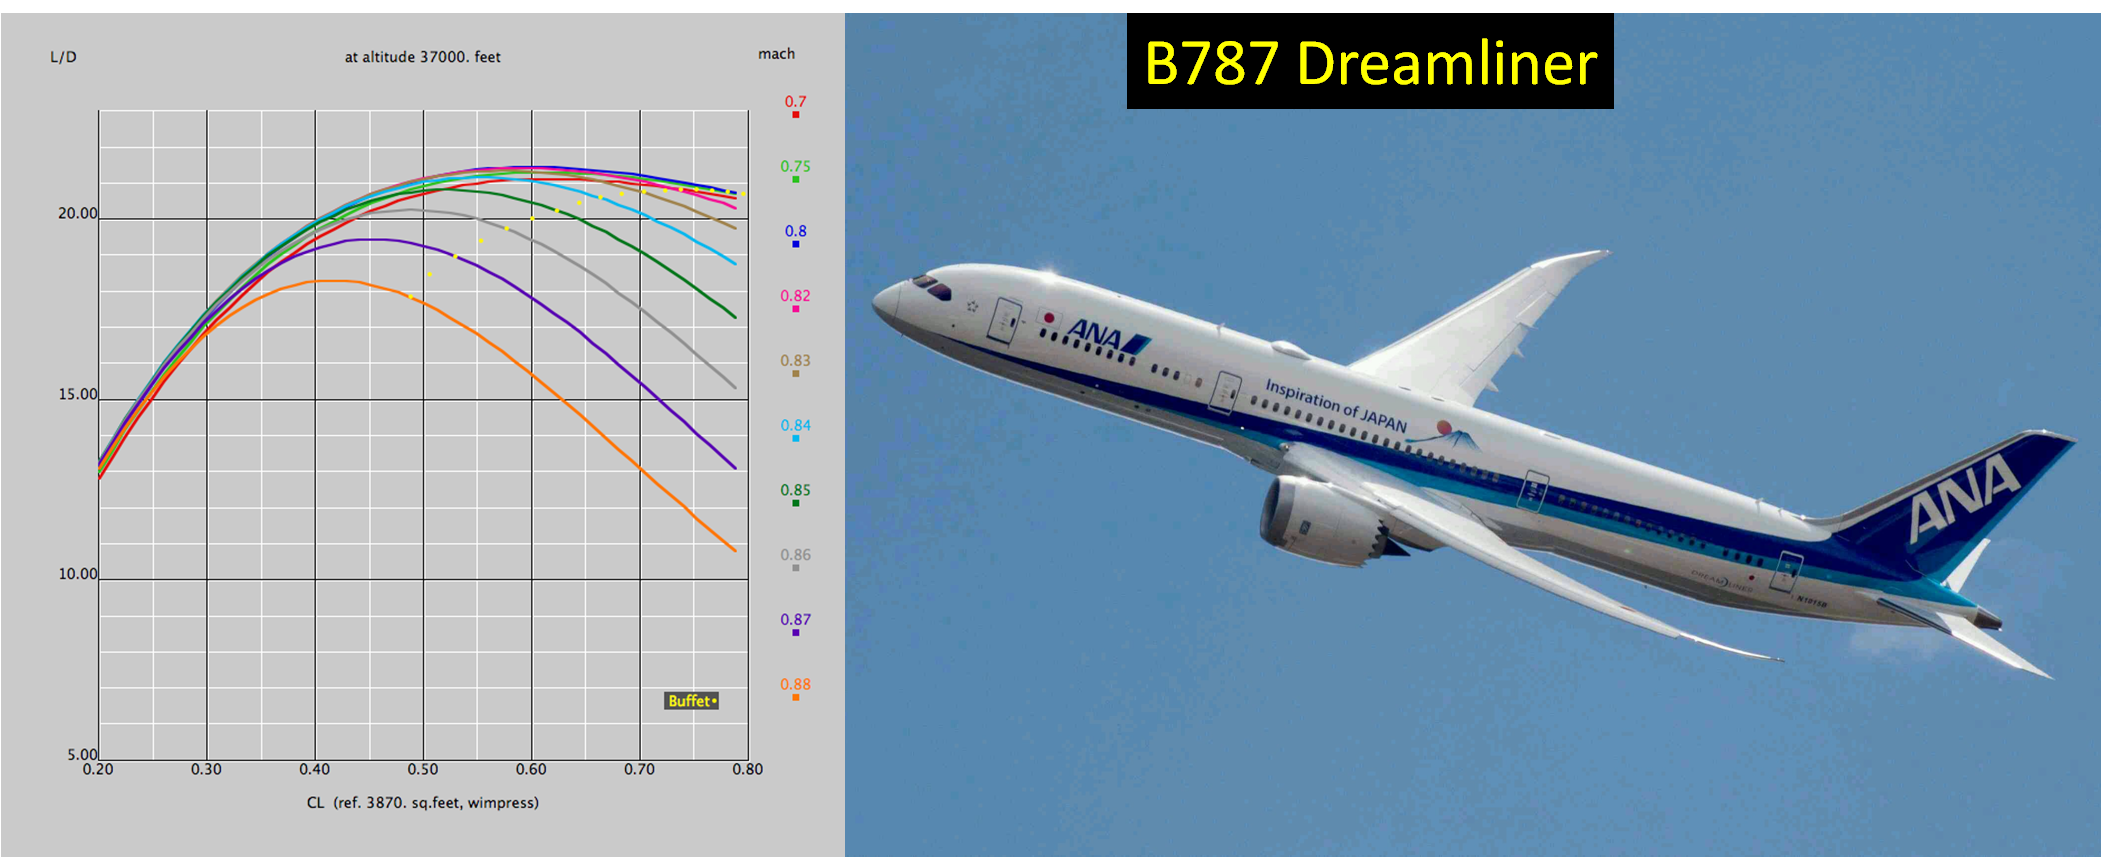
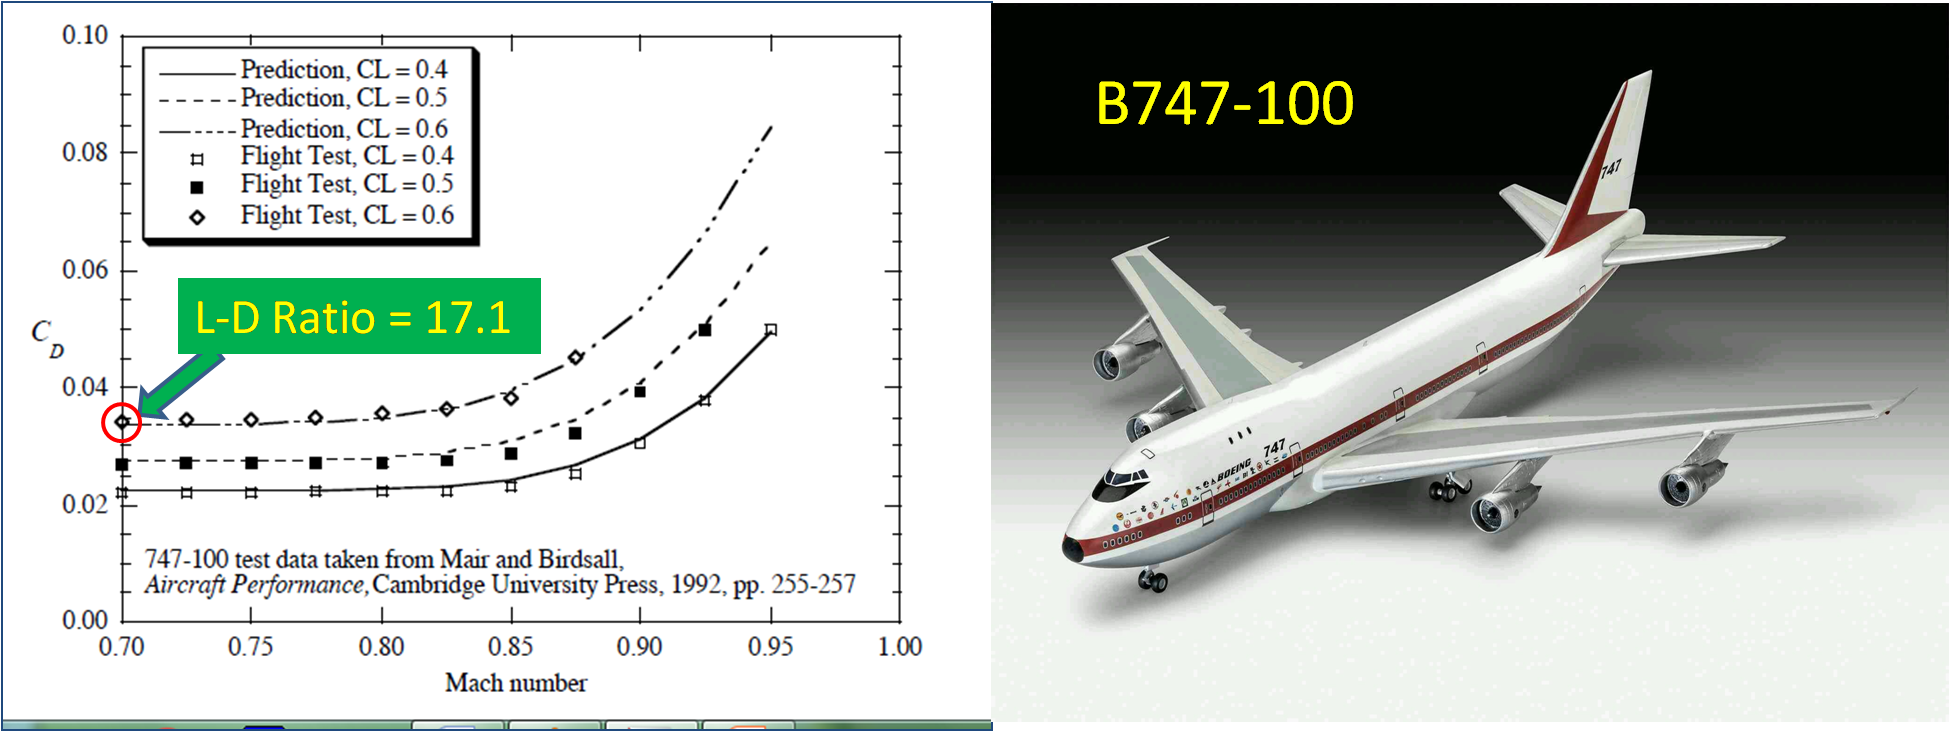
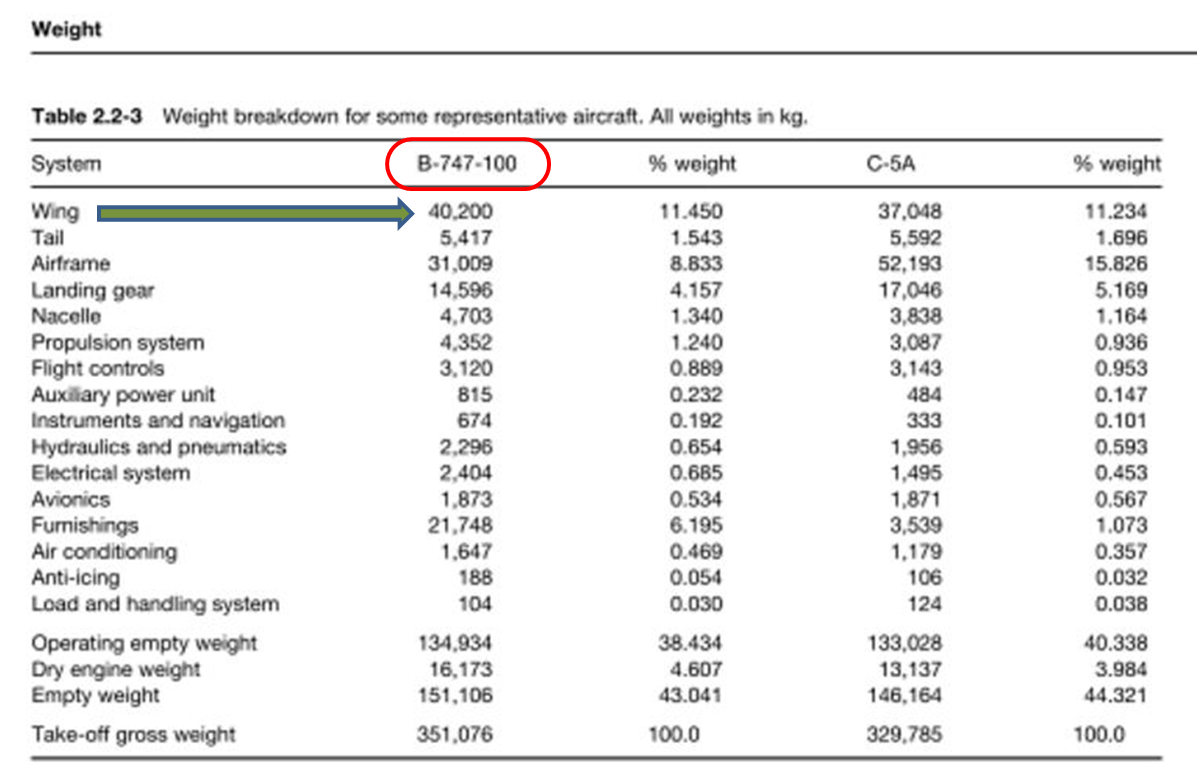
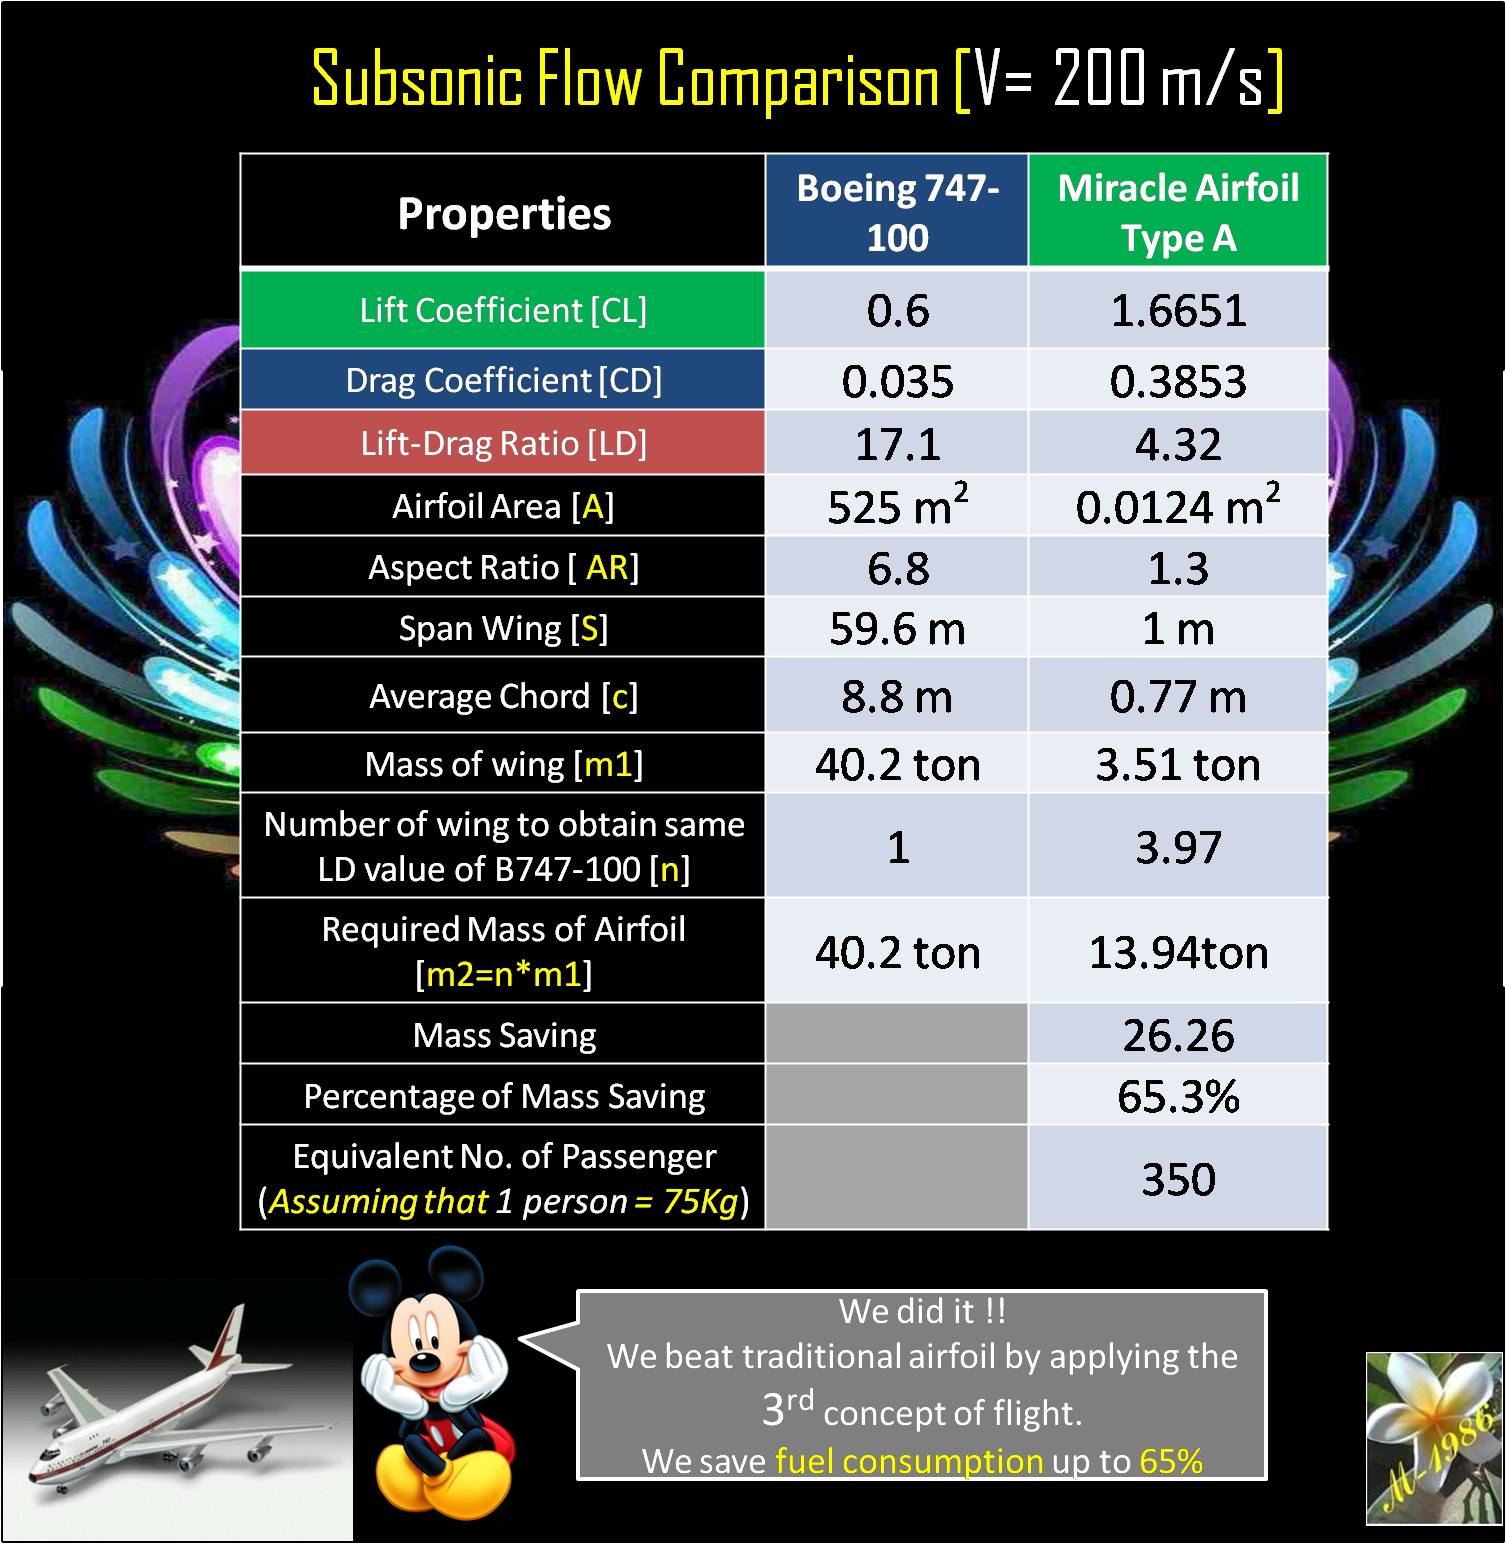

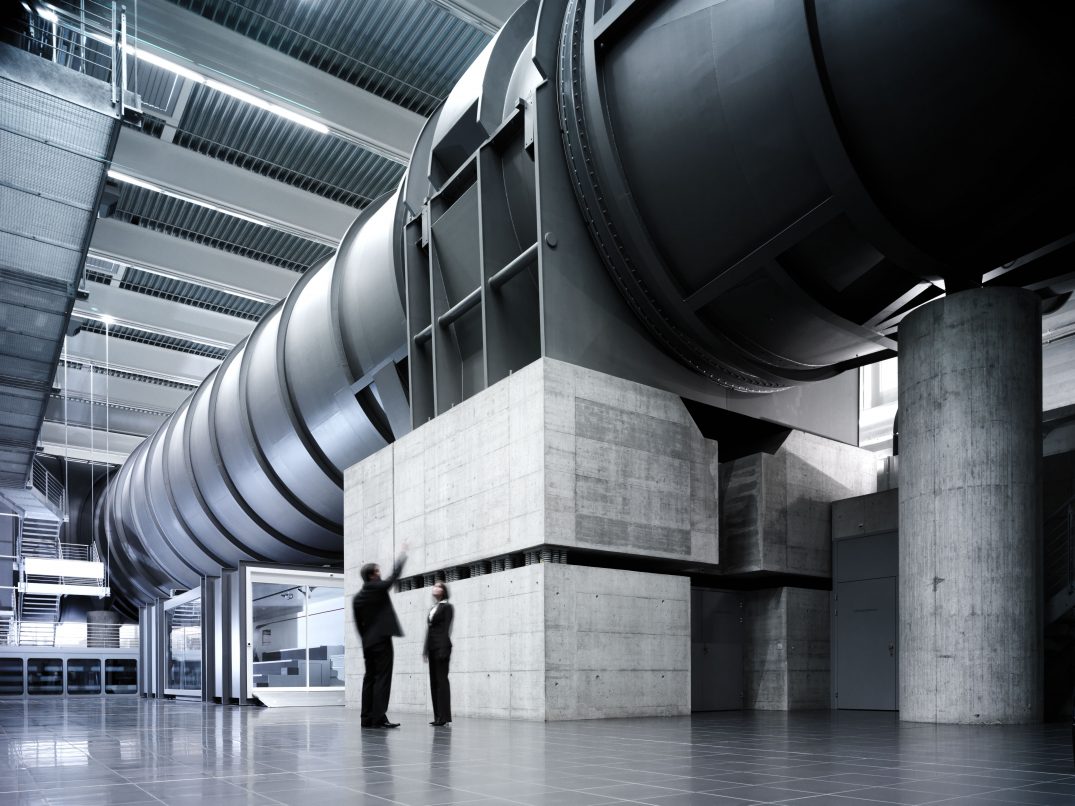
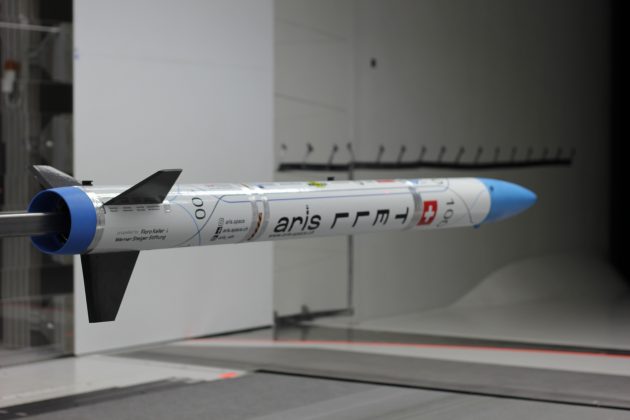
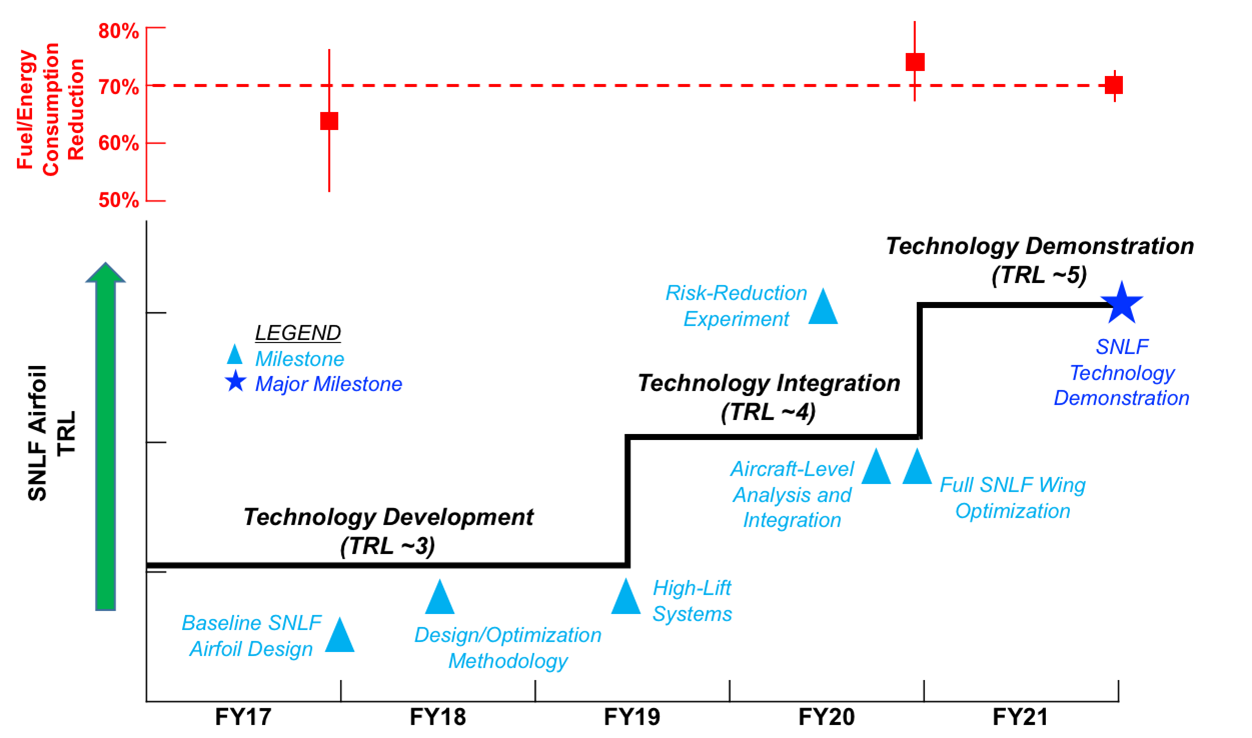
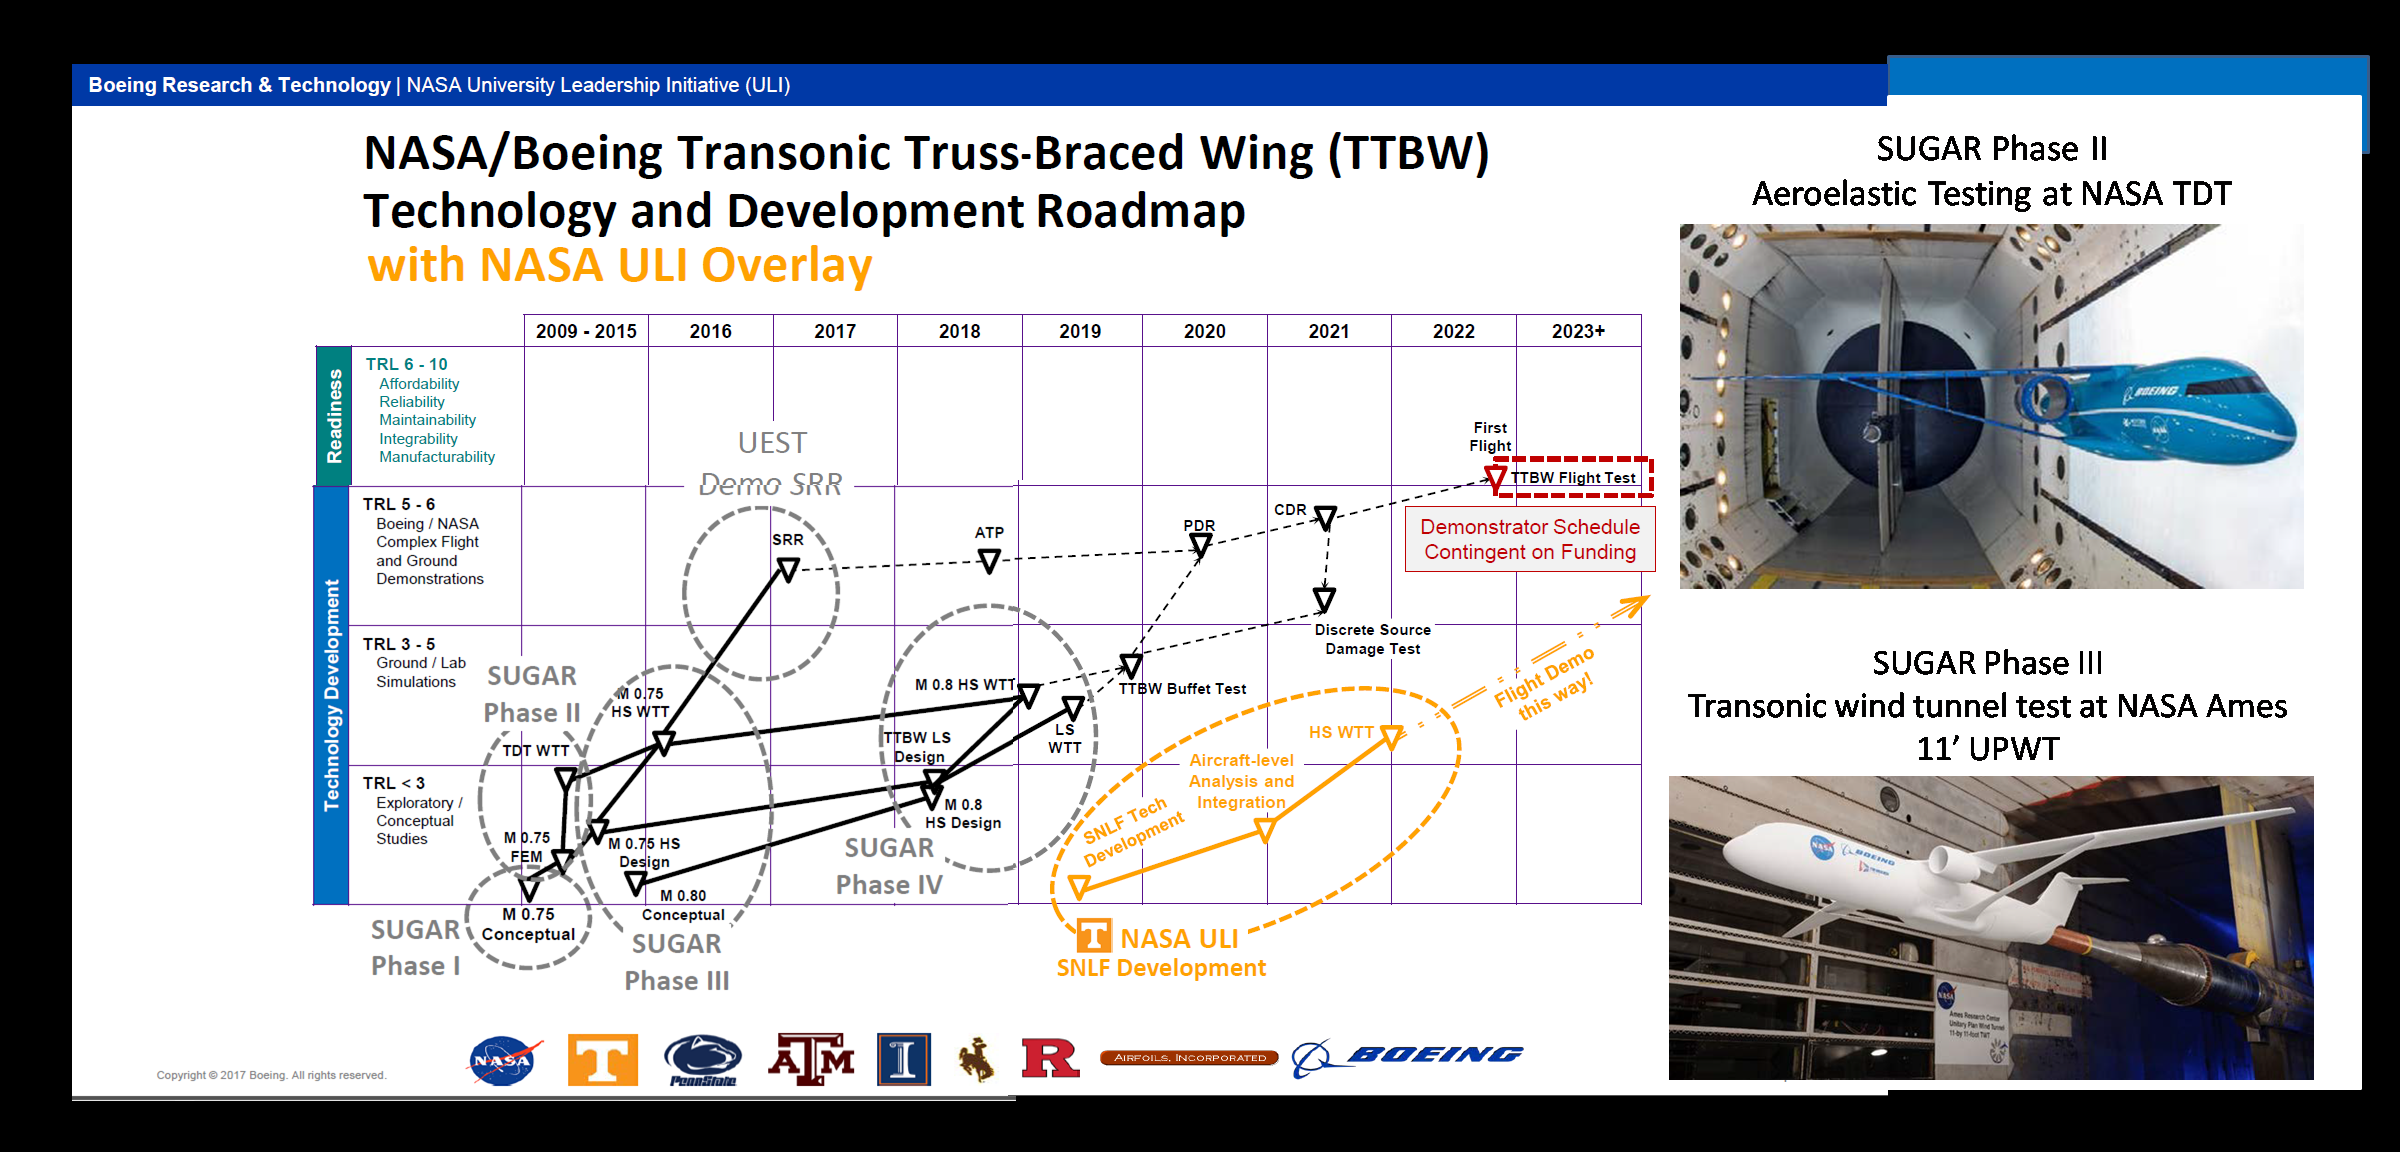


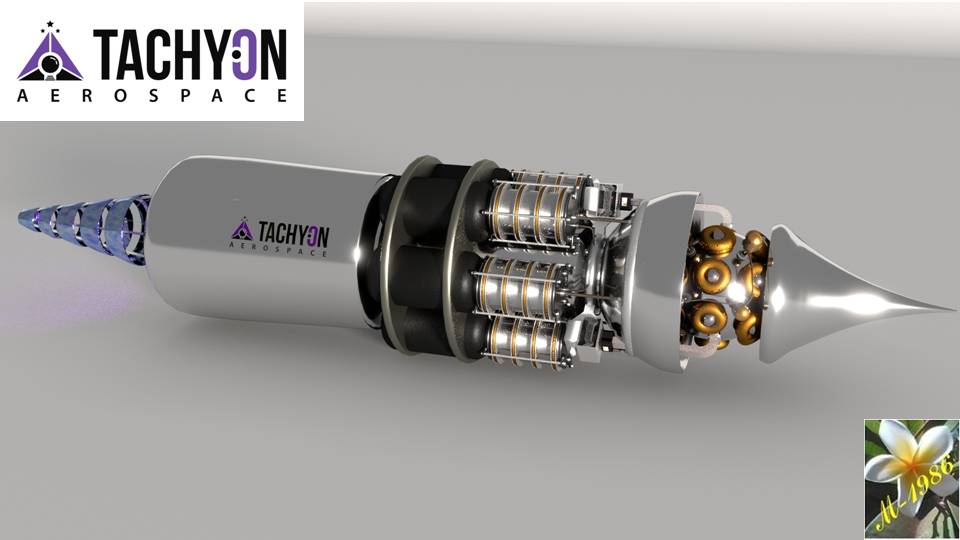


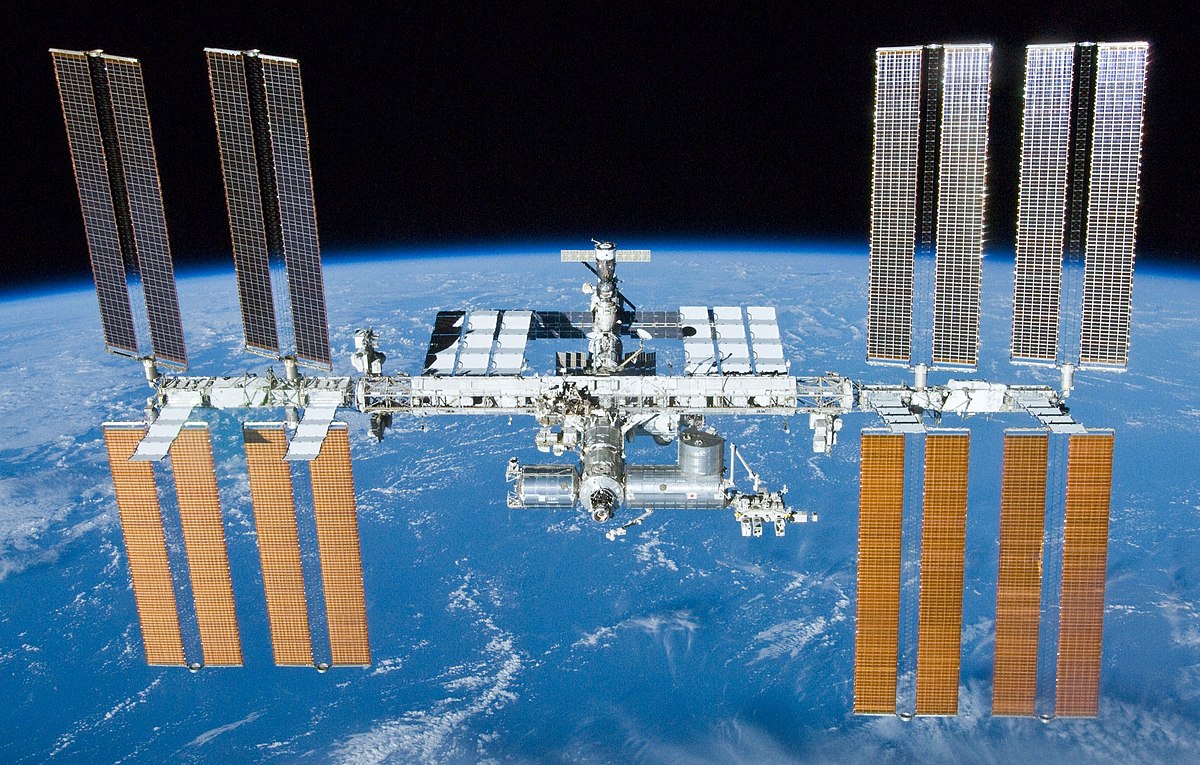
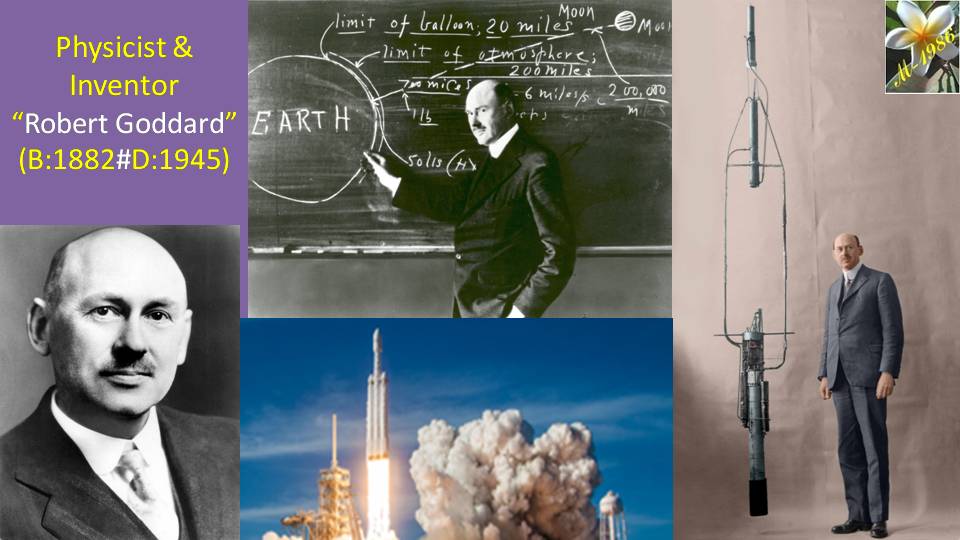
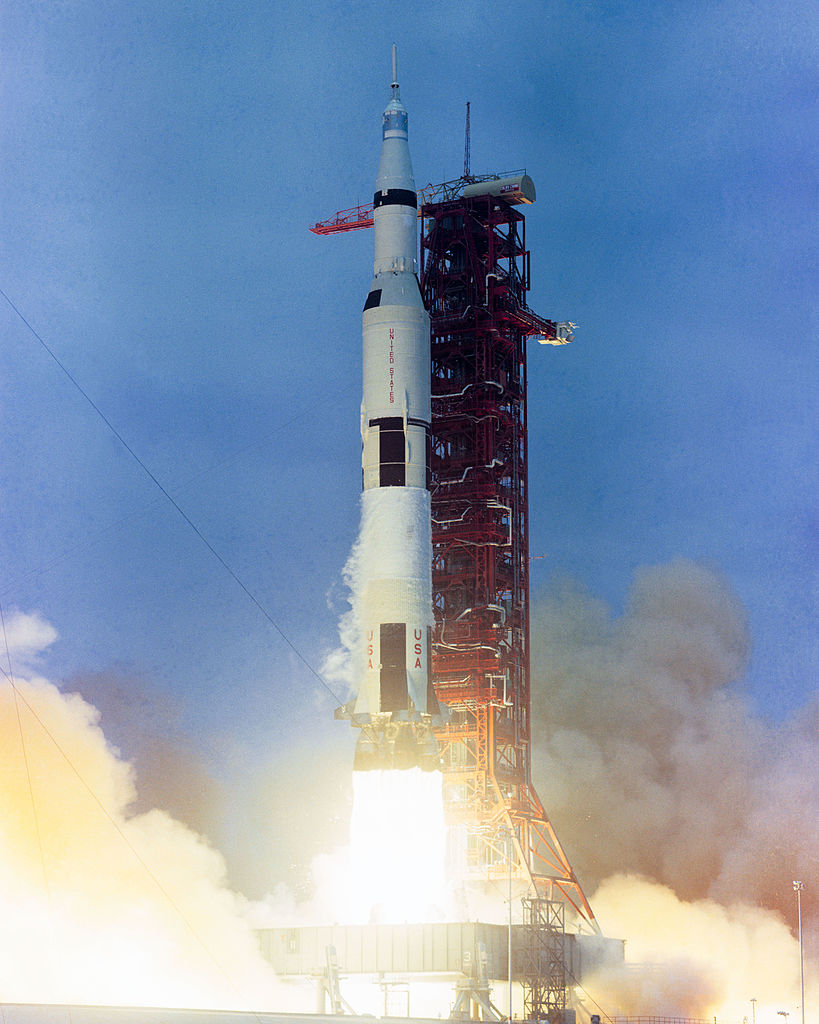
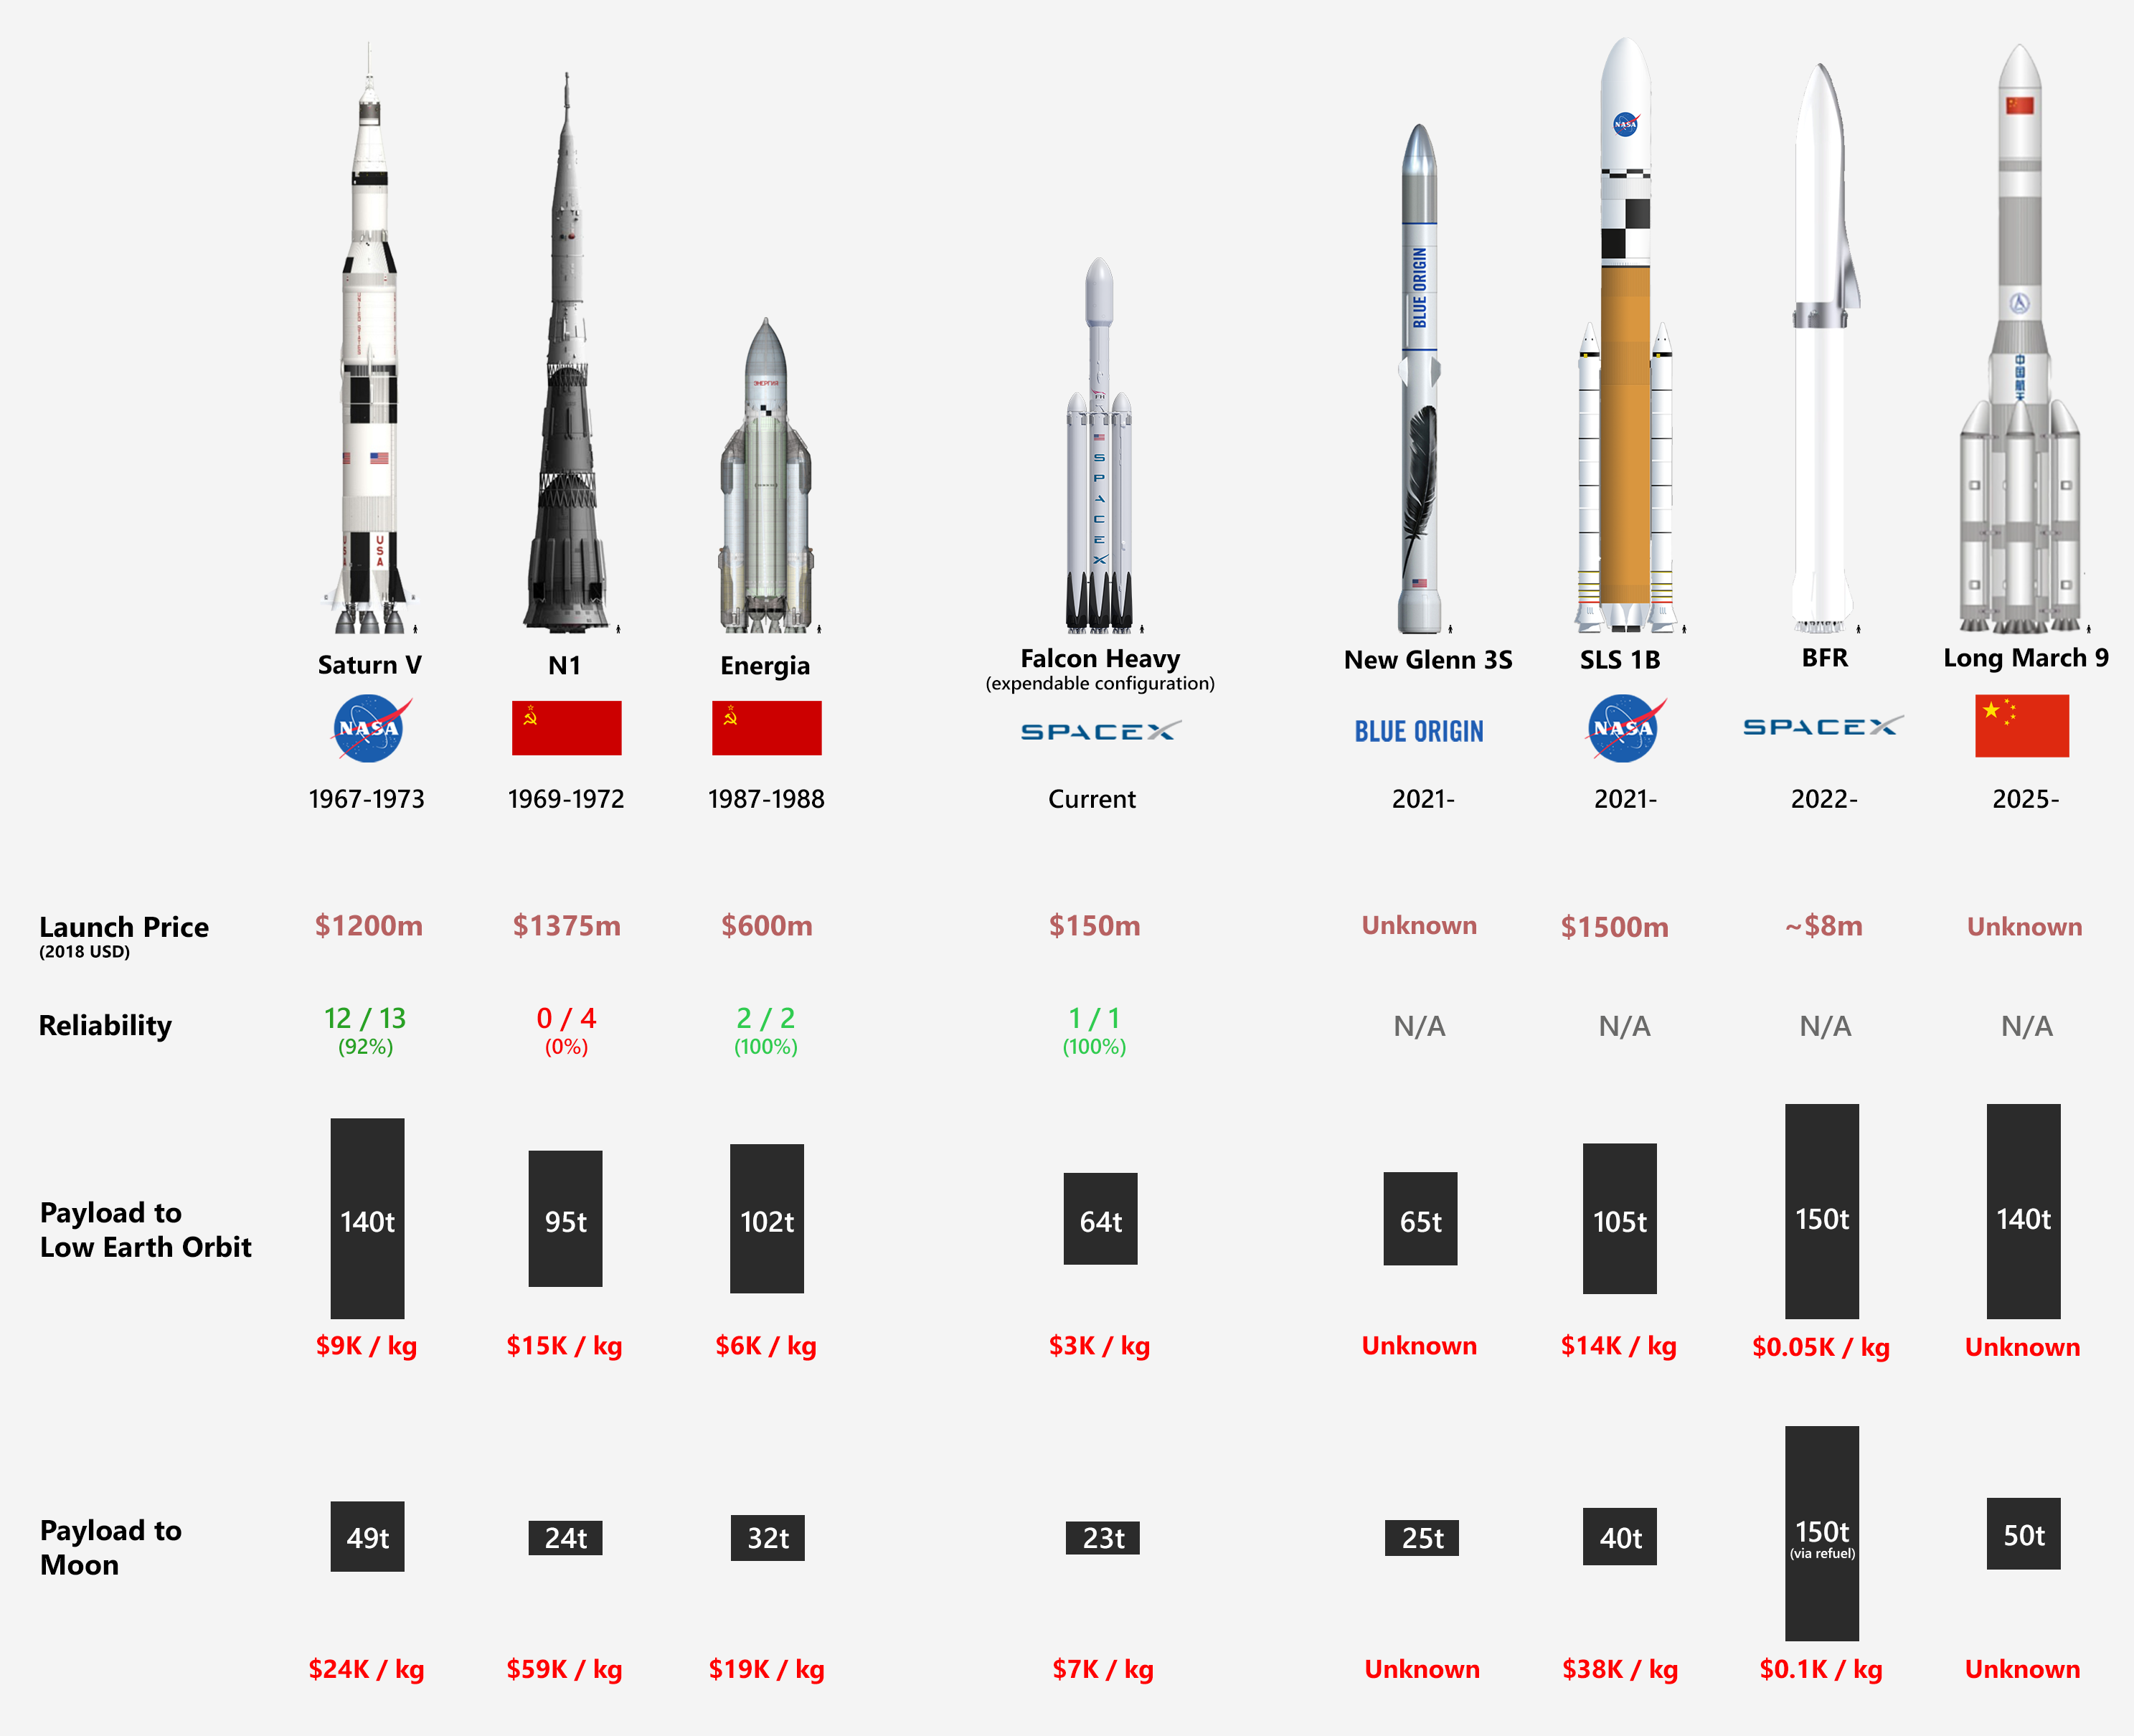
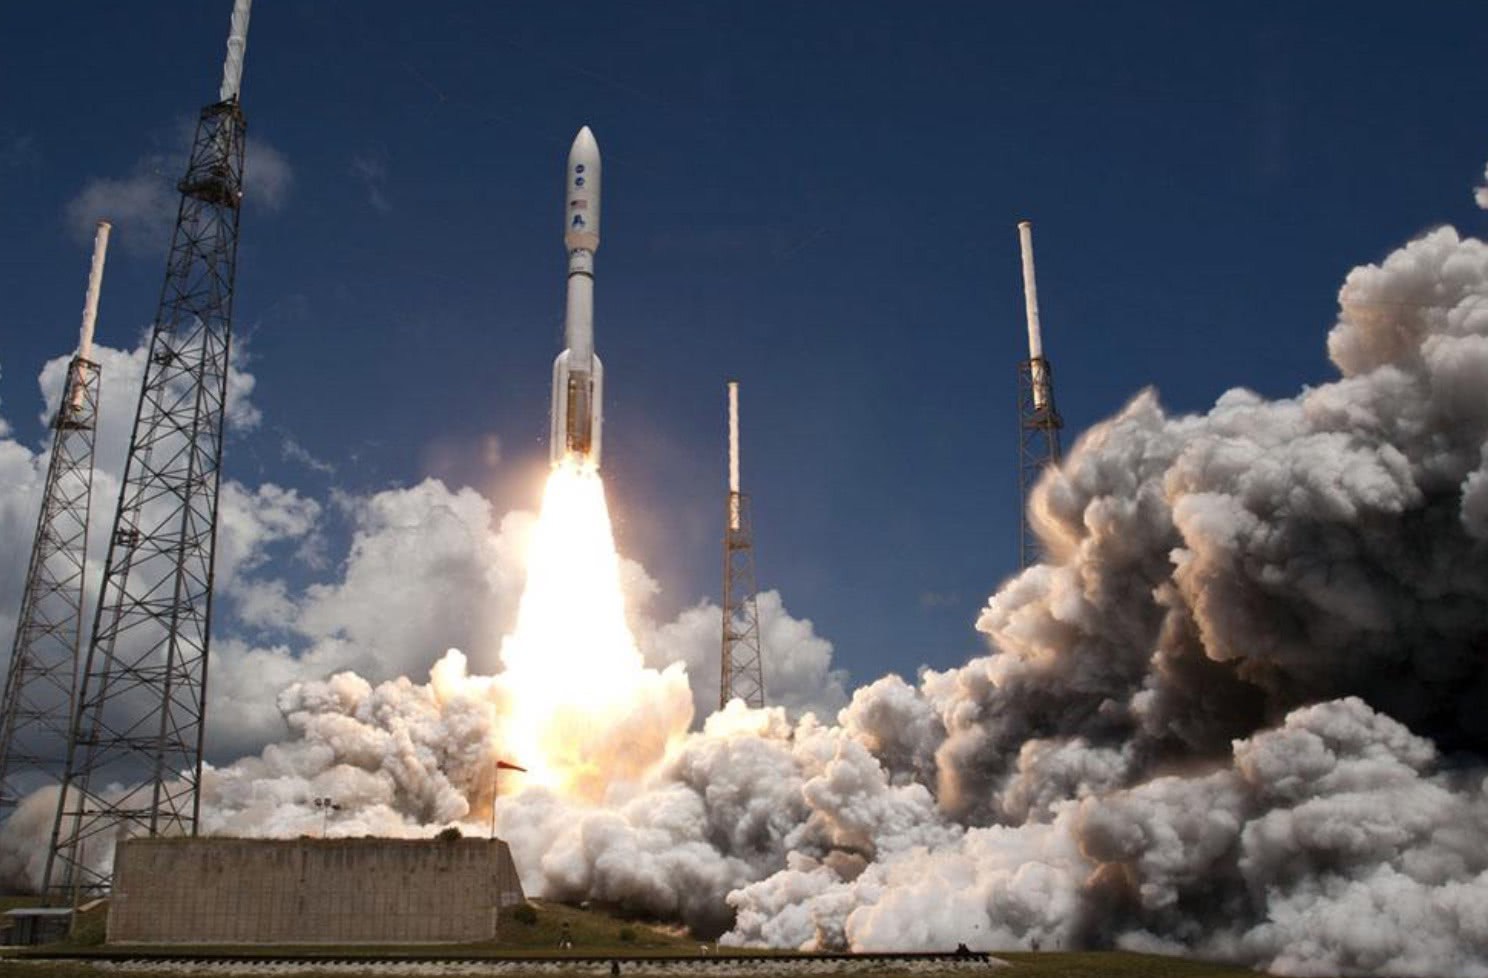

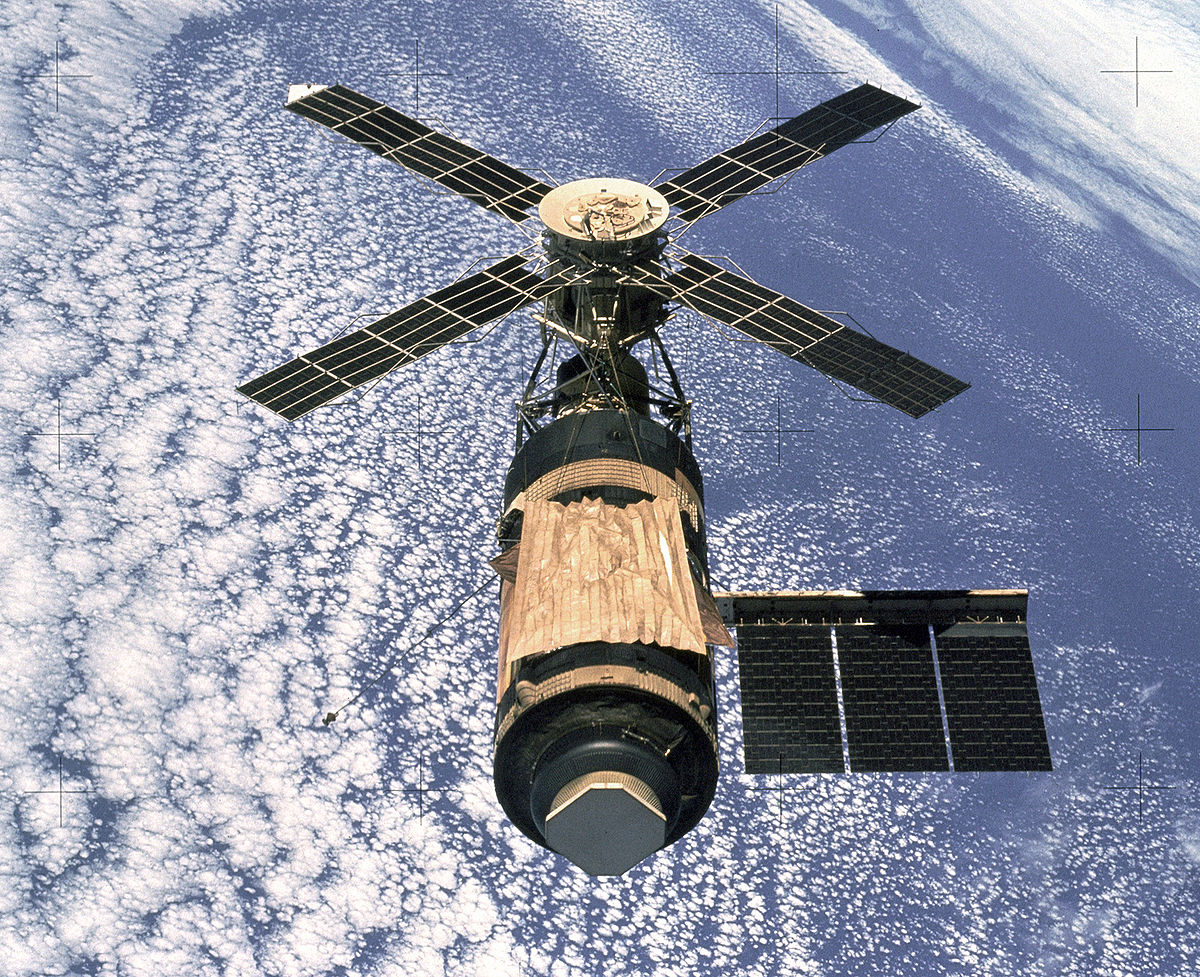
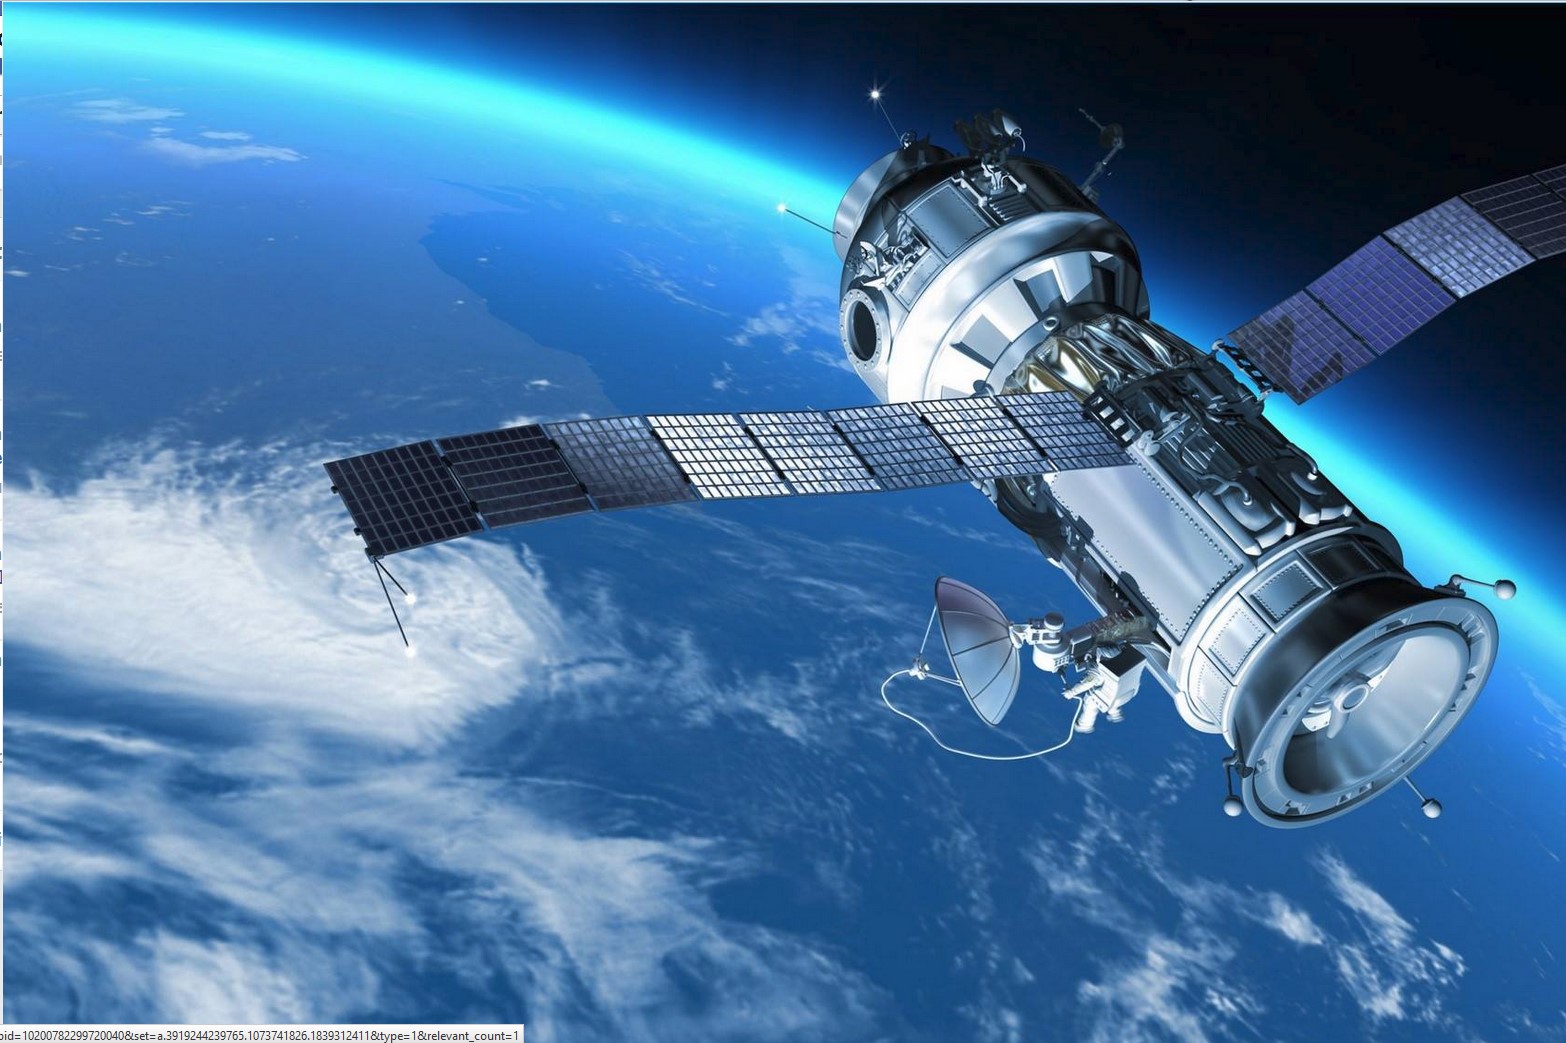
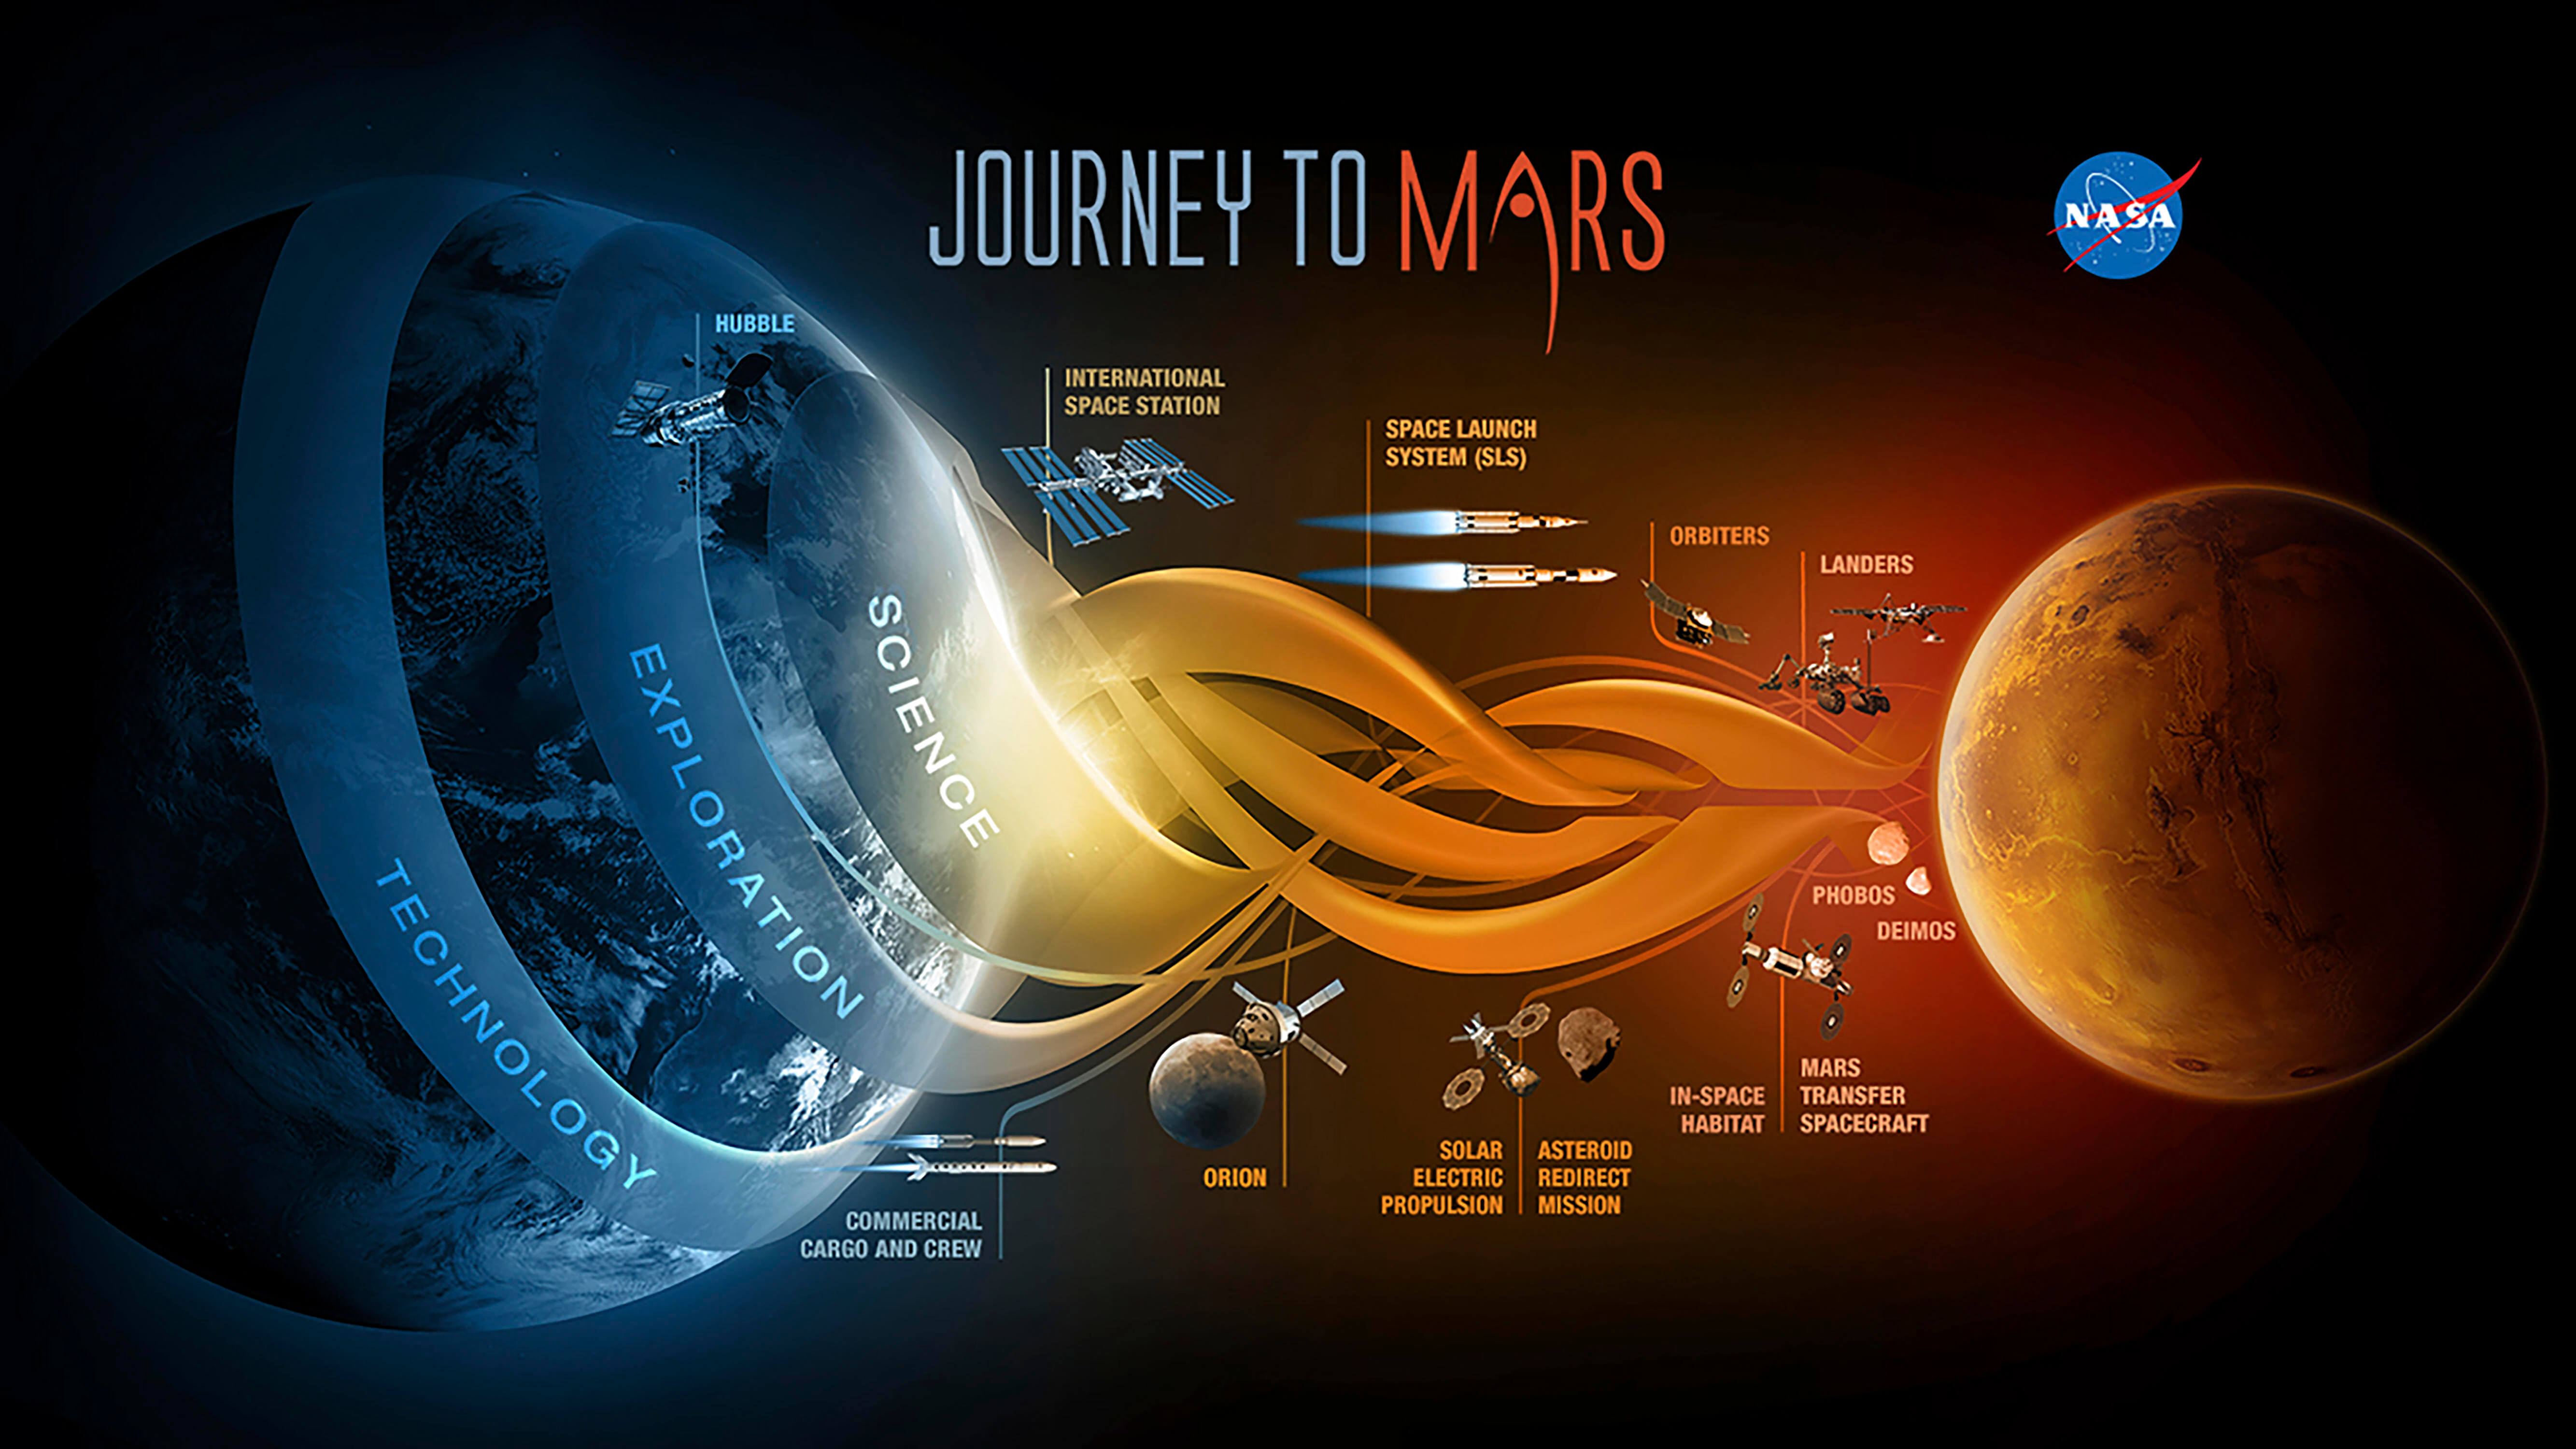


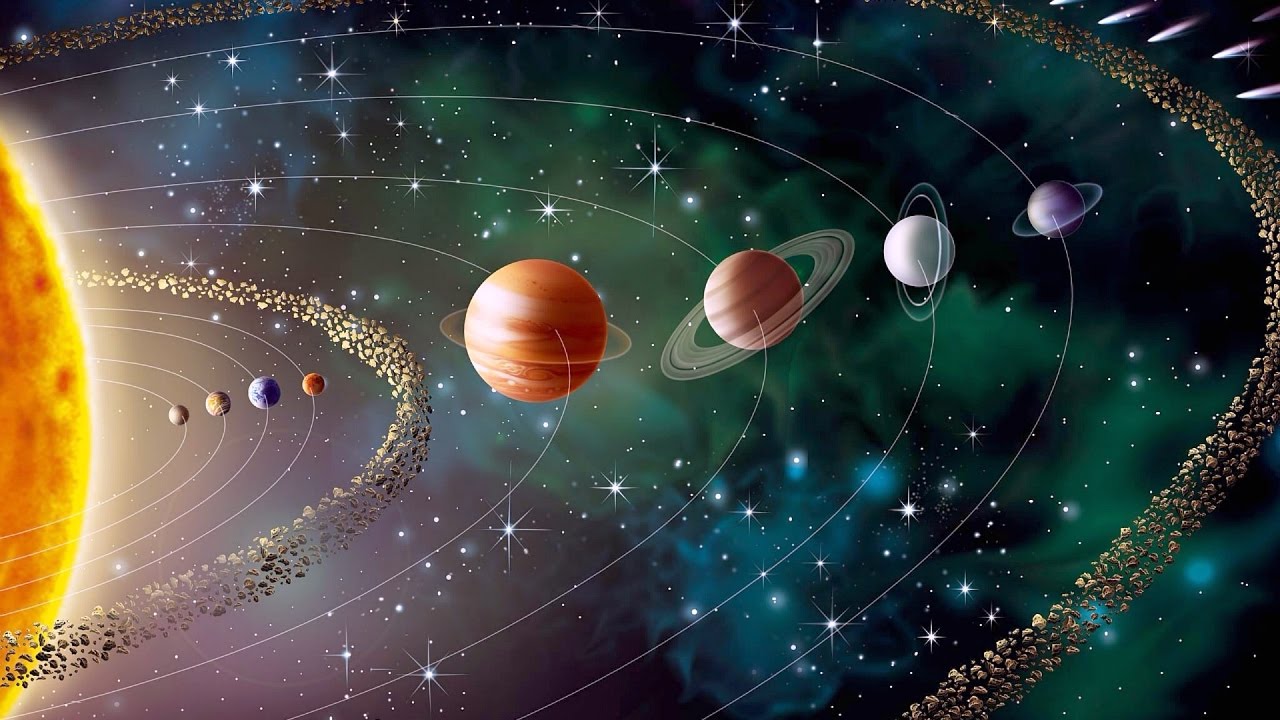

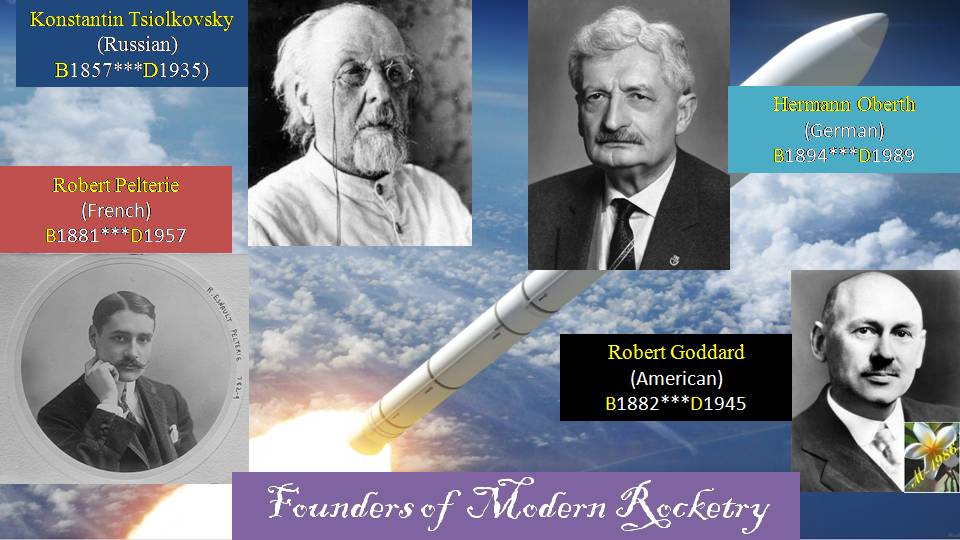
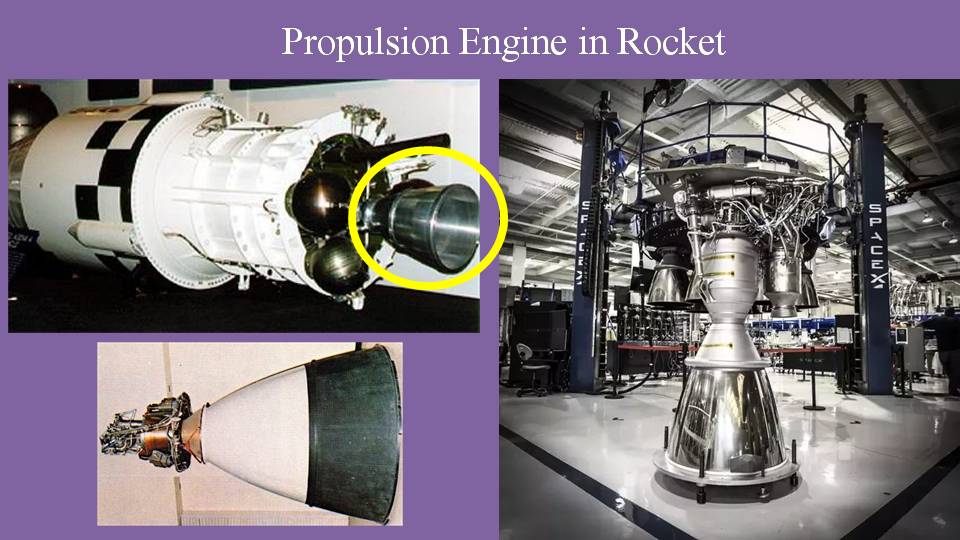
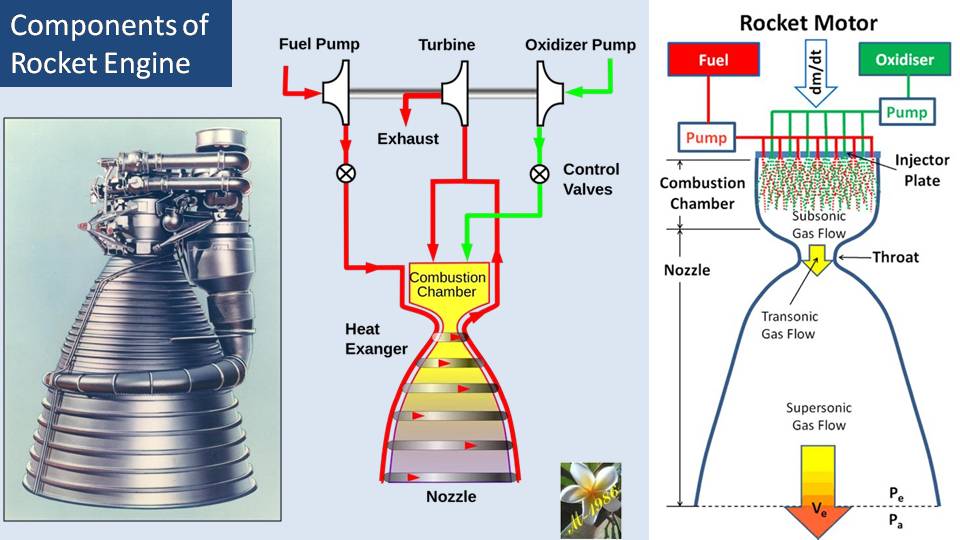
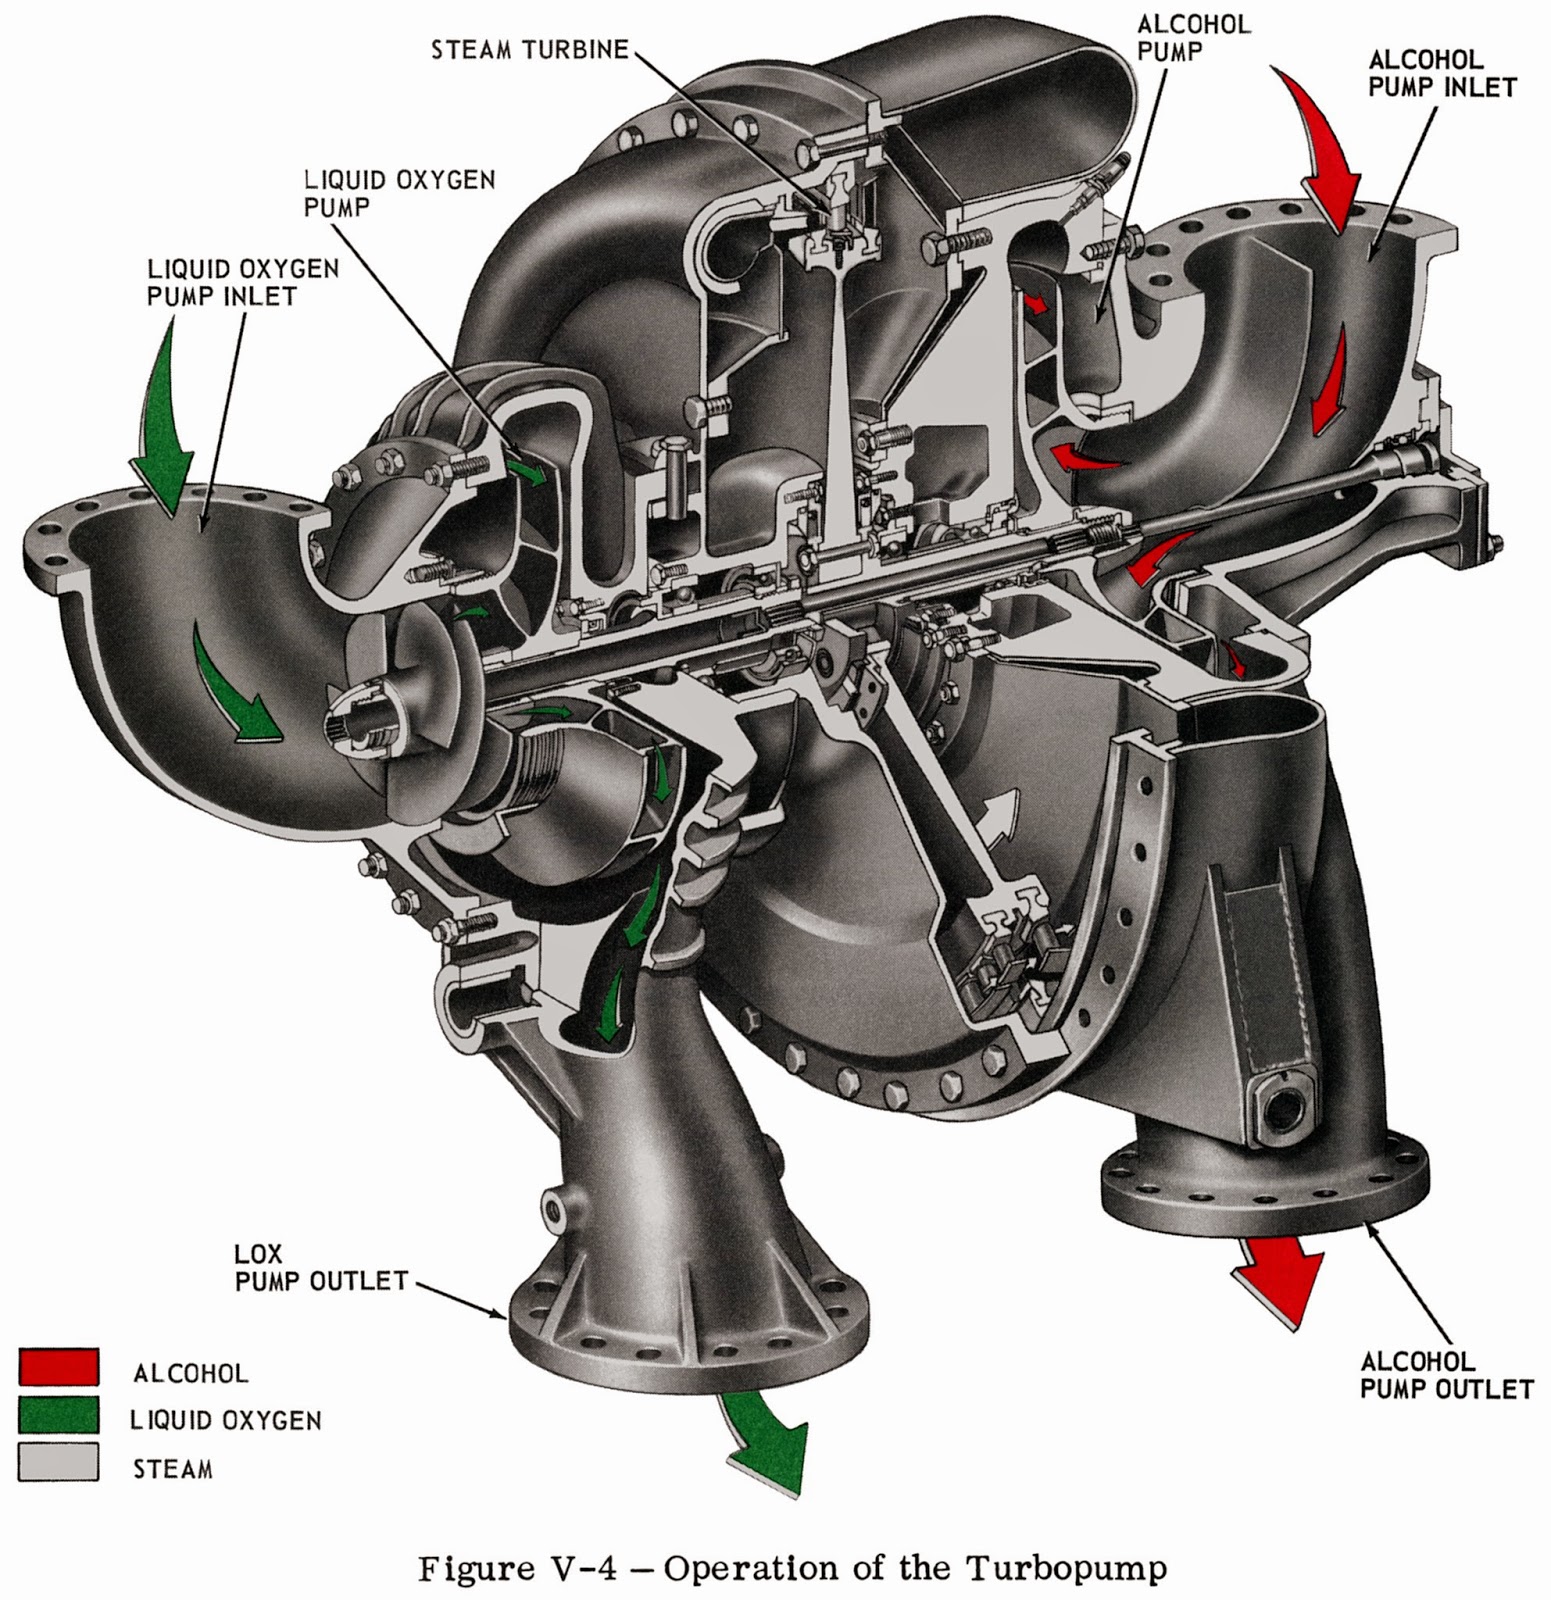 Figure (19) – Turbo Pump in Rocket